. 2023 Jun 19;13(1):9929.
doi: 10.1038/s41598-023-37146-5.

Paraoxonase 2 (PON2) plays a limited role in murine lung tumorigenesis

Affiliations

Paraoxonase 2 (PON2) plays a limited role in murine lung tumorigenesis

Aaron G Whitt et al. Sci Rep. .

Abstract

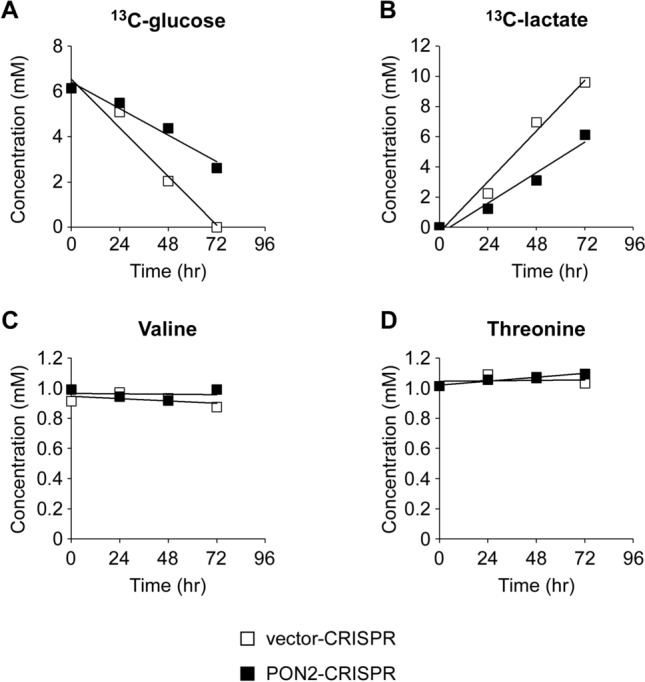
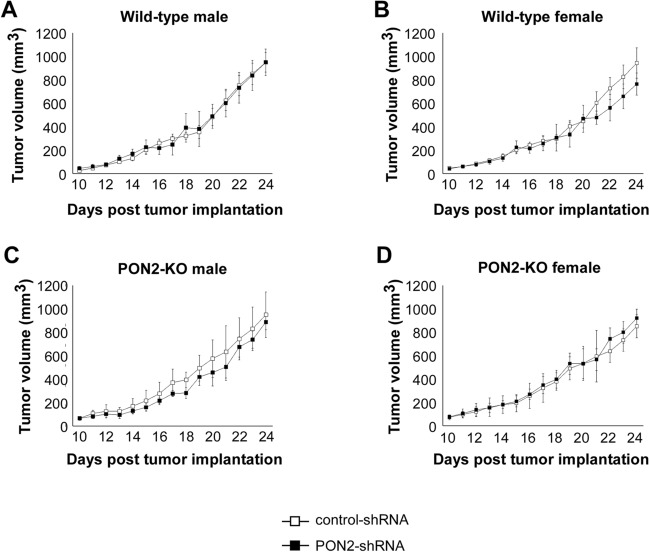
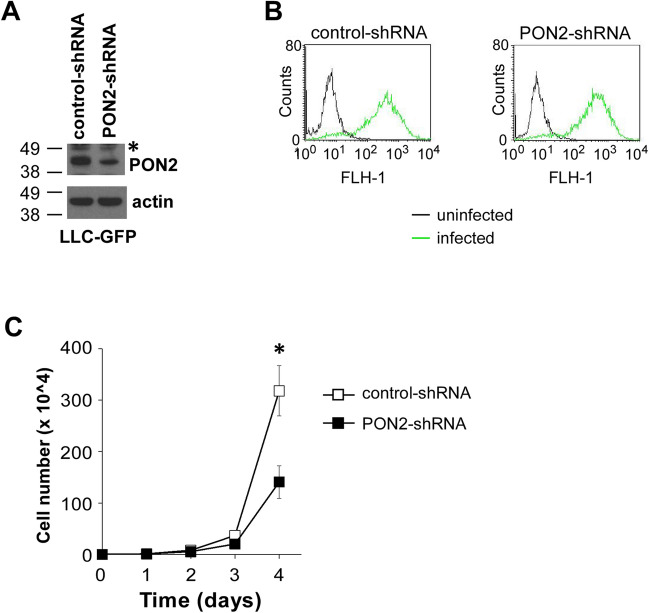
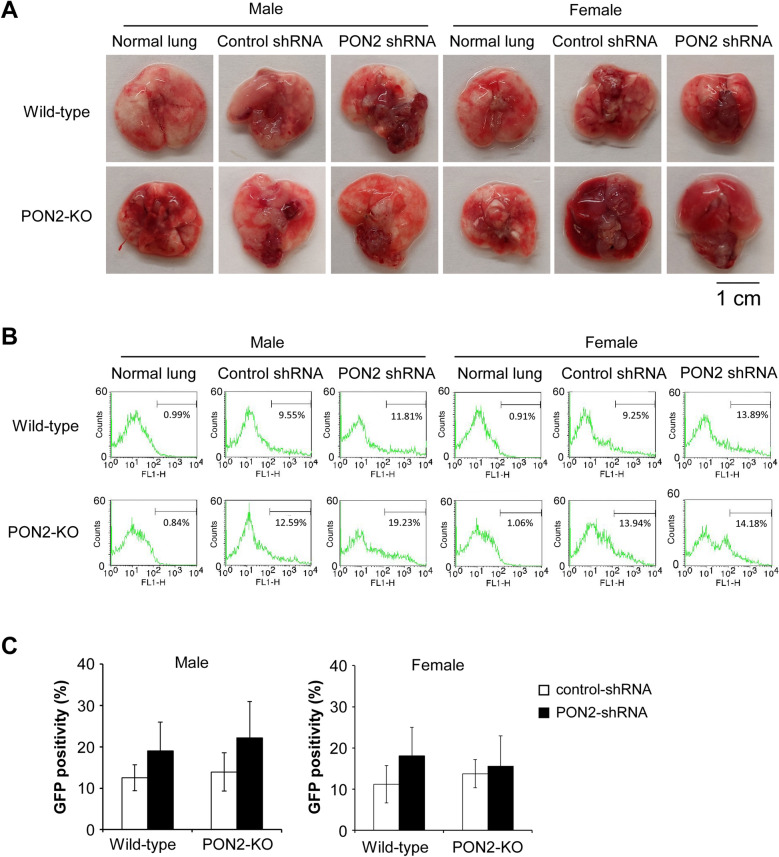
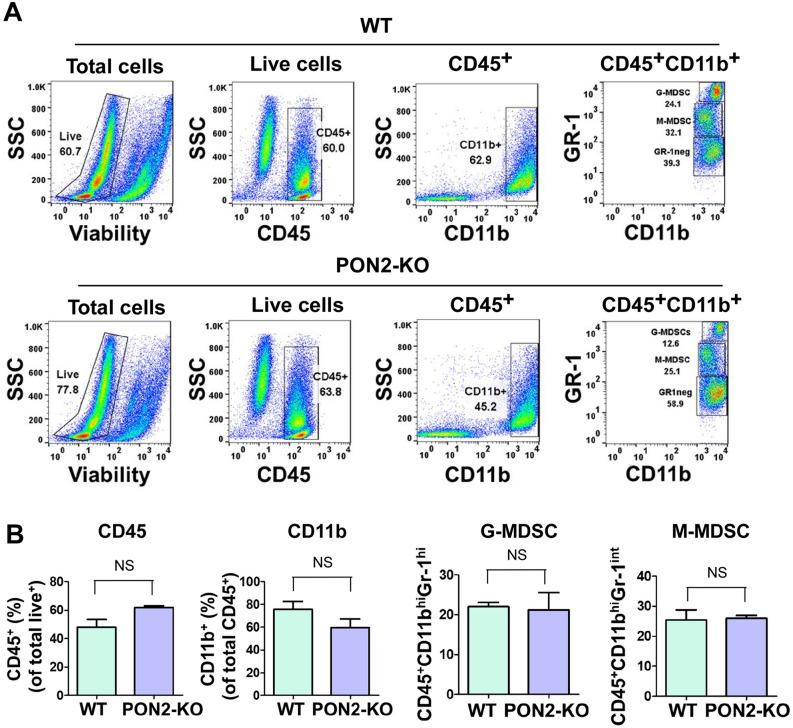
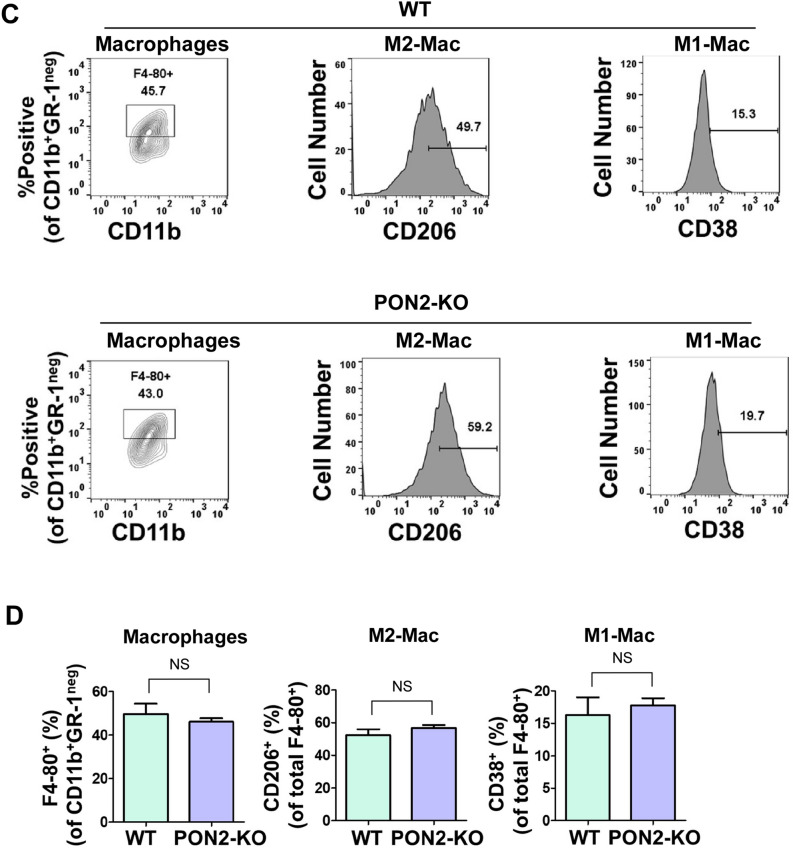
Paraoxonase 2 (PON2) is a multifunctional intracellular enzyme that has received growing attention for its ability to modulate various aspects of normal and malignant cellular physiology. Recent research has revealed that PON2 is upregulated in tissues from patients with various types of solid tumors and hematologic cancers, likely due to its ability to suppress oxidative stress and evade apoptosis. However, the effects of PON2 on pulmonary oncogenesis are unknown. Here, we conducted studies to investigate how PON2 influences lung cancer cell proliferation in vitro and lung tumorigenesis in vivo using a variety of cellular and animal models. It was found that PON2 expression deficiency hampered the proliferation of cultured lung cancer cells with concomitant cell cycle arrest at the G1 phase. In addition, the loss of endogenous PON2 expression impaired key aspects of oxidative metabolism in lung adenocarcinoma cells. Moreover, we investigated how the interplay between PON2 expression in lung tumors and host mice influences lung tumor initiation and progression. PON2 status in both transplanted tumor cells and mice failed to influence the development of subcutaneously grafted Lewis lung carcinoma (LLC) tumors, orthotopically implanted LLC tumors, and oncogenic Kras-driven primary lung adenocarcinoma tumors. Importantly, the frequencies of tumor-infiltrating myeloid subsets that include myeloid-derived suppressor cells (MDSCs) and tumor-associated macrophages were not impacted by PON2 expression in LLC tumor-bearing mice. Overall, our studies indicate that PON2 plays a limited role in murine lung tumorigenesis.


Conflict of interest statement

The authors declare no competing interests.

Figures

Figure 1
Figure 1
Reducing PON2 expression impairs the proliferation of murine cancer cell LLC. (A) PON2 expression in the indicated LLC cells was detected by western blot analysis. The molecular weight markers are labeled on the left (kD). “*” indicates a non-specific band. (B) Control- and PON2-shRNA LLC cells were treated with increasing concentrations of C12 for 24 h and cell viability was determined by PI exclusion via flow cytometry. Data are mean ± SD of three independent experiments. (C) Caspase-3/7 activation in the indicated LLC cells was measured following 2-h exposure to DMSO or C12. Mean ± SD of three independent experiments is shown. (D) Cell proliferation was measured by cell counting over a four-day period in control- and PON2-shRNA LLC cells. Data are presented as mean ± SD of three independent experiments. (E) DNA content in control- and PON2-shRNA LLC cells was measured by flow cytometry. (F) Data shown in (E) were analyzed using FloJo software to determine the cell cycle stages of LLC cells. Mean ± SD of three independent experiments is shown. For all the data, asterisks indicate p-values of ˂ 0.05 (*), ˂ 0.01 (**) by Student’s unpaired t test. NS No significance.
Figure 2
Figure 2
PON2 is required for human lung adenocarcinoma cellular proliferation. (A) PON2 expression was reduced in A549 cells by RNAi. Western blot analysis shows PON2 protein levels in A549 cells expressing control- or PON2-specific shRNA. The molecular weight markers are labeled on the left (kD). (B) The proliferation of the indicated A549 cells was determined by cell counting. Data are presented as mean ± SD of three independent experiments. (C) Representative cell cycle profiles of the indicated A549 cells are shown. (D) The cell cycle stages of A549 cells shown in (C) were evaluated. Data are presented as mean ± SD of three independent experiments. (E) PON2 expression was analyzed by western blot in the indicated NCI-H1299 cell lines. The molecular weight markers are labeled on the left (kD). (F) The proliferation of NCI-H1299 cells was determined by cell counting. Mean ± SD of three independent experiments is shown. (G) The cell cycle profile of NCI-H1299 vector-CRISPR (line #1) and PON2-CRISPR (line #1) cells was evaluated. (H) The cell cycle stages of NCI-H1299 cells presented in (G) were examined. Data are mean ± SD of three independent experiments. For all the data, asterisks indicate p-values of < 0.05 (*), < 0.01 (**) by Student’s unpaired t-test. NS No significance.
Figure 3
Figure 3
PON2 deficiency impairs extracellular glucose consumption and lactate production in NCI-H1299 cells. Vector- and PON2-CRISPR NCI-H1299 cells were cultured in the medium supplemented with [U-13C]-glucose. The culture medium was collected at 0-, 24-, 48- and 72-h timepoints. Key extracellular metabolites, including 13C-glucose (A), 13C-lactate (B), valine (C), and threonine (D) were quantified by 1D 1H NMR analysis. Lines are linear regression fits.
Figure 4
Figure 4
The growth of subcutaneously grafted LLC tumors is independent of PON2 expression levels. LLC cells expressing control-shRNA or PON2-shRNA (1 × 105) were injected into the rear flanks of wild-type male (A), wild-type female (B), PON2-KO male (C), or PON2-KO female (D) mice, and tumor burden was examined over 24 days. Data are mean ± SD for 5 mice per group.
Figure 5
Figure 5
PON2 expression is required for the proliferation of murine lung carcinoma cells expressing GFP. (A) GFP protein was expressed in control- and PON2-shRNA LLC cells by retroviral expression, and PON2 expression was examined by western blot. The molecular weight markers are labeled on the left (kD). (B) Fluorescence intensity of GFP in control- and PON2-shRNA LLC cells was determined by flow cytometry. (C) The proliferation of GFP-positive LLC cells expressing control- or PON2-shRNA was evaluated. The data are shown as mean ± SD of three independent experiments. Asterisks indicate p-values of ˂ 0.05 (*) by Student’s unpaired t test.
Figure 6
Figure 6
The development of intrathoracic lung tumors is not affected by PON2 expression in implanted LLC cells or host mice. (A) Wild-type and PON2-KO mice developed intrathoracic tumors following percutaneously administration of GFP-positive control- or PON2-shRNA LLC cells. Representative images of lung and tumor tissues acquired ten days after administering LLC cells. (B) Orthotopic lung tumor burden was evaluated by determining GFP-positivity of mouse lung and tumor tissues shown in (A). Lung tissues bearing GFP-expressing LLC tumors were collected. Single cell suspension of pulmonary cells was acquired and GFP fluorescence was evaluated by flow cytometry. Representative flow cytometry plots are shown. (C) Summary of the data presented in (B). Data are mean ± SD of 5 mice per group. Statistical significance was determined by two-way ANOVA. No significant difference was discovered as related to PON2 expression status of LLC cells, genetic background of hosts, or mouse sex.
Figure 7
Figure 7
Primary lung adenocarcinoma development in mice is independent of PON2 expression. (A) Representative digital slide images of five serial sections of a lung separated by 200 μM and stained with hematoxalin and eosin (H&E). (B) Representative digital slide images of H&E-stained lungs collected from wild-type/KrasLSL-G12D and PON2-KO/KrasLSL-G12D mice. Inlets show selected lung tumor sections at 10X magnification. (C) Tumor burden (%) was quantified by comparing tumor cross-sectional area to whole lung cross-sectional area and was determined at 5 depths per lung. Male wild-type/KrasLSL-G12D (n = 4 mice); male PON2-KO/KrasLSL-G12D (n = 6 mice); female wild-type/KrasLSL-G12D (n = 6 mice); female PON2-KO/KrasLSL-G12D (n = 5 mice). Each data point in the bar graphs represents an individual tissue section. No significant differences in tumor burden were detected between wild-type and PON2-deficient mice of either sex. Data are shown as mean ± SD; each point represents an individual section. A two-way ANOVA was used to determine statistical significance.
Figure 8
Figure 8
Host PON2 status does not influence the frequencies of MDSCs and the polarization states of macrophages in LLC tumors. Female WT or PON2-KO mice (n = 3 mice/group) were subcutaneously injected with 2 × 105 LLC cells and euthanized 21 days after tumor challenge. Subsequently, tumors were removed and enzymatically digested to generate a single cell suspension. Tumor-infiltrating cells from WT and PON2-KO mice were stained with antibodies against surface markers to identify G-MDSCs, M-MDSCs, M1- and M2-macrophages, and analyzed by flow cytometry. Tumor-infiltrating immune cells were identified by CD45, a pan-hematopoietic marker. (A) Representative dot plot evaluation of intratumoral G-MDSCs (CD45+CD11b+Gr-1hi) and M-MDSCs (CD45+CD11b+Gr-1int). (B) Summary of the data presented in (A). Bar graphs show the percentages of CD45+ cells in total live cells, CD11b+ cells in CD45+ cells, Gr-1hi G-MDSCs in CD45+CD11b+ cells, and Gr-1int M-MDSCs in CD45+CD11b+ cells, respectively. Data are mean ± SEM of n = 3 mice in WT or PON2-KO group. NS = no significance. (C) Representative contour plot analysis of macrophages (CD45+CD11b+Gr-1negF4-80+) and histogram analysis of M1-macrophages (CD45+CD11b+Gr-1negF4-80+CD38+) and M2-macrophages (CD45+CD11b+Gr-1negF4-80+CD206+). (D) Bar graphs showing the percentages of intratumoral F4-80+ macrophages in CD45+CD11b+Gr-1neg cells, CD206+ cells in CD45+CD11b+Gr-1negF4-80+ macrophage population (M2-Mac), and CD38+ cells in CD45+CD11b+Gr-1negF4-80+ macrophage population (M1-Mac), respectively. Data are presented as mean ± SEM with 3 mice in WT or PON2-KO group. NS no significance.
Figure 8
Figure 8
Host PON2 status does not influence the frequencies of MDSCs and the polarization states of macrophages in LLC tumors. Female WT or PON2-KO mice (n = 3 mice/group) were subcutaneously injected with 2 × 105 LLC cells and euthanized 21 days after tumor challenge. Subsequently, tumors were removed and enzymatically digested to generate a single cell suspension. Tumor-infiltrating cells from WT and PON2-KO mice were stained with antibodies against surface markers to identify G-MDSCs, M-MDSCs, M1- and M2-macrophages, and analyzed by flow cytometry. Tumor-infiltrating immune cells were identified by CD45, a pan-hematopoietic marker. (A) Representative dot plot evaluation of intratumoral G-MDSCs (CD45+CD11b+Gr-1hi) and M-MDSCs (CD45+CD11b+Gr-1int). (B) Summary of the data presented in (A). Bar graphs show the percentages of CD45+ cells in total live cells, CD11b+ cells in CD45+ cells, Gr-1hi G-MDSCs in CD45+CD11b+ cells, and Gr-1int M-MDSCs in CD45+CD11b+ cells, respectively. Data are mean ± SEM of n = 3 mice in WT or PON2-KO group. NS = no significance. (C) Representative contour plot analysis of macrophages (CD45+CD11b+Gr-1negF4-80+) and histogram analysis of M1-macrophages (CD45+CD11b+Gr-1negF4-80+CD38+) and M2-macrophages (CD45+CD11b+Gr-1negF4-80+CD206+). (D) Bar graphs showing the percentages of intratumoral F4-80+ macrophages in CD45+CD11b+Gr-1neg cells, CD206+ cells in CD45+CD11b+Gr-1negF4-80+ macrophage population (M2-Mac), and CD38+ cells in CD45+CD11b+Gr-1negF4-80+ macrophage population (M1-Mac), respectively. Data are presented as mean ± SEM with 3 mice in WT or PON2-KO group. NS no significance.

Similar articles

Cited by

References

    1. Draganov DI, La Du BN. Pharmacogenetics of paraoxonases: A brief review. Naunyn. Schmiedebergs Arch. Pharmacol. 2004;369(1):78–88. doi: 10.1007/s00210-003-0833-1. - DOI - PubMed
    1. Draganov DI, Teiber JF, Speelman A, Osawa Y, Sunahara R, La Du BN. Human paraoxonases (PON1, PON2, and PON3) are lactonases with overlapping and distinct substrate specificities. J. Lipid Res. 2005;46(6):1239–1247. doi: 10.1194/jlr.M400511-JLR200. - DOI - PubMed
    1. Altenhofer S, Witte I, Teiber JF, Wilgenbus P, Pautz A, Li H, et al. One enzyme, two functions: PON2 prevents mitochondrial superoxide formation and apoptosis independent from its lactonase activity. J. Biol. Chem. 2010;285(32):24398–24403. doi: 10.1074/jbc.M110.118604. - DOI - PMC - PubMed
    1. Witte I, Foerstermann U, Devarajan A, Reddy ST, Horke S. Protectors or traitors: The roles of PON2 and PON3 in atherosclerosis and cancer. J. Lipids. 2012;2012:342806. doi: 10.1155/2012/342806. - DOI - PMC - PubMed
    1. Devarajan A, Shih D, Reddy ST. Inflammation, infection, cancer and all that the role of paraoxonases. Adv. Exp. Med. Biol. 2014;824:33–41. doi: 10.1007/978-3-319-07320-0_5. - DOI - PMC - PubMed

Publication types