. 2023 Aug;33(8):585-603.
doi: 10.1038/s41422-023-00831-1. Epub 2023 Jun 19.

An invasive zone in human liver cancer identified by Stereo-seq promotes hepatocyte-tumor cell crosstalk, local immunosuppression and tumor progression

Affiliations

An invasive zone in human liver cancer identified by Stereo-seq promotes hepatocyte-tumor cell crosstalk, local immunosuppression and tumor progression

Liang Wu et al. Cell Res. 2023 Aug.

Abstract

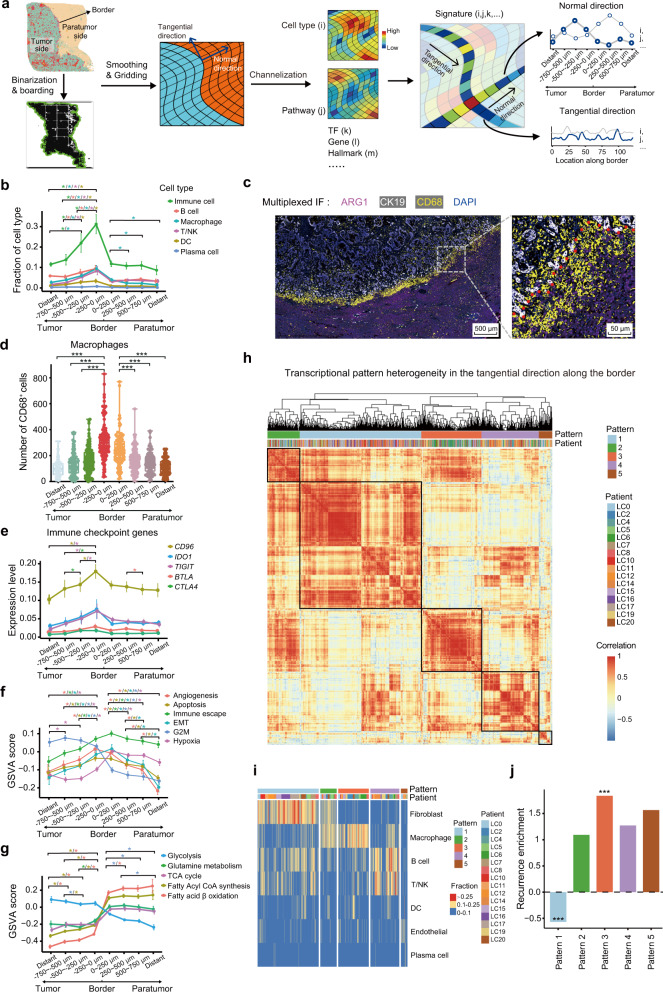
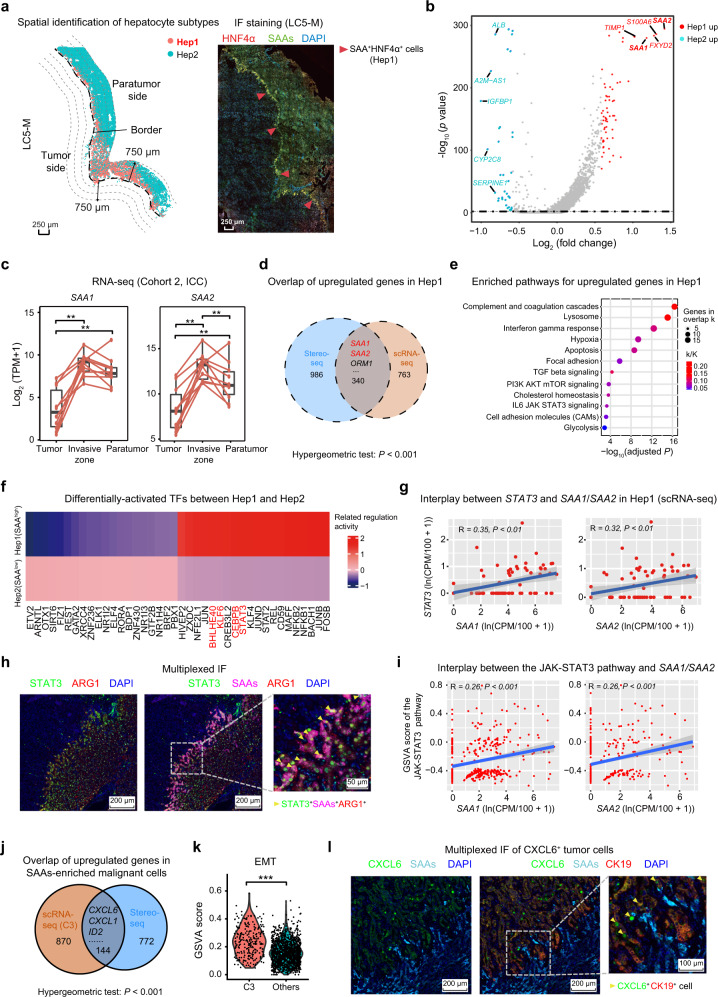
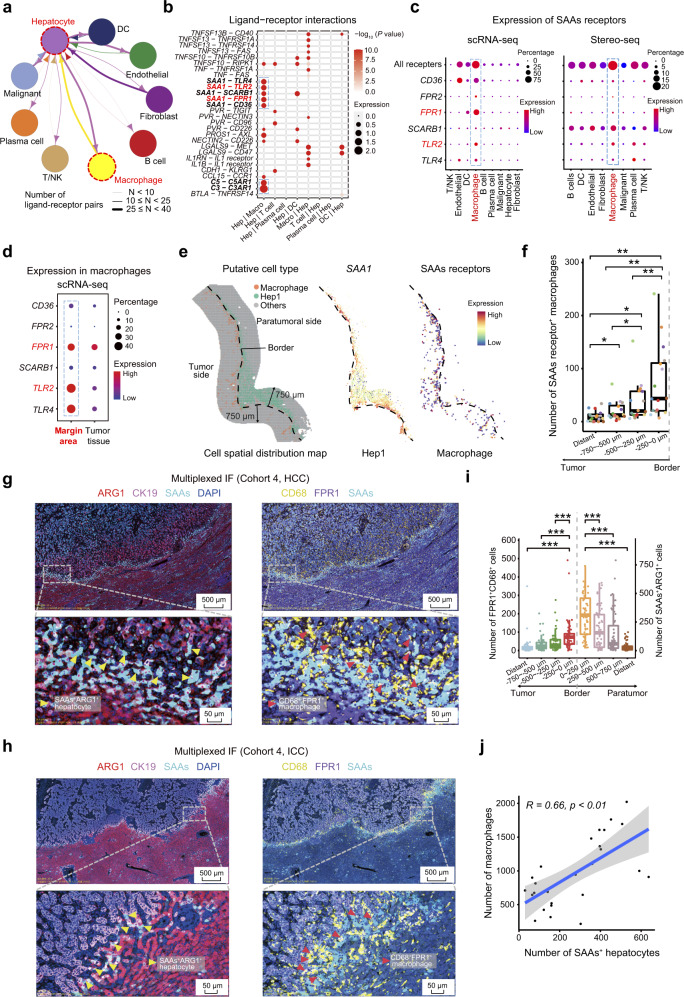
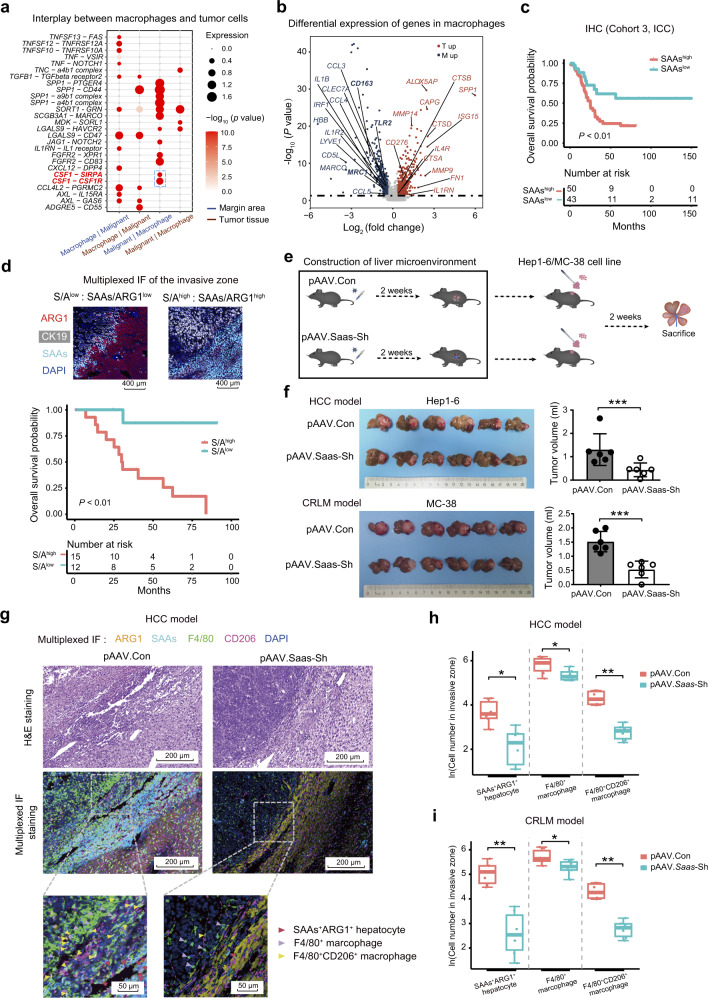
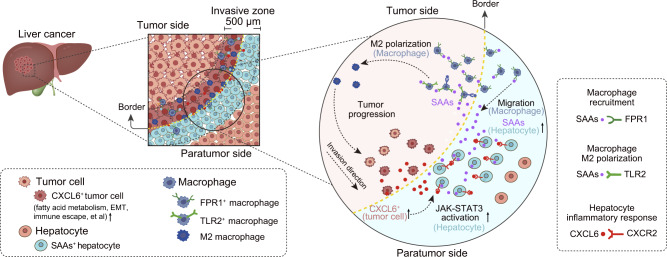
Dissecting and understanding the cancer ecosystem, especially that around the tumor margins, which have strong implications for tumor cell infiltration and invasion, are essential for exploring the mechanisms of tumor metastasis and developing effective new treatments. Using a novel tumor border scanning and digitization model enabled by nanoscale resolution-SpaTial Enhanced REsolution Omics-sequencing (Stereo-seq), we identified a 500 µm-wide zone centered around the tumor border in patients with liver cancer, referred to as "the invasive zone". We detected strong immunosuppression, metabolic reprogramming, and severely damaged hepatocytes in this zone. We also identified a subpopulation of damaged hepatocytes with increased expression of serum amyloid A1 and A2 (referred to collectively as SAAs) located close to the border on the paratumor side. Overexpression of CXCL6 in adjacent malignant cells could induce activation of the JAK-STAT3 pathway in nearby hepatocytes, which subsequently caused SAAs' overexpression in these hepatocytes. Furthermore, overexpression and secretion of SAAs by hepatocytes in the invasive zone could lead to the recruitment of macrophages and M2 polarization, further promoting local immunosuppression, potentially resulting in tumor progression. Clinical association analysis in additional five independent cohorts of patients with primary and secondary liver cancer (n = 423) showed that patients with overexpression of SAAs in the invasive zone had a worse prognosis. Further in vivo experiments using mouse liver tumor models in situ confirmed that the knockdown of genes encoding SAAs in hepatocytes decreased macrophage accumulation around the tumor border and delayed tumor growth. The identification and characterization of a novel invasive zone in human cancer patients not only add an important layer of understanding regarding the mechanisms of tumor invasion and metastasis, but may also pave the way for developing novel therapeutic strategies for advanced liver cancer and other solid tumors.


Conflict of interest statement

The authors declare no competing interests.

Figures

Fig. 1
Fig. 1. Spatially-resolved transcriptomic profiles in multiple regional sites in primary human liver cancer.
a A summary of the study. The spatial transcriptomics (Stereo-seq, 53 samples) and scRNA-seq (16 samples) acquisition workflow for 23 patients with liver cancer (HCC, n = 6; ICC, n = 17) were analyzed as the discovery cohort. Validation cohort 1 included 105 patients with primary liver cancer (HCC, n = 53; ICC, n = 52). The pan-cancer cohort patients in validation cohort 4 included those with HCC (n = 7), ICC (n = 20), and those with liver metastasis of colorectal cancer (n = 5), pancreatic cancer (n = 4), lung cancer (n = 5), gallbladder carcinoma (n = 5), gastric cancer (n = 5), and ovarian cancer (n = 5). FFPE tissue blocks from validation cohort 1 were subjected to both multiplexed immunofluorescence (IF) staining and immunohistochemistry (IHC) staining. Specimens from validation cohorts 2, 3, and 4 were subjected to RNA-seq, IHC, and multiplexed IF staining, respectively. The RNA-seq and protein data from validation cohort 5 were from our previously published paper. b H&E staining, gene count maps, and cell type maps of different sites (T, M, P, and LN) in samples from patients with liver cancer (LC4 and LC5). c The probabilistic inference of cell types at captured spatial transcriptomic spots (50 × 50 bins/spot, 25 µm × 25 µm squares). d Heatmap showing the expression levels of marker genes for different cell types in annotated spatial spots. T, tumor tissue; M, margin area; P, paratumor tissue; LN, lymph node; Mali/Chola, malignant cells or cholangiocytes.
Fig. 2
Fig. 2. The spatial heterogeneities in tissues from human liver cancer patients.
a H&E staining and heatmaps of the spatial distribution of the main cell types in multiple regions from patients with liver cancer (LC5-T, M, P, LN; LC20-M; LC4-LN). b Box plots showing the percentages of major cell types in all cell components, excluding parenchymal cells, in the four regional sites (T, n = 12; M, n = 21; P, n = 10; LN, n = 10) in the Stereo-seq data from 21 patients with liver cancer. Margin areas were further divided into the tumor part (M-T) and paratumor part (M-P) of the margin areas according to the location of the tumor border. c Three-dimensional diagrams showing the spatial distribution and aggregation of the main cell types in the four regions (LC5-T, M, P, LN). d Violin plots showing the Gene Set Variation Analysis (GSVA) scores of pathways in the five regions (T, n = 12; M-T, n = 21; M-P, n = 21; P, n = 10; LN, n = 10) based on Stereo-seq data. Student’s t-test was used to assess the significance of differences in panel b. *P < 0.05; ***P < 0.001. M-T, tumor side of the margin; M-P, paratumor side of the margin.
Fig. 3
Fig. 3. Characteristics along the tangential and normal directions of the tumor border.
a Schematic diagram of the construction of the tumor border SDM in margin areas using Stereo-seq data. b Line graphs showing the average fraction of immune cells and the different subsets (B cells, macrophages, T/NK cells, DC, and plasma cells) among all cell components in different layers around the border of human liver tumors as determined using Stereo-seq data. “Distant” was defined as a 250 µm-wide zone in tumor tissues or paratumor tissues at least 2 mm from the border. c Multiplexed IF staining (ARG1, CK19, CD68, and DAPI) of tissue from one representative ICC patient. ARG1, CK19, and CD68 are markers for hepatocytes, malignant cells, and macrophages, respectively. d Box plots analyzing the average number of macrophages (CD68+ cells) in different layers (1000 µm in axial length) from the paratumor and tumor sides of the border in tissues from 105 liver cancer patients (HCC, n = 53; ICC, n = 52) from validation cohort 1. e Line graphs showing the expression levels of immune checkpoint genes (CD96, IDO1, TIGIT, BTLA, and CTLA4) in different layers from the border of slides made using tissue specimens from 16 patients with liver cancer based on Stereo-seq data. f, g Line graphs showing the GSVA scores for different hallmarks of cancer, including angiogenesis, apoptosis, immune escape, EMT, G2M, and hypoxia (f) and metabolic pathways, including glycolysis, glutamine metabolism, the tricarboxylic acid (TCA) cycle, fatty acyl CoA synthesis, and fatty acid β-oxidation (g) in different layers from the borders of the 16 liver cancer specimens based on Stereo-seq data. h Hierarchical clustering showing the transcriptional heterogeneity along the border and illustrating features of cell composition patterns acquired from a total of 2912 equally-divided subregions from the invasive zone in tissues from 16 patients with liver cancer. The features of subregions were grouped into 5 patterns. i Heatmap showing the cell type compositions and fractions of the 5 grouped patterns corresponding to panel h. j Bar charts for the recurrence enrichment score show the prognostic association for each pattern. Student’s t-test was used to assess the statistical significance of the differences in panels b, dg while the Chi-squared test was used in panel j. *P < 0.05; **P < 0.01; ***P < 0.001.
Fig. 4
Fig. 4. Zone-specific damage of hepatocytes with high expression of SAAs is mediated by JAK-STAT3 activation in the invasive zone.
a Dot diagram showing the spatial distribution of Hep1 and Hep2 subtypes in the margin areas based on Stereo-seq data (LC5-M) and Hep1 (SAAs+ hepatocytes) based on IF staining (HNF4α, SAAs, and 4’-6’-diamidino-2-phenylindole, DAPI) of adjacent frozen slide. HNF4α is a marker to identify hepatocytes. b Volcano plot showing differentially expressed genes (DEGs) between two hepatocyte clusters (Hep1 and Hep2) based on Stereo-seq data (LC5-M). The red dots represent genes upregulated in Hep1 and the blue dots represent genes upregulated in Hep2. c The expression levels of SAA1 and SAA2 in tumors, margin areas (1 cm-wide zone centered on the border) and paratumor tissues from 10 ICC patients from validation cohort 2 determined using bulk-RNA sequencing. d The overlap of upregulated genes in Hep1 between the Stereo-seq data (LC2-M) and scRNA-seq data. e Bubble diagram showing enriched pathways for commonly upregulated genes in the Hep1 subtype compared with the Hep2 subtype based on the scRNA-seq and Stereo-seq data (LC2-M). k is the number of genes in the intersection of the query set with a set from the database and K is the number of genes in the set from the database. f Heatmap of differentially expressed TFs between the Hep1 and Hep2 subtypes based on a SCENIC analysis using scRNA-seq data. g Scatter plots showing the interplay between the transcriptional levels of STAT3 and SAA1 (left panel) or SAA2 (right panel) in Hep1 hepatocytes based on scRNA-seq data. h Multiplexed IF staining (ARG1, STAT3, SAAs, and DAPI) showing high expression of STAT3 specifically in SAAs+ hepatocytes in the invasive zone (in a representative ICC patient from validation cohort 4). i Scatter plots showing the correlation between the GSVA score of the JAK-STAT3 pathway and SAA1 (left panel) or SAA2 (right panel) in Hep1 hepatocytes based on the scRNA-seq data. j The overlap of upregulated genes in cluster 3 (C3) of malignant cells based on the scRNA-seq data and tumor cells in the Hep1-enriched area indicated by the Stereo-seq data (LC2-M). k Violin plot representing the GSVA score of the EMT in C3 and other clusters of malignant cells based on the scRNA-seq data. l Multiplexed IF staining (CXCL6, SAAs, CK19, and DAPI) showing high expression of CXCL6 in tumor cells close to SAAs+ hepatocytes around the border (ICC patient from validation cohort 4). Student’s t-test was used for the analysis in panel c, a hypergeometric test was used in panels d, j and the Wilcoxon test was used in panel k. *P < 0.05; **P < 0.01; ***P < 0.001.
Fig. 5
Fig. 5. High expression of SAAs was induced in damaged hepatocytes through interactions between CXCR2 and the CXCL6+ tumor cells in the invasive zone.
a The cell–cell interactions between hepatocytes and other cell types indicated by the scRNA-seq data. The line thickness represents the number of significant ligand–receptor pairs, and the arrow points to the cell type that provides the receptor. b Bubble plot showing the significant ligand–receptor pairs between hepatocytes and other cell types calculated by CellPhone using scRNA-seq data. c Bubble chart showing the gene expression levels of SAAs receptors, including CD36, FPR1/2, SCARB1, TLR2, and TLR4, in the main cell types based on the scRNA-seq data and Stereo-seq spots (LC2-M). d Bubble chart showing the expression levels of SAAs receptor genes in macrophages from the scRNA-seq data of margin areas and tumor tissues from 5 patients. e Scatter diagram of the distribution of Hep1 hepatocytes (green dots) and macrophages (red dots) on the LC5-M slide (left panel). Scatter diagram showing the expression of SAAs in Hep1 (middle panel), and the expression of SAAs receptors in macrophages (right panel) on the LC5-M slide. The dash lines represent the border. f Box plots analyzing the average number of SAAs receptor (CD36, FPR1/2, SCARB1, TLR2, and/or TLR4)-positive macrophages in different layers on the tumor side of the border in specimens from 16 liver cancer patients. g, h Multiplexed IF staining (ARG1, CK19, FPR1, CD68, SAAs, and DAPI) showing co-aggregation of FPR1+ macrophages (FPR1+CD68+ cells) and SAAs+ hepatocytes (SAAs+ARG1+ cells) in the invasive zone of HCC and ICC samples from validation cohort 4. i Quantitative analysis of the numbers of FPR1+ macrophages (FPR1+ CD68+ cells) and SAAs+ hepatocytes (SAAs+ARG1+ cells) in different layers (1000 µm in axial length) in the margin areas of 56 liver cancer patients including 27 cases of primary liver cancer and 29 cases of secondary liver cancers (validation cohort 4). “Distant” was defined as a 250 µm-wide zone in tumor tissues or paratumor tissues at least 2 mm from the border. j Scatter plot illustrating the correlations between the number of macrophages and the number of SAAs+ hepatocytes in the invasive zone (1000 µm in axial length) of samples from 27 primary liver cancer patients from validation cohort 4. The paired Student’s t-test was used in panels f, i. *P < 0.05; **P < 0.01; ***P < 0.001.
Fig. 6
Fig. 6. High expression of SAAs by damaged hepatocytes in the invasive zone promoted liver tumor progression.
a Bubble plot revealing enriched ligand–receptor pairs between macrophages and tumor cells in margin areas identified using scRNA-seq data. b Volcano plot showing the genes that were differentially expressed in macrophages based on the scRNA-seq data from 5 patients. The red dots represent genes upregulated in macrophages from tumor sites and the blue dots represent genes upregulated in macrophages from margin areas. c OS curves of 93 patients with ICC from validation cohort 3 grouped by SAAs expression in the invasive zone determined using IHC staining. d Representative images of the low and high SAAs/ARG1 ratio patients, and OS curves of 27 patients with primary liver cancer from validation cohort 4 grouped by the SAAs/ARG1 ratio determined using multiplexed IF staining (ARG1, CK19, SAAs, and DAPI). e Schematic diagram of the construction of the mouse models by implanting tumor tissue sections acquired from subcutaneous tumors (generated using Hep1-6 and MC-38 cell lines) after AAV tail vein injection of pAAV9-Con group (control group) and pAAV9-Saas-Sh group (experiment group). f Images of the livers with implanted tumors and qualification of the tumor volume in the AAV-Con and AAV-Saas-Sh groups generated using the Hep1-6 and MC-38 cell lines. gi Representative H&E staining, multiplexed IF staining (ARG1, SAAs, F4/80, CD206, and DAPI) images (g) and quantitative cell number of mouse HCC model (h) and mouse CRLM (colorectal liver metastases) model (i) showing the accumulation of M2 macrophages (F4/80+CD206+ cells) and SAAs+ hepatocytes (SAAs+ARG1+ cells) in the invasive zone (1000 µm in axial length) in mice from the pAAV9-Con group or pAAV9-Saas-Sh group. F4/80 and CD206 are markers of macrophage and M2-type in mice. The Log-rank test was used to assess the data in panels c and d. Student’s t-test was used in panel f. The paired Student’s t-test was used in panels h, i. *P < 0.05; **P < 0.01; ***P < 0.001.
Fig. 7
Fig. 7. Schematic diagram of the invasion zone.
Schematic diagram showing the local ecosystem where tumor cells with high invasiveness (CXCL6+ tumor cells), damaged hepatocytes (SAAs+ hepatocytes) and recruited FPR1+ macrophages polarizing into the M2 phenotype interacted in the 500 µm-wide invasive zone, contributing to tumor progression.

Comment in

References

    1. Ji AL, et al. Multimodal analysis of composition and spatial architecture in human squamous cell carcinoma. Cell. 2020;182:497–514.e22. - PMC - PubMed
    1. Lewis SM, et al. Spatial omics and multiplexed imaging to explore cancer biology. Nat. Methods. 2021;18:997–1012. - PubMed
    1. Wu Y, et al. Spatiotemporal immune landscape of colorectal cancer liver metastasis at single-cell level. Cancer Discov. 2022;12:134–153. - PubMed
    1. Schurch CM, et al. Coordinated cellular neighborhoods orchestrate antitumoral immunity at the colorectal cancer invasive front. Cell. 2020;182:1341–1359.e19. - PMC - PubMed
    1. Grunwald BT, et al. Spatially confined sub-tumor microenvironments in pancreatic cancer. Cell. 2021;184:5577–5592.e18. - PubMed

Publication types

LinkOut - more resources