. 2023 Aug;620(7975):746-749.
doi: 10.1038/s41586-023-06232-z. Epub 2023 Jun 19.

No thick carbon dioxide atmosphere on the rocky exoplanet TRAPPIST-1 c

Affiliations

No thick carbon dioxide atmosphere on the rocky exoplanet TRAPPIST-1 c

Sebastian Zieba et al. Nature. 2023 Aug.

Abstract

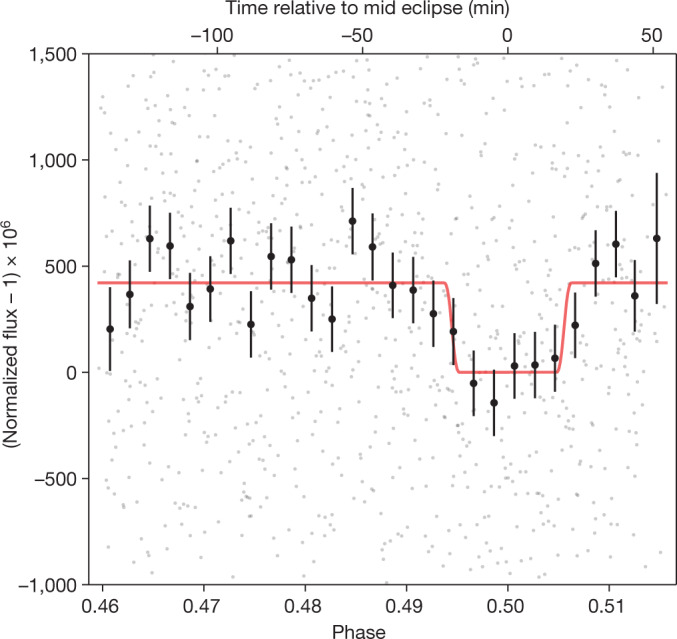
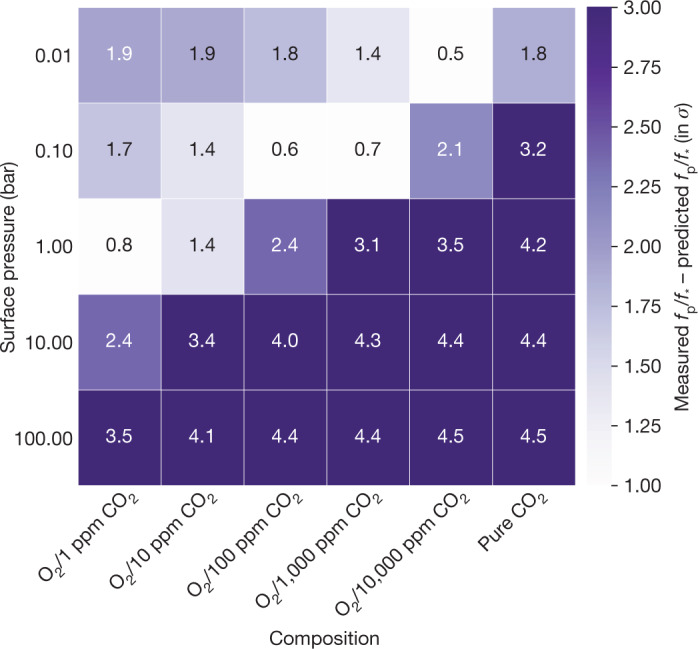
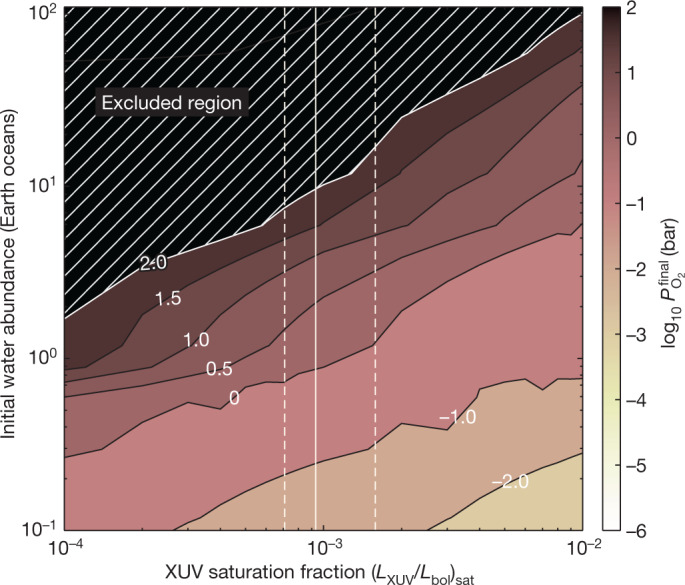
Seven rocky planets orbit the nearby dwarf star TRAPPIST-1, providing a unique opportunity to search for atmospheres on small planets outside the Solar System1. Thanks to the recent launch of the James Webb Space Telescope (JWST), possible atmospheric constituents such as carbon dioxide (CO2) are now detectable2,3. Recent JWST observations of the innermost planet TRAPPIST-1 b showed that it is most probably a bare rock without any CO2 in its atmosphere4. Here we report the detection of thermal emission from the dayside of TRAPPIST-1 c with the Mid-Infrared Instrument (MIRI) on JWST at 15 µm. We measure a planet-to-star flux ratio of fp/f = 421 ± 94 parts per million (ppm), which corresponds to an inferred dayside brightness temperature of 380 ± 31 K. This high dayside temperature disfavours a thick, CO2-rich atmosphere on the planet. The data rule out cloud-free O2/CO2 mixtures with surface pressures ranging from 10 bar (with 10 ppm CO2) to 0.1 bar (pure CO2). A Venus-analogue atmosphere with sulfuric acid clouds is also disfavoured at 2.6σ confidence. Thinner atmospheres or bare-rock surfaces are consistent with our measured planet-to-star flux ratio. The absence of a thick, CO2-rich atmosphere on TRAPPIST-1 c suggests a relatively volatile-poor formation history, with less than [Formula: see text] Earth oceans of water. If all planets in the system formed in the same way, this would indicate a limited reservoir of volatiles for the potentially habitable planets in the system.


Conflict of interest statement

The authors declare no competing interests.

Figures

Fig. 1
Fig. 1. Eclipse light curve of TRAPPIST-1 c taken with MIRI F1500W.
The phase-folded secondary eclipse light curve of TRAPPIST-1 c, measured with the MIRI imager at 15 µm. The eclipse is centred at orbital phase 0.5 and has a measured depth of fp/f = 421 ± 94 ppm. The light curve includes four visits (that is, four eclipses), each spanning approximately 3.2 h. To make the eclipse more easily visible, we binned the individual integrations (grey points) into 28 orbital phase bins (black points with 1σ error bars). The light curve was normalized and divided by the best-fit instrument systematic model. The best-fit eclipse model is shown with the solid red line. The data and fit presented in this figure are based on the SZ reduction, one of the four independent reductions we performed in this work.
Fig. 2
Fig. 2. Grid plot comparing a suite of atmospheric models to the measured eclipse depth.
Comparison between the measured eclipse depth and a suite of different O2/CO2, cloud-free atmospheres for TRAPPIST-1 c with varying surface pressures and compositions. Darker grid cells indicate that we more strongly rule out this specific atmospheric scenario. The number in each cell is the difference between each model and the observations in units of σ. The lower the modelled atmosphere is in the grid, the higher its surface pressure. The rightmost column shows pure CO2 atmospheres. The other columns are O2-dominated atmospheres with different amounts of CO2, ranging from 1 ppm (=0.0001%) to 10,000 ppm (=1%).
Fig. 3
Fig. 3. Observed flux of TRAPPIST-1 c and various emission models.
Simulated emission spectra compared with the measured eclipse depth of TRAPPIST-1 c (red diamond, with the vertical error bar representing the 1σ uncertainty on the measured eclipse depth). The CO2 feature overlaps directly with the MIRI F1500W filter used for these observations. The two limiting cases for the atmospheric circulation for a zero-albedo planet (zero heat redistribution, that is, instant reradiation of incoming flux and global heat redistribution) are marked with dashed lines. Two cloud-free, O2/CO2 mixture atmospheres are shown with purple and red solid lines. They show decreased emission at 15 µm owing to CO2 absorption. A bare-rock model assuming an unweathered ultramafic surface of the planet with a Bond albedo of 0.5 is shown by the solid black line (see text for more information on weathering, including a full comparison of our measurement to a suite of surfaces in Extended Data Fig. 5). The cloudy Venus forward model with a surface pressure of 10 bar is shown with a solid yellow line.
Fig. 4
Fig. 4. Final oxygen atmospheric pressure for TRAPPIST-1 c after 7.5 Gyr of energy-limited escape.
We explore different initial planetary water abundances and the amount of XUV the planet receives during the star’s saturated activity period, described as a fraction of its total bolometric luminosity. The vertical lines represent the nominal XUV saturation fraction of log10LXUV/Lbol=3.030.12+0.23 as estimated in ref. . We assume an escape efficiency of 0.1. The white numbers are the contour values for the logarithm of the atmospheric pressure in bar. Our upper limit on surface pressure of 10–100 bar implies an initial water abundance of approximately 4–10 Earth oceans.
Extended Data Fig. 1
Extended Data Fig. 1. Comparison of small exoplanets with measured infrared emission.
Following ref. , we show the normalized dayside brightness temperature for super-Earths (Rp<2R) with measured thermal emission, as a function of planet size (a) and maximum equilibrium temperature (b). The brightness temperatures are normalized relative to predictions for a bare rock with zero albedo and zero heat redistribution, Teq,max. The thermal emission of TRAPPIST-1 c has been detected in this work at 15 µm. The other planets are TRAPPIST-1 b (T1b in the plot; also at 15 µm) and planets that have been observed with Spitzer’s IRAC channel 2 at 4.5 µm. The uncertainties on the radius for the planets in the TRAPPIST-1 system are smaller than the marker symbol. Error bars show 1σ uncertainties.
Extended Data Fig. 2
Extended Data Fig. 2. Example of a MIRI integration using the FULL array.
An integration taken during our observations showing the MIRI imager focal plane. Most of the FULL array is taken up by the imager field of view on the right side. TRAPPIST-1 is centred on the imager highlighted by the red arrow. The left side of the imager was not used in our analysis and consists of the Lyot coronagraph (top left) and the three four-quadrant phase masks coronagraphs (lower left).
Extended Data Fig. 3
Extended Data Fig. 3. Diagnostic plot of all four visits taken during JWST General Observer programme 2304 based on the SZ reduction.
Every column corresponds to a visit. a,b, The top and second rows show the raw and background flux in units of electrons per integration per pixel, respectively. The raw flux is referring to the flux level within the target aperture before the subtraction of the background flux. cf, The following rows are depicting the properties of the centroid over time. We fitted a 2D Gaussian distribution to the target at every integration to determine its x and y positions on the detector. Δσx and Δσy describe change in the width of the 2D Gaussian with time. The integrations were taken approximately every 40 s. The lower four rows were also binned to 5 min (=8 integrations) shown with the solid black lines. Owing to stronger systematics, we excluded the first ten integrations in the SZ reduction shown by the grey region at the beginning of each visit.
Extended Data Fig. 4
Extended Data Fig. 4. Allan deviation plots.
ad, Allan deviation plots of the individual visits: rms of the best-fit residuals from data reduction SZ as a function of the number of data points per bin shown in black. e, The same but for the combined dataset. A bin size value of one corresponds to no binning. The red line shows the expected behaviour if the residuals are dominated by Gaussian noise. The absolute slope of this line is 1/bin size, following the inverse square root. The rms of our residuals closely follow this line, showing that our residuals are consistent with uncorrelated photon shot noise.
Extended Data Fig. 5
Extended Data Fig. 5. Measured eclipse depth compared with a suite of simulated bare-rock emission spectra.
a, Secondary eclipse spectra for various fresh surface compositions, assuming that TRAPPIST-1 c is a bare rock. High-albedo feldspathic and granitoid surfaces are cool and fit the data moderately poorly (2σ), as does a low-albedo and hot blackbody surface (1.7σ). b, Space weathering by means of formation of iron nanoparticles (npFe) lowers the albedo at short wavelengths, thereby increasing the surface’s temperature and its secondary eclipse depth. An intermediate-albedo fresh ultramafic surface would fit the data well but the fit becomes marginal after taking into account the influence of strong space weathering (1.6σ, or about 90% confidence). The vertical error bar on our 15-µm measurement represents the 1σ uncertainty on the observed eclipse depth.
Extended Data Fig. 6
Extended Data Fig. 6. Measured eclipse times compared with the predicted eclipse times.
The points show the measured eclipse-timing offsets (defined as the time of eclipse minus the mean of the two adjacent transit times of planet c) from four different analyses. The error bars correspond to the 16th and 84th percentiles of the eclipse time posterior. The dark (light) green shaded region shows the 1σ (2σ) confidence intervals forecast from the transit-timing analysis from ref. .

References

    1. Gillon M, et al. Seven temperate terrestrial planets around the nearby ultracool dwarf star TRAPPIST-1. Nature. 2017;542:456–460. doi: 10.1038/nature21360. - DOI - PMC - PubMed
    1. Morley CV, Kreidberg L, Rustamkulov Z, Robinson T, Fortney JJ. Observing the atmospheres of known temperate Earth-sized planets with JWST. Astrophys. J. 2017;850:121. doi: 10.3847/1538-4357/aa927b. - DOI
    1. Lincowski AP, et al. Evolved climates and observational discriminants for the TRAPPIST-1 planetary system. Astrophys. J. 2018;867:76. doi: 10.3847/1538-4357/aae36a. - DOI
    1. Greene TP, et al. Thermal emission from the Earth-sized exoplanet TRAPPIST-1 b using JWST. Nature. 2023;618:39–42. doi: 10.1038/s41586-023-05951-7. - DOI - PubMed
    1. Wordsworth R, Kreidberg L. Atmospheres of rocky exoplanets. Annu. Rev. Astron. Astrophys. 2022;60:159–201. doi: 10.1146/annurev-astro-052920-125632. - DOI