. 2023 Jul;55(7):1091-1105.
doi: 10.1038/s41588-023-01422-x. Epub 2023 Jun 19.

Genome-wide association analyses define pathogenic signaling pathways and prioritize drug targets for IgA nephropathy

Krzysztof Kiryluk  1   2 Elena Sanchez-Rodriguez #  3 Xu-Jie Zhou #  4 Francesca Zanoni  3 Lili Liu  3 Nikol Mladkova  3 Atlas Khan  3 Maddalena Marasa  3 Jun Y Zhang  3 Olivia Balderes  3 Simone Sanna-Cherchi  3   5 Andrew S Bomback  3 Pietro A Canetta  3 Gerald B Appel  3 Jai Radhakrishnan  3 Hernan Trimarchi  6 Ben Sprangers  7   8 Daniel C Cattran  9 Heather Reich  9 York Pei  9 Pietro Ravani  10 Kresimir Galesic  11 Dita Maixnerova  12 Vladimir Tesar  12 Benedicte Stengel  13 Marie Metzger  13 Guillaume Canaud  14 Nicolas Maillard  15 Francois Berthoux  15 Laureline Berthelot  16 Evangeline Pillebout  17 Renato Monteiro  17 Raoul Nelson  18 Robert J Wyatt  19   20 William Smoyer  21 John Mahan  21 Al-Akash Samhar  22 Guillermo Hidalgo  23 Alejandro Quiroga  24 Patricia Weng  25 Raji Sreedharan  26 David Selewski  27 Keefe Davis  28 Mahmoud Kallash  29 Tetyana L Vasylyeva  30 Michelle Rheault  31 Aftab Chishti  32 Daniel Ranch  33 Scott E Wenderfer  34 Dmitry Samsonov  35 Donna J Claes  36 Oleh Akchurin  37 Dimitrios Goumenos  38 Maria Stangou  38 Judit Nagy  39 Tibor Kovacs  39 Enrico Fiaccadori  40 Antonio Amoroso  41 Cristina Barlassina  42 Daniele Cusi  42 Lucia Del Vecchio  43 Giovanni Giorgio Battaglia  44 Monica Bodria  45 Emanuela Boer  46 Luisa Bono  47 Giuliano Boscutti  48 Gianluca Caridi  49 Francesca Lugani  49 GianMarco Ghiggeri  49 Rosanna Coppo  50 Licia Peruzzi  50 Vittoria Esposito  51 Ciro Esposito  51 Sandro Feriozzi  52 Rosaria Polci  52 Giovanni Frasca  53 Marco Galliani  54 Maurizio Garozzo  44 Adele Mitrotti  55 Loreto Gesualdo  55 Simona Granata  56 Gianluigi Zaza  56 Francesco Londrino  57 Riccardo Magistroni  58 Isabella Pisani  40 Andrea Magnano  40 Carmelita Marcantoni  59 Piergiorgio Messa  60 Renzo Mignani  61 Antonello Pani  62 Claudio Ponticelli  63 Dario Roccatello  64 Maurizio Salvadori  65 Erica Salvi  66 Domenico Santoro  67 Guido Gembillo  67 Silvana Savoldi  68 Donatella Spotti  69 Pasquale Zamboli  70 Claudia Izzi  71 Federico Alberici  71 Elisa Delbarba  71 Michał Florczak  72 Natalia Krata  72 Krzysztof Mucha  72   73 Leszek Pączek  72   73 Stanisław Niemczyk  74 Barbara Moszczuk  72   75 Malgorzata Pańczyk-Tomaszewska  76 Malgorzata Mizerska-Wasiak  76 Agnieszka Perkowska-Ptasińska  77 Teresa Bączkowska  78 Magdalena Durlik  78 Krzysztof Pawlaczyk  79 Przemyslaw Sikora  80 Marcin Zaniew  81 Dorota Kaminska  82 Magdalena Krajewska  82 Izabella Kuzmiuk-Glembin  83 Zbigniew Heleniak  83 Barbara Bullo-Piontecka  83 Tomasz Liberek  83 Alicja Dębska-Slizien  83 Tomasz Hryszko  84 Anna Materna-Kiryluk  85 Monika Miklaszewska  86 Maria Szczepańska  87 Katarzyna Dyga  87 Edyta Machura  87 Katarzyna Siniewicz-Luzeńczyk  88 Monika Pawlak-Bratkowska  88 Marcin Tkaczyk  88 Dariusz Runowski  89 Norbert Kwella  90 Dorota Drożdż  86 Ireneusz Habura  91 Florian Kronenberg  92 Larisa Prikhodina  93 David van Heel  94 Bertrand Fontaine  95   96 Chris Cotsapas  97 Cisca Wijmenga  98 Andre Franke  99 Vito Annese  100 Peter K Gregersen  101 Sreeja Parameswaran  102 Matthew Weirauch  102   103 Leah Kottyan  102   103 John B Harley  104 Hitoshi Suzuki  105 Ichiei Narita  106 Shin Goto  106 Hajeong Lee  107 Dong Ki Kim  107 Yon Su Kim  108 Jin-Ho Park  109 BeLong Cho  109   110 Murim Choi  108 Ans Van Wijk  111 Ana Huerta  112 Elisabet Ars  113 Jose Ballarin  113 Sigrid Lundberg  114 Bruno Vogt  115 Laila-Yasmin Mani  115 Yasar Caliskan  116 Jonathan Barratt  117 Thilini Abeygunaratne  118 Philip A Kalra  118 Daniel P Gale  119 Ulf Panzer  120 Thomas Rauen  121 Jürgen Floege  121 Pascal Schlosser  122 Arif B Ekici  123 Kai-Uwe Eckardt  124   125 Nan Chen  126 Jingyuan Xie  126 Richard P Lifton  127   128 Ruth J F Loos  129   130 Eimear E Kenny  129   131   132 Iuliana Ionita-Laza  133 Anna Köttgen  122 Bruce A Julian  134 Jan Novak  134 Francesco Scolari  71 Hong Zhang  4 Ali G Gharavi  135   136
Affiliations

Genome-wide association analyses define pathogenic signaling pathways and prioritize drug targets for IgA nephropathy

Krzysztof Kiryluk et al. Nat Genet. 2023 Jul.

Abstract

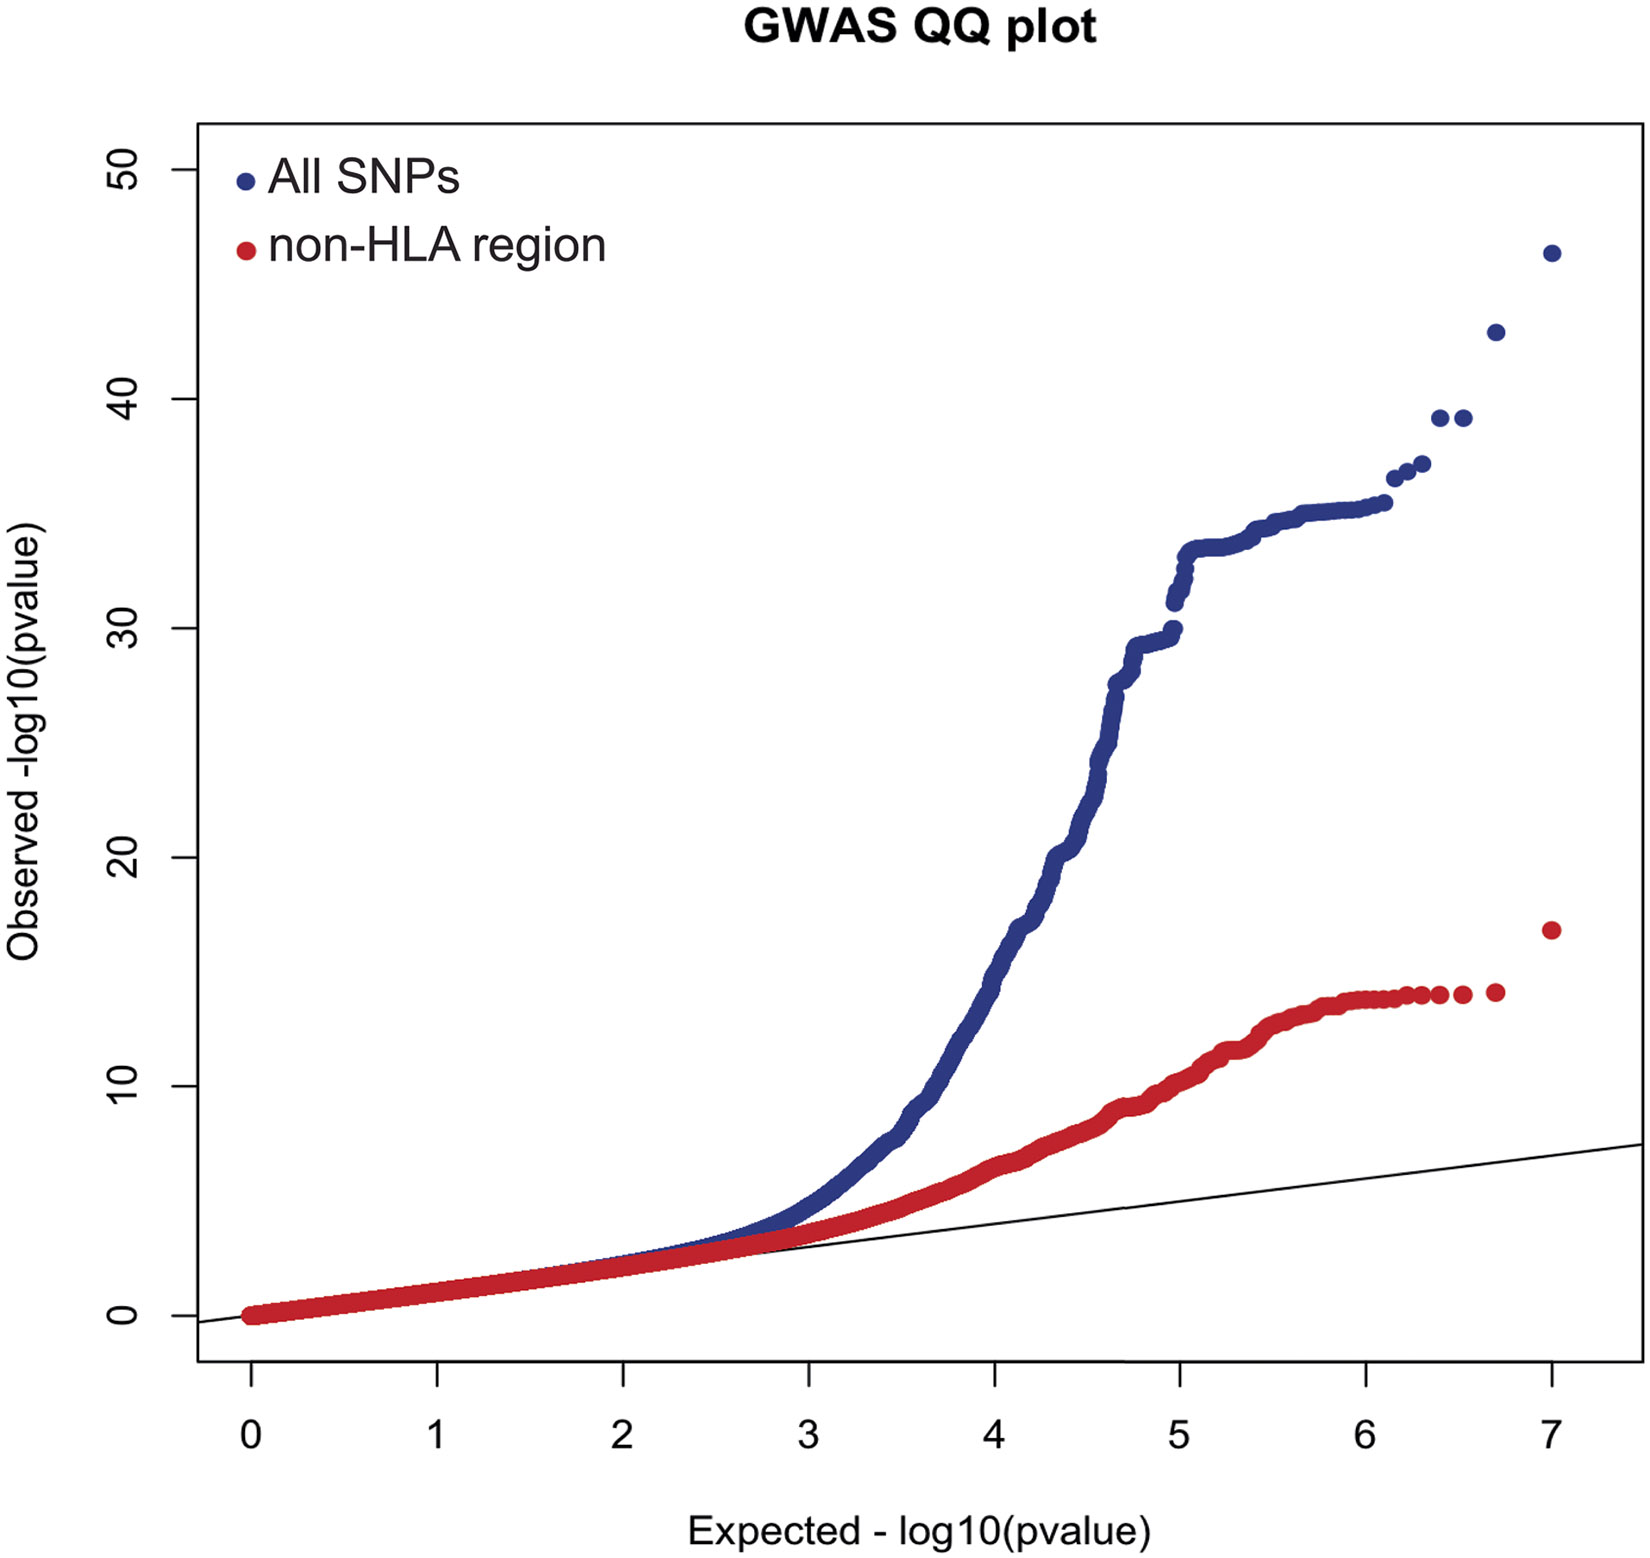
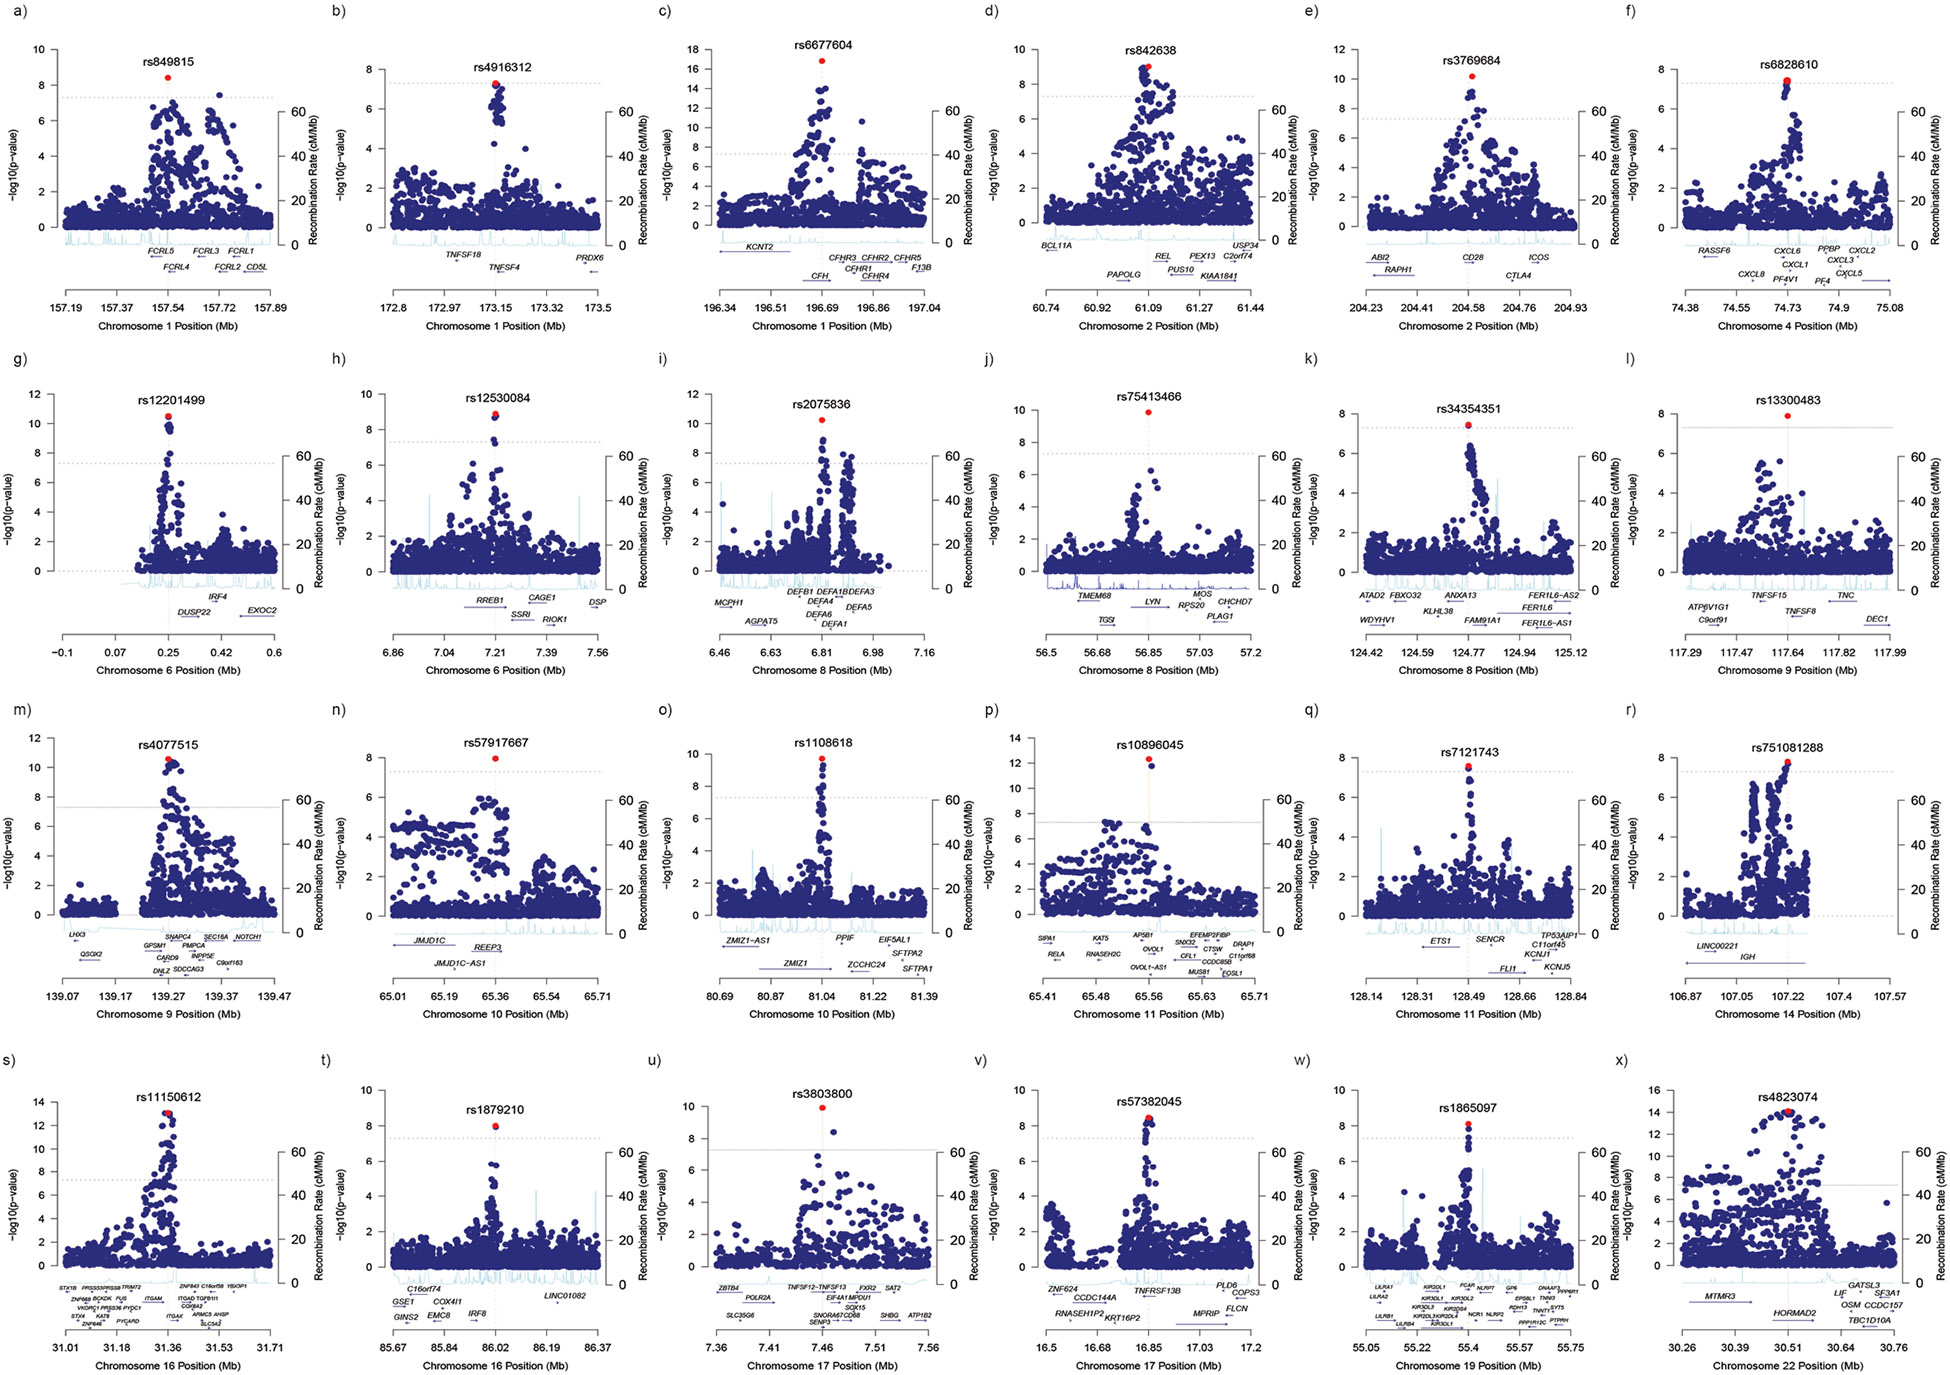
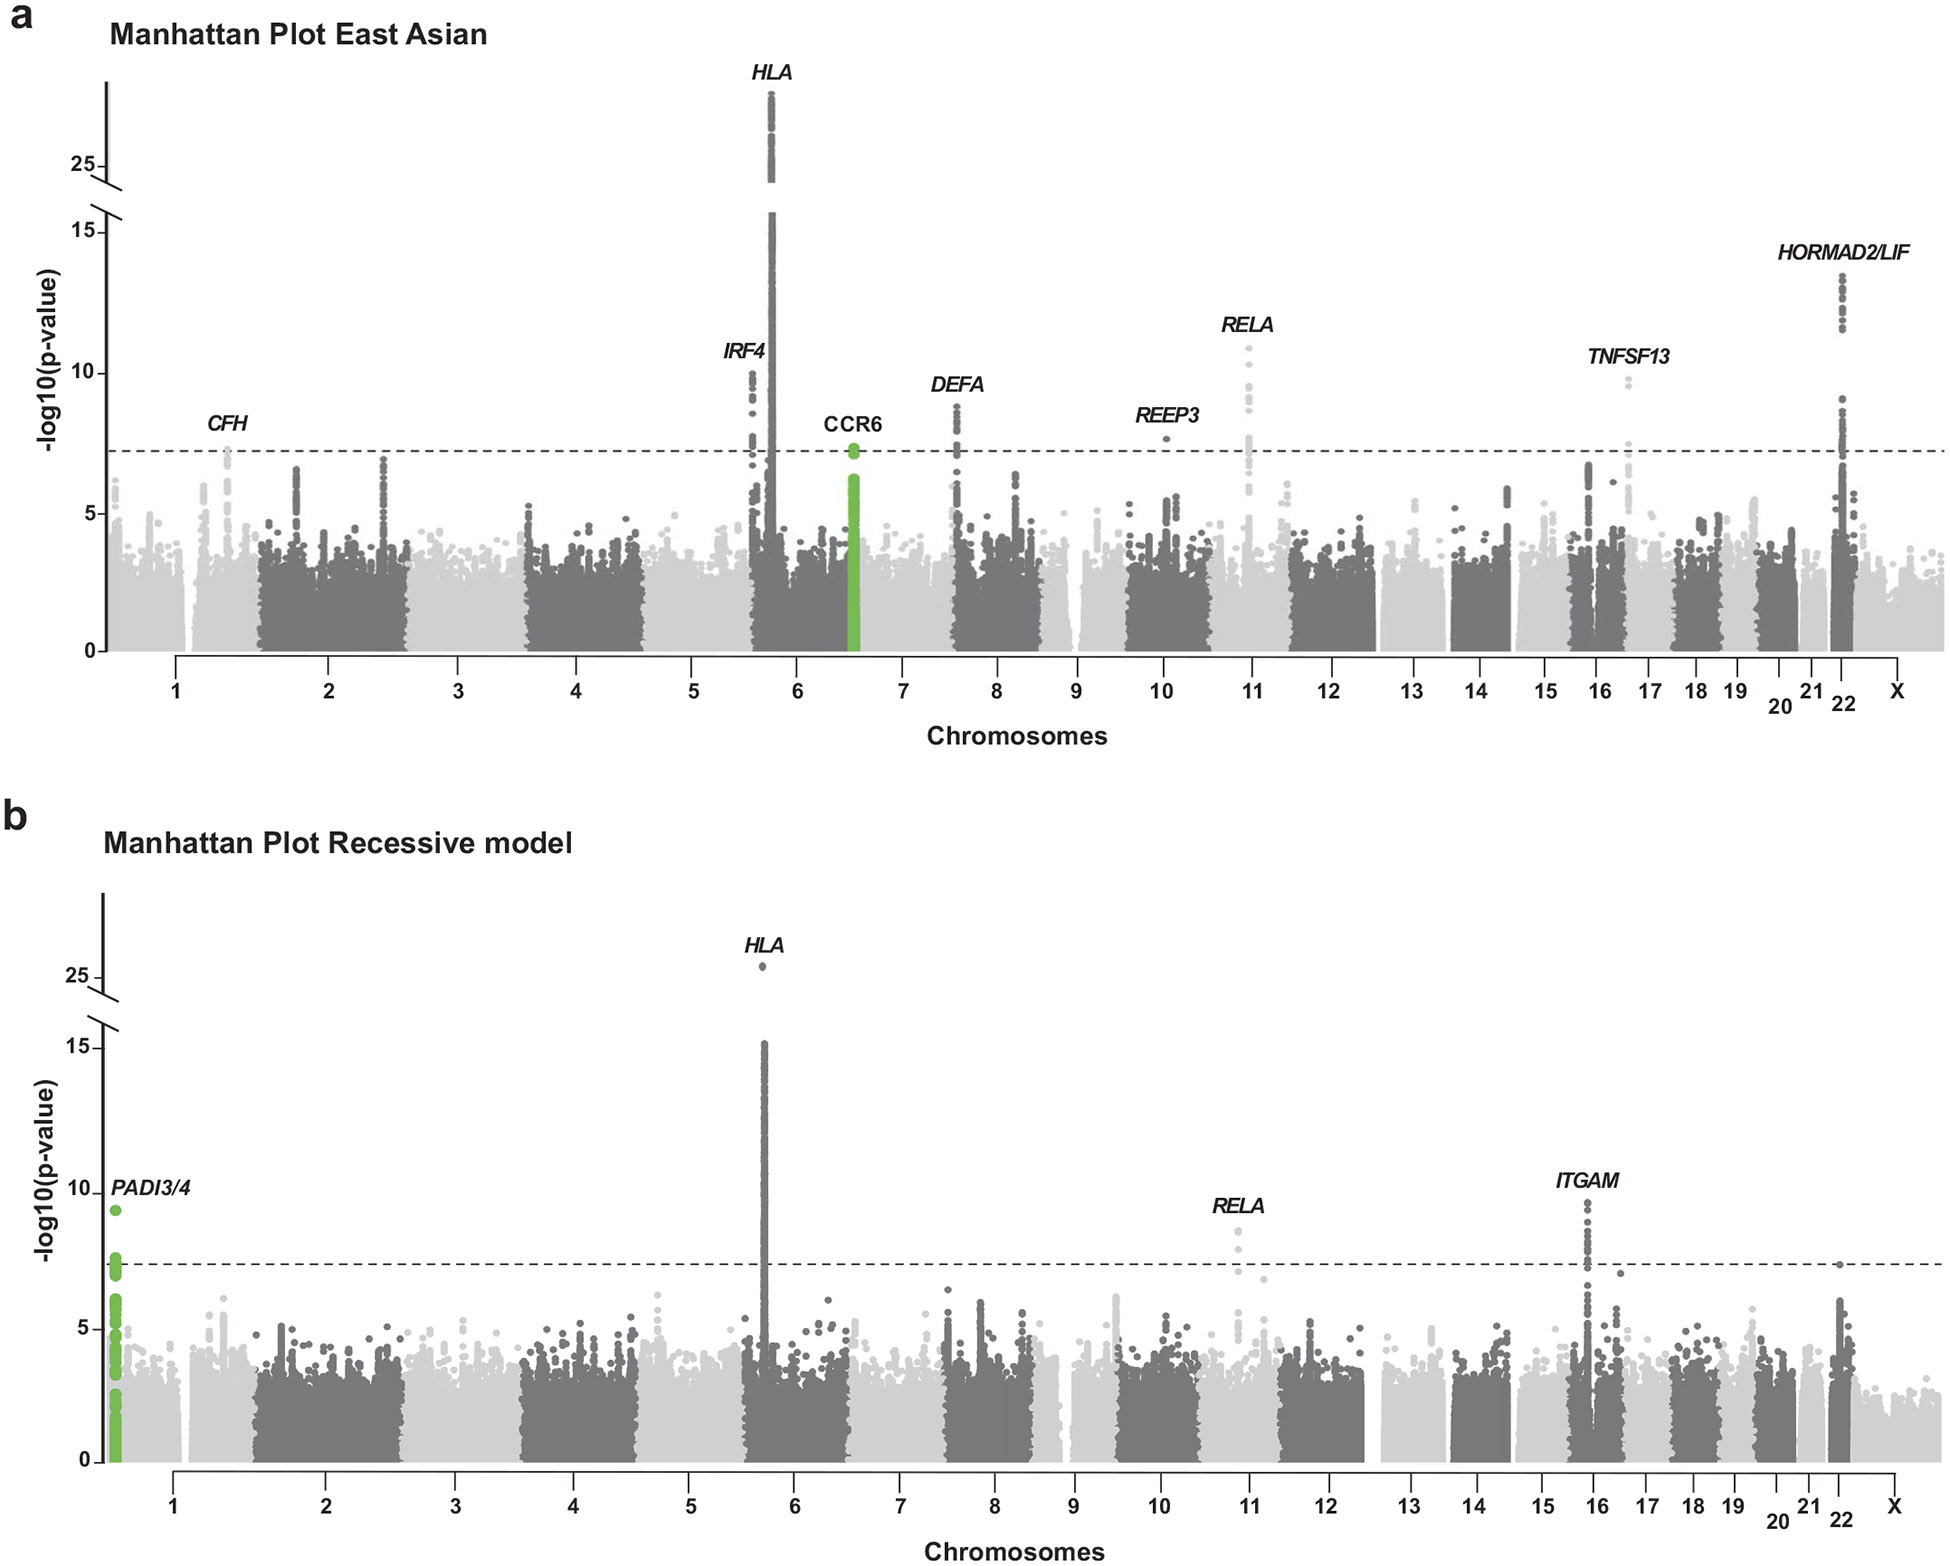
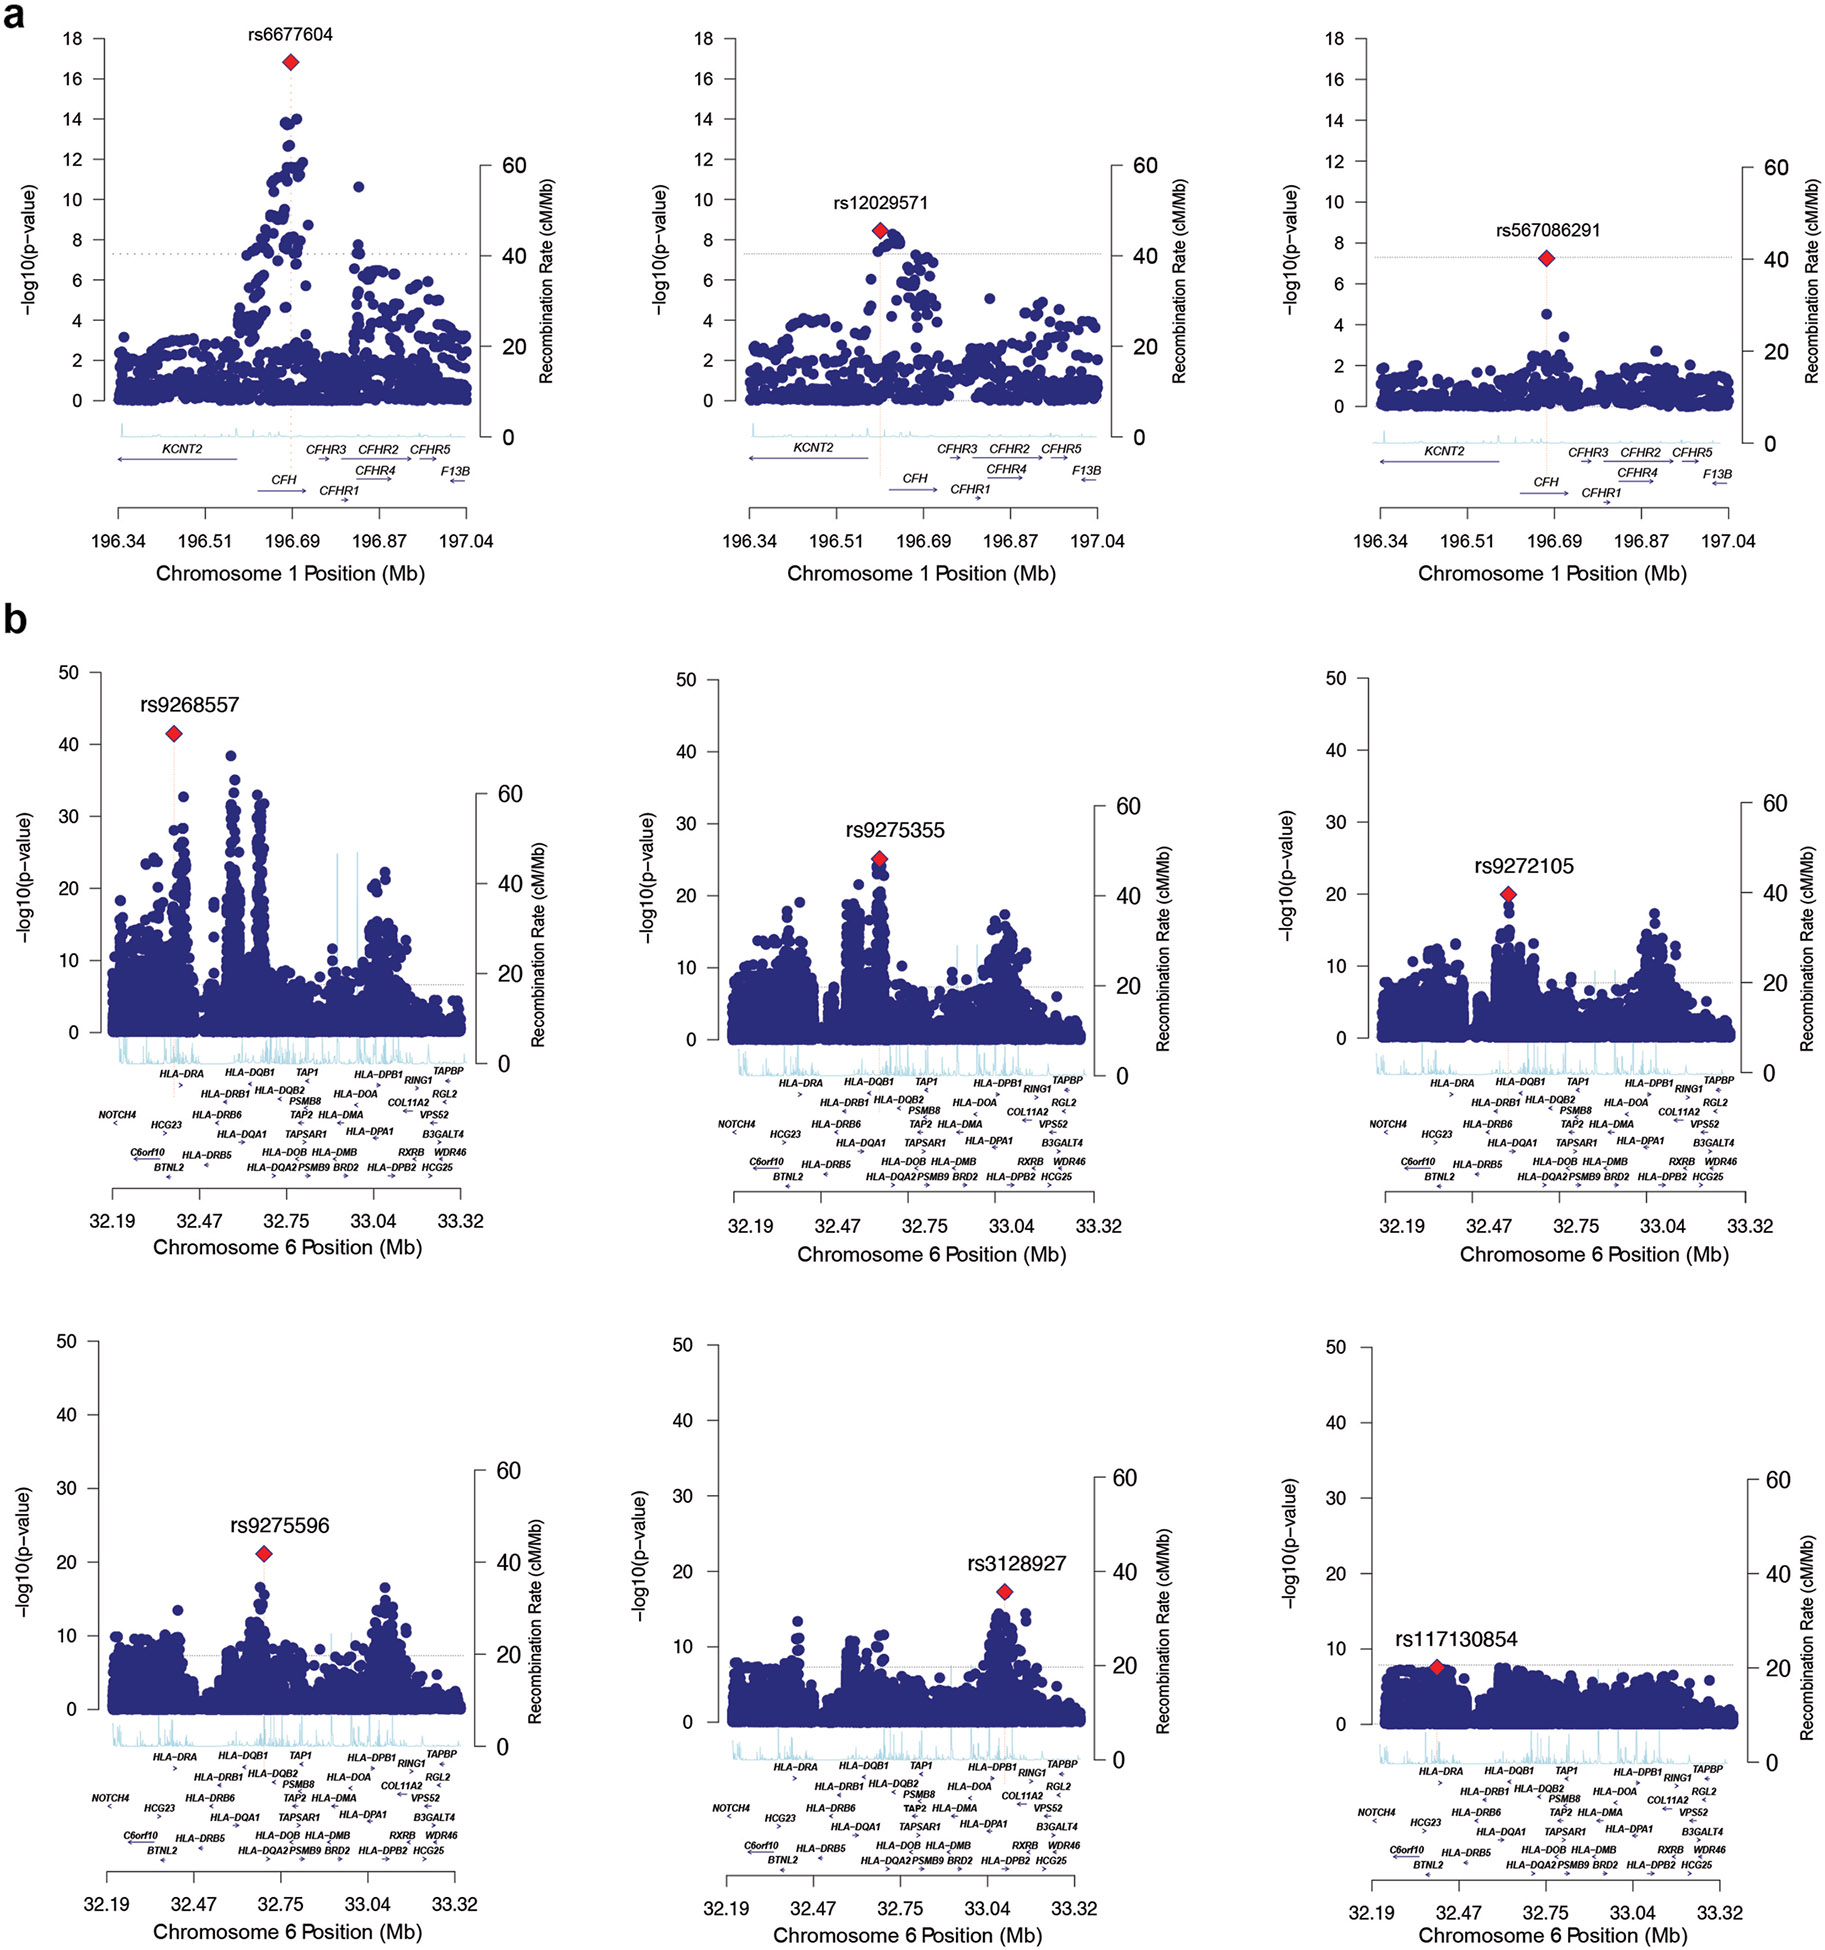
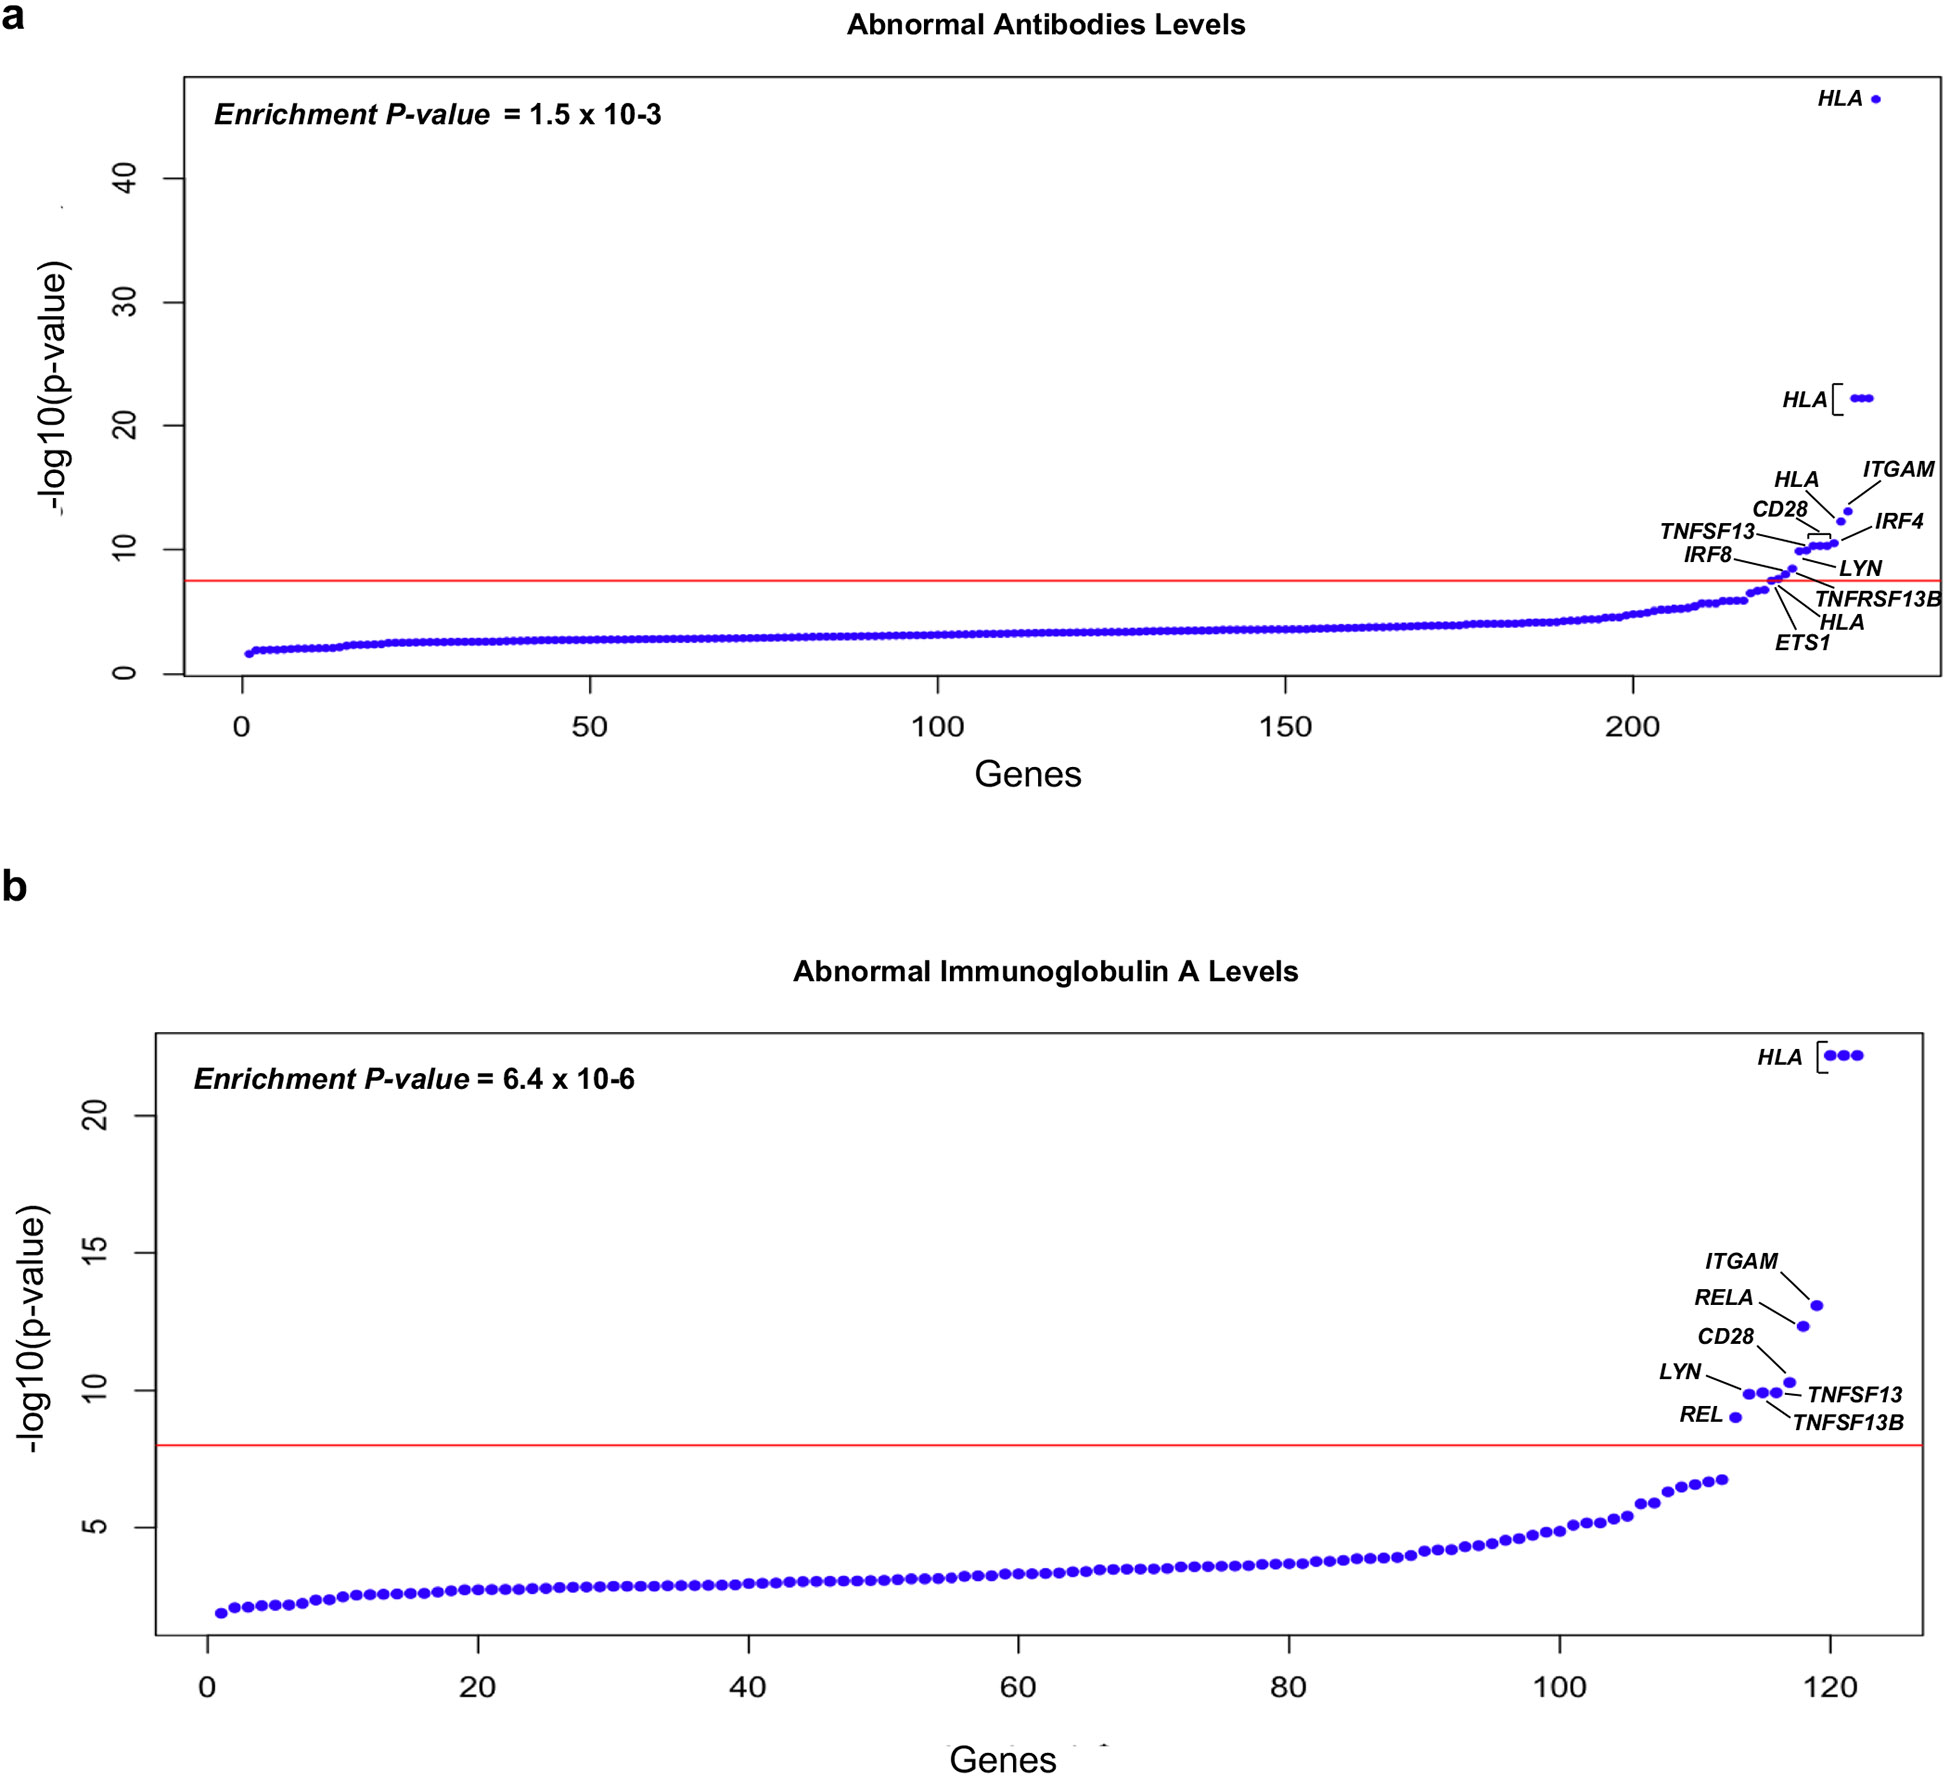
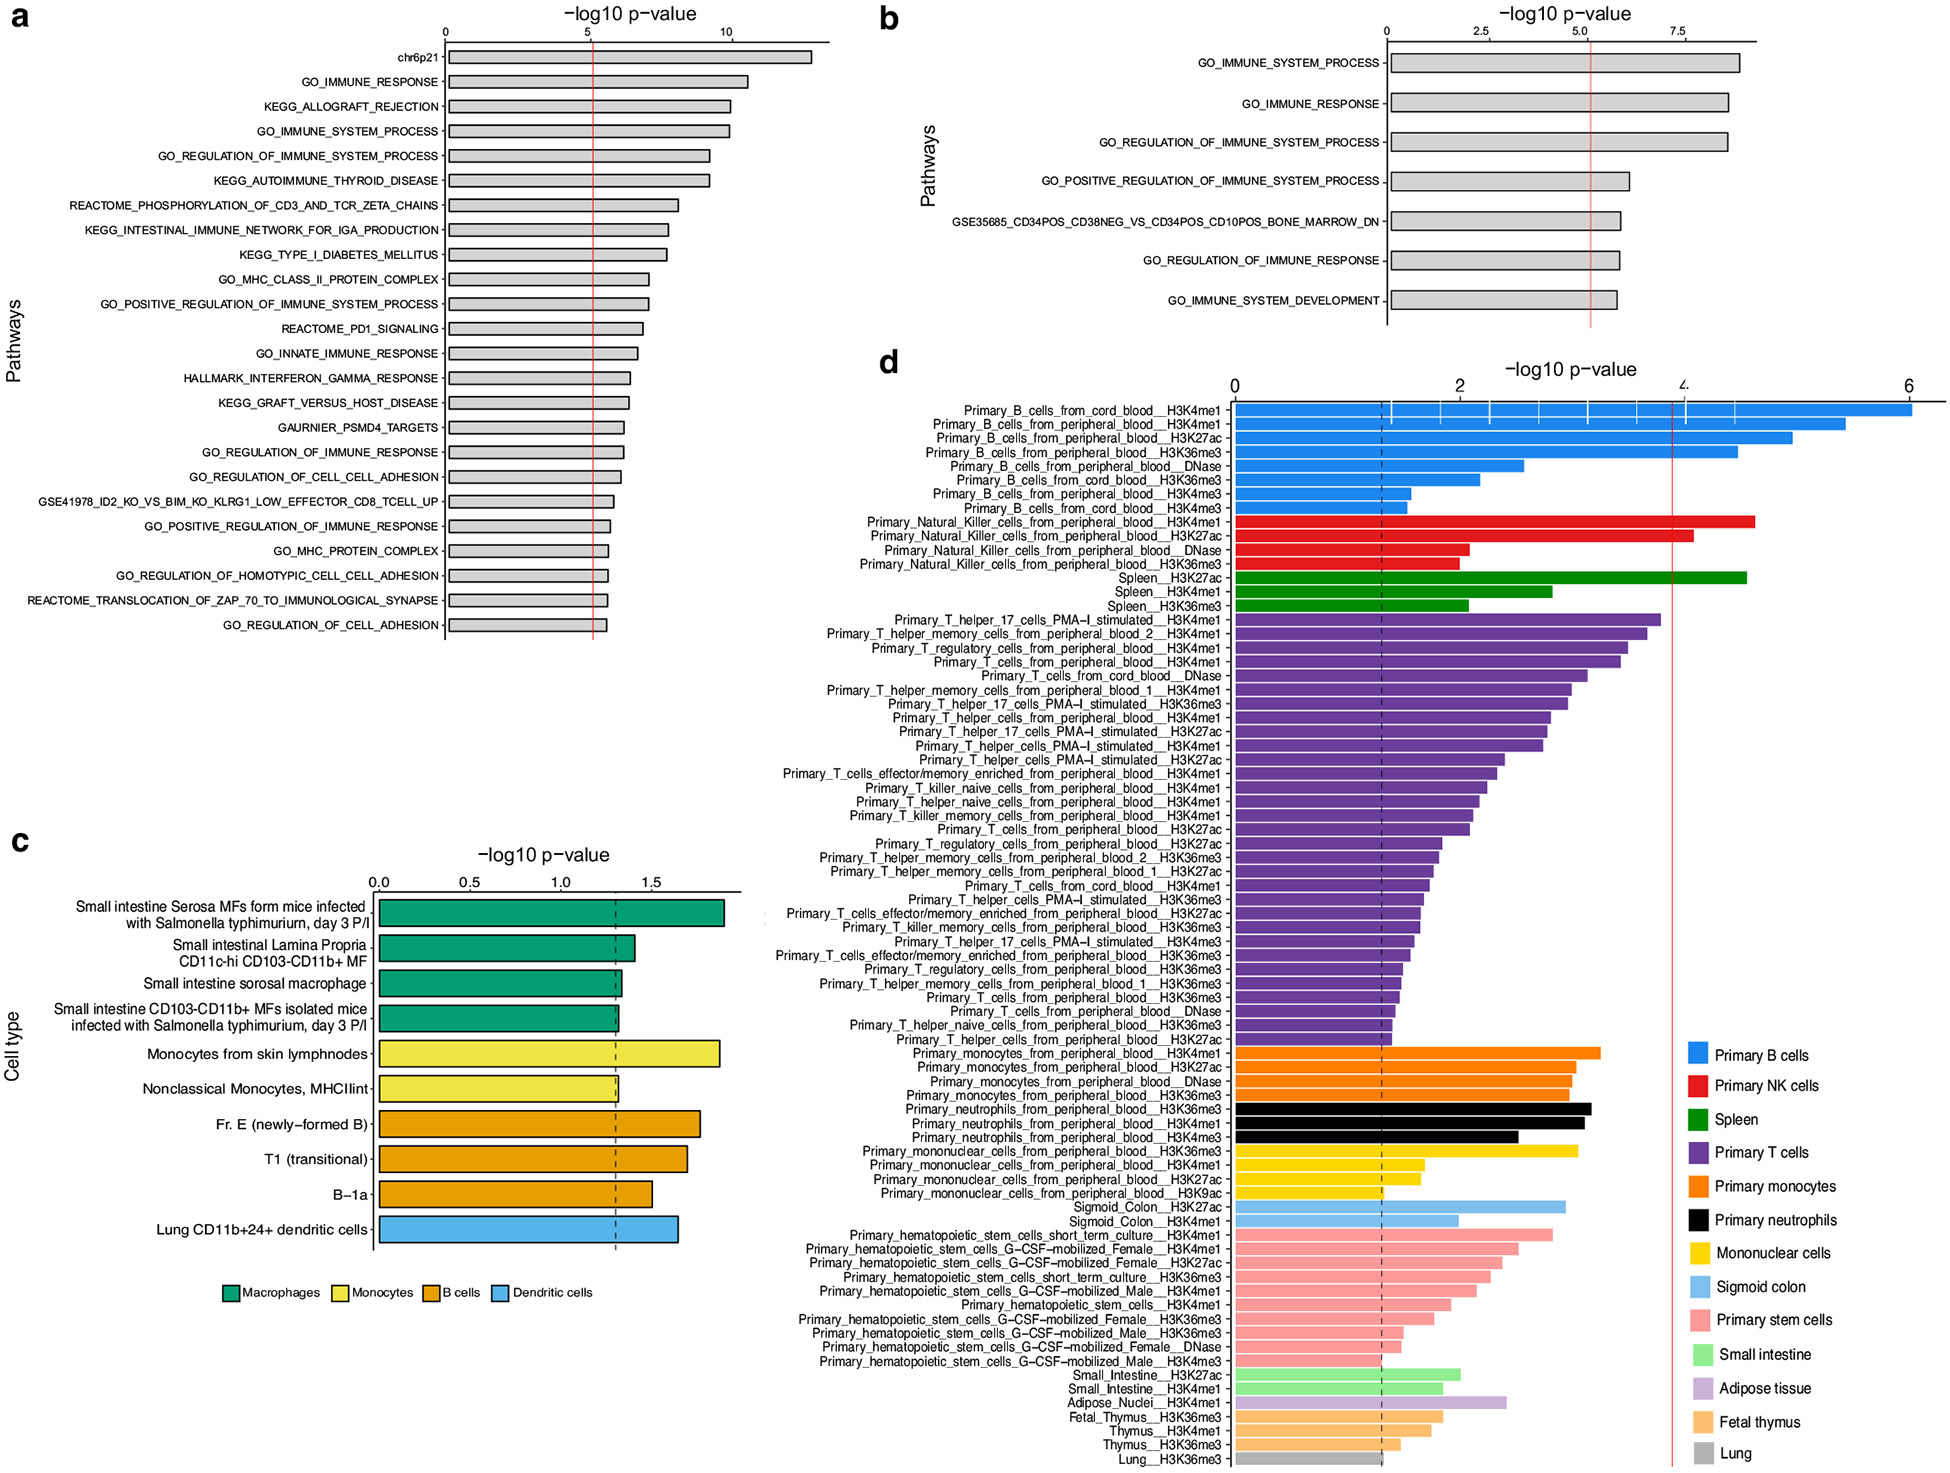
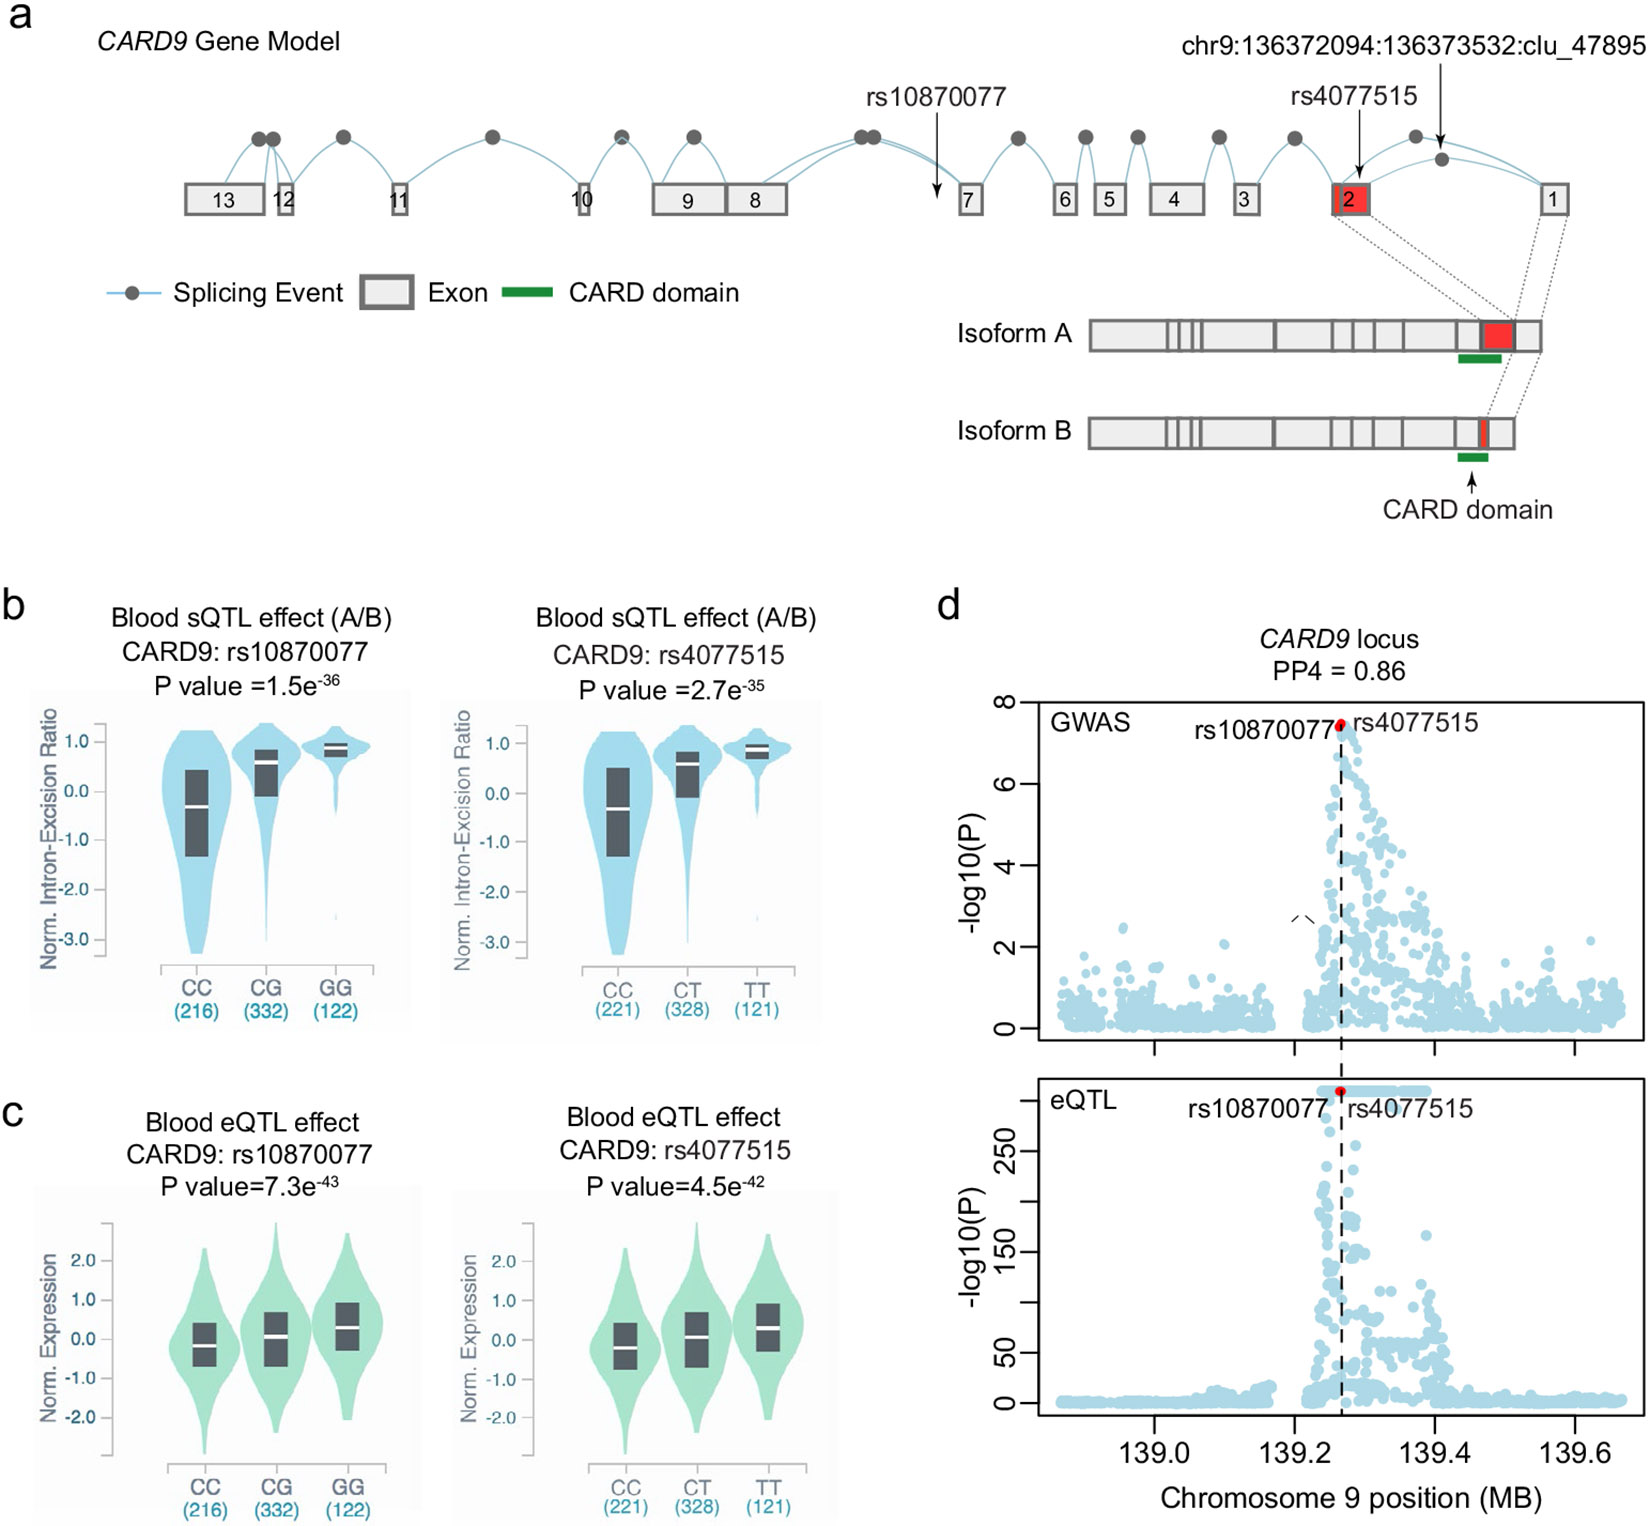
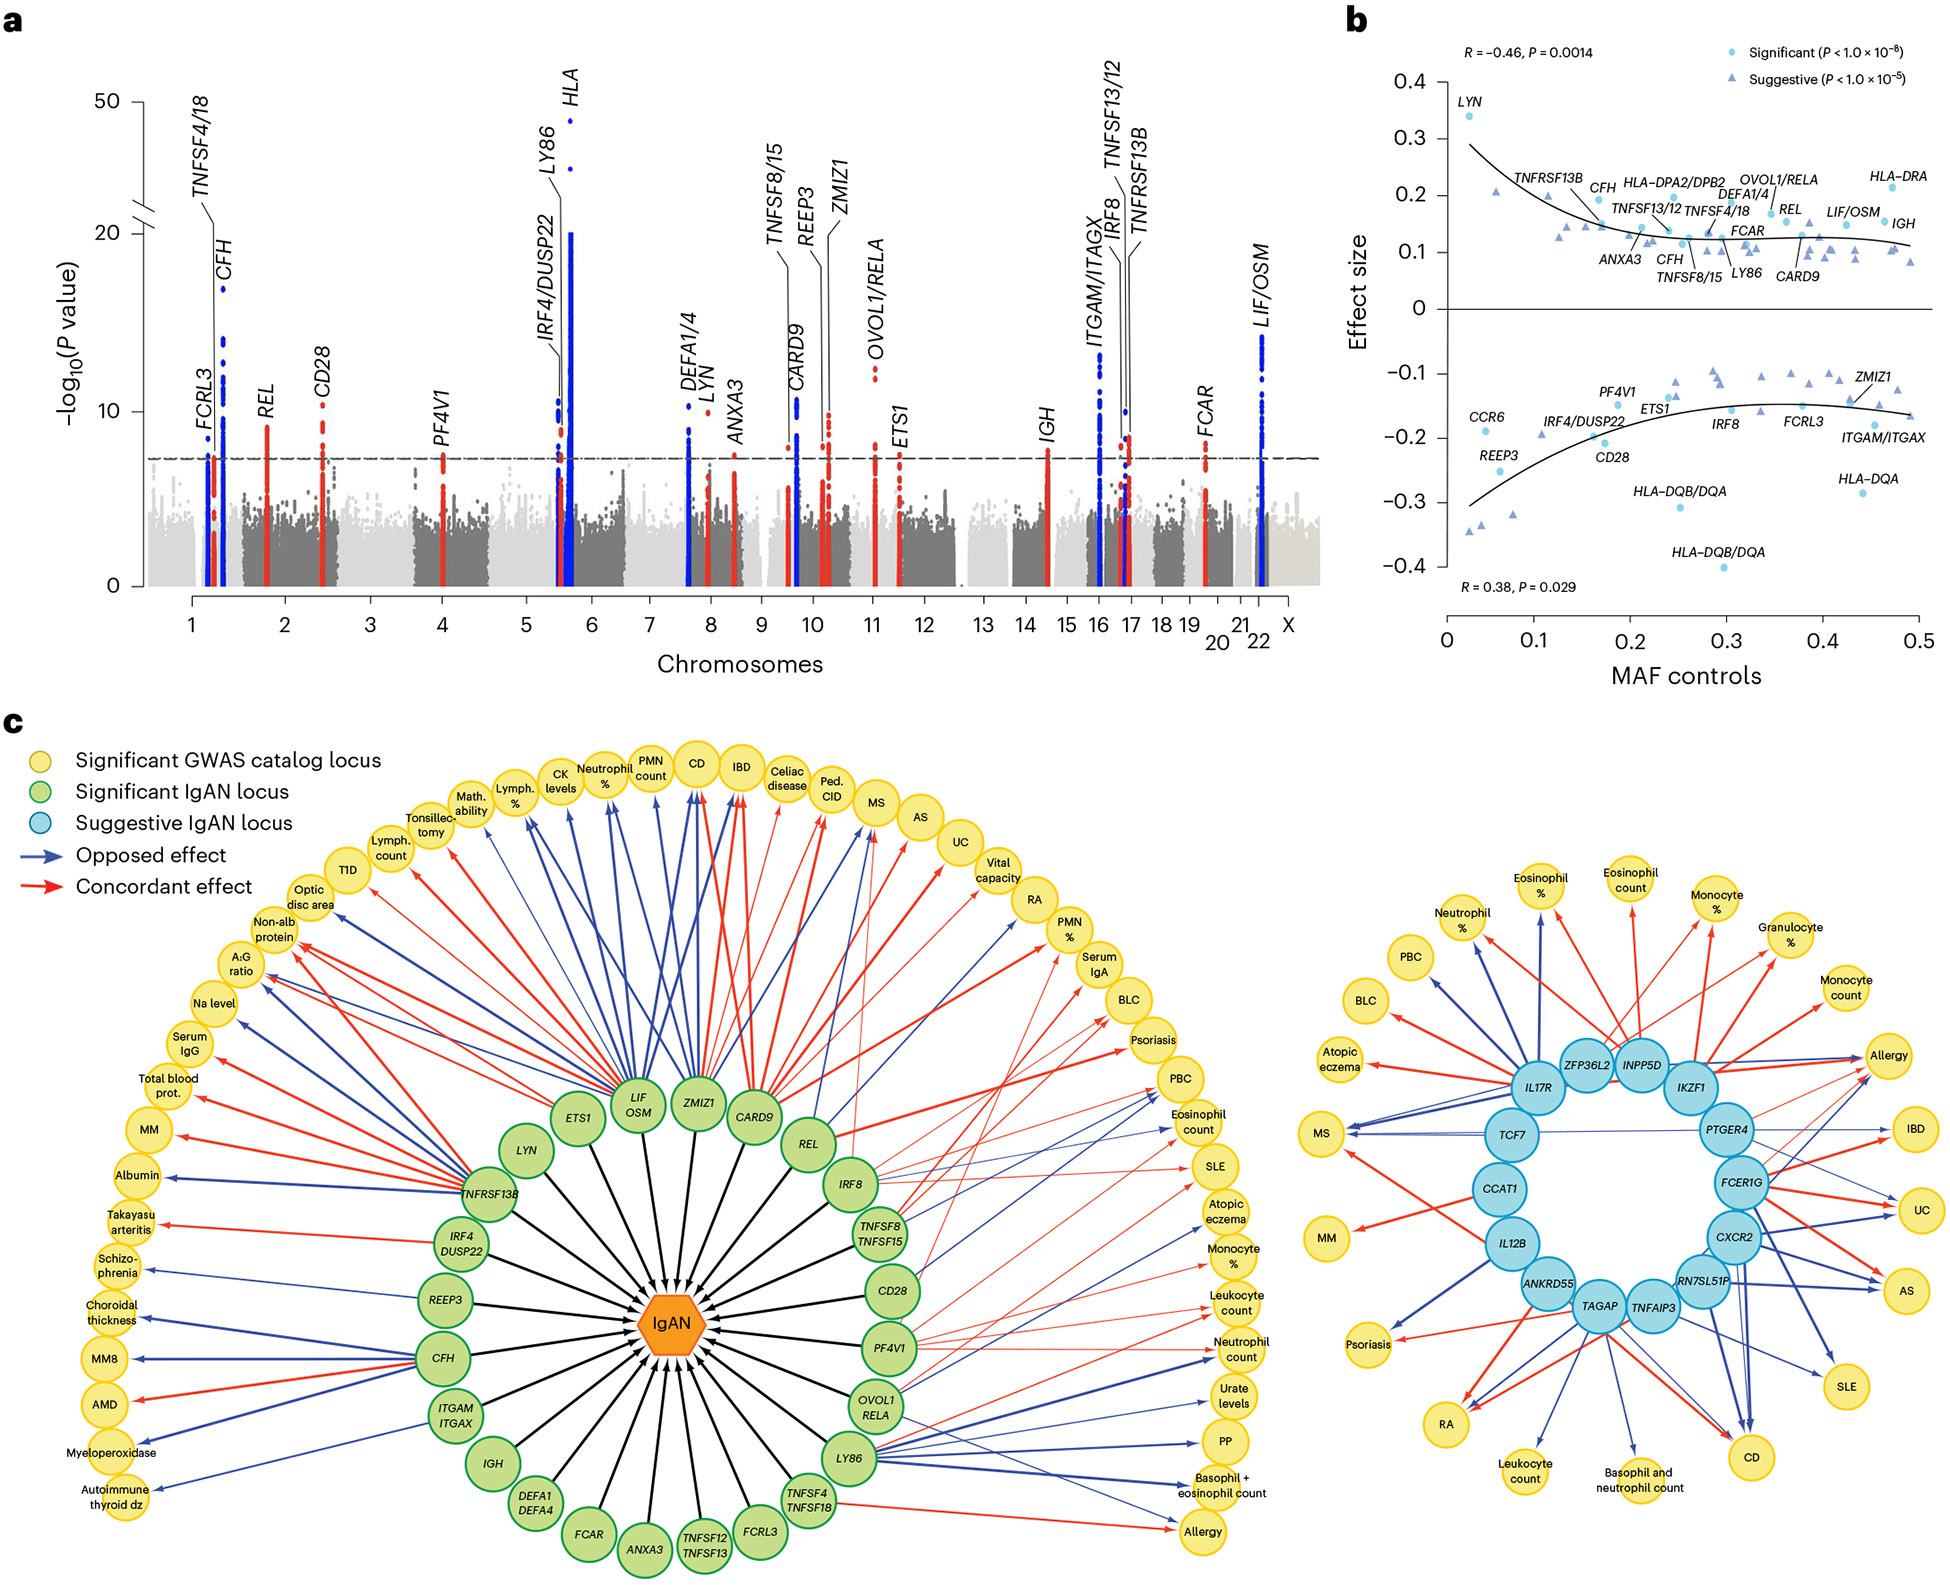
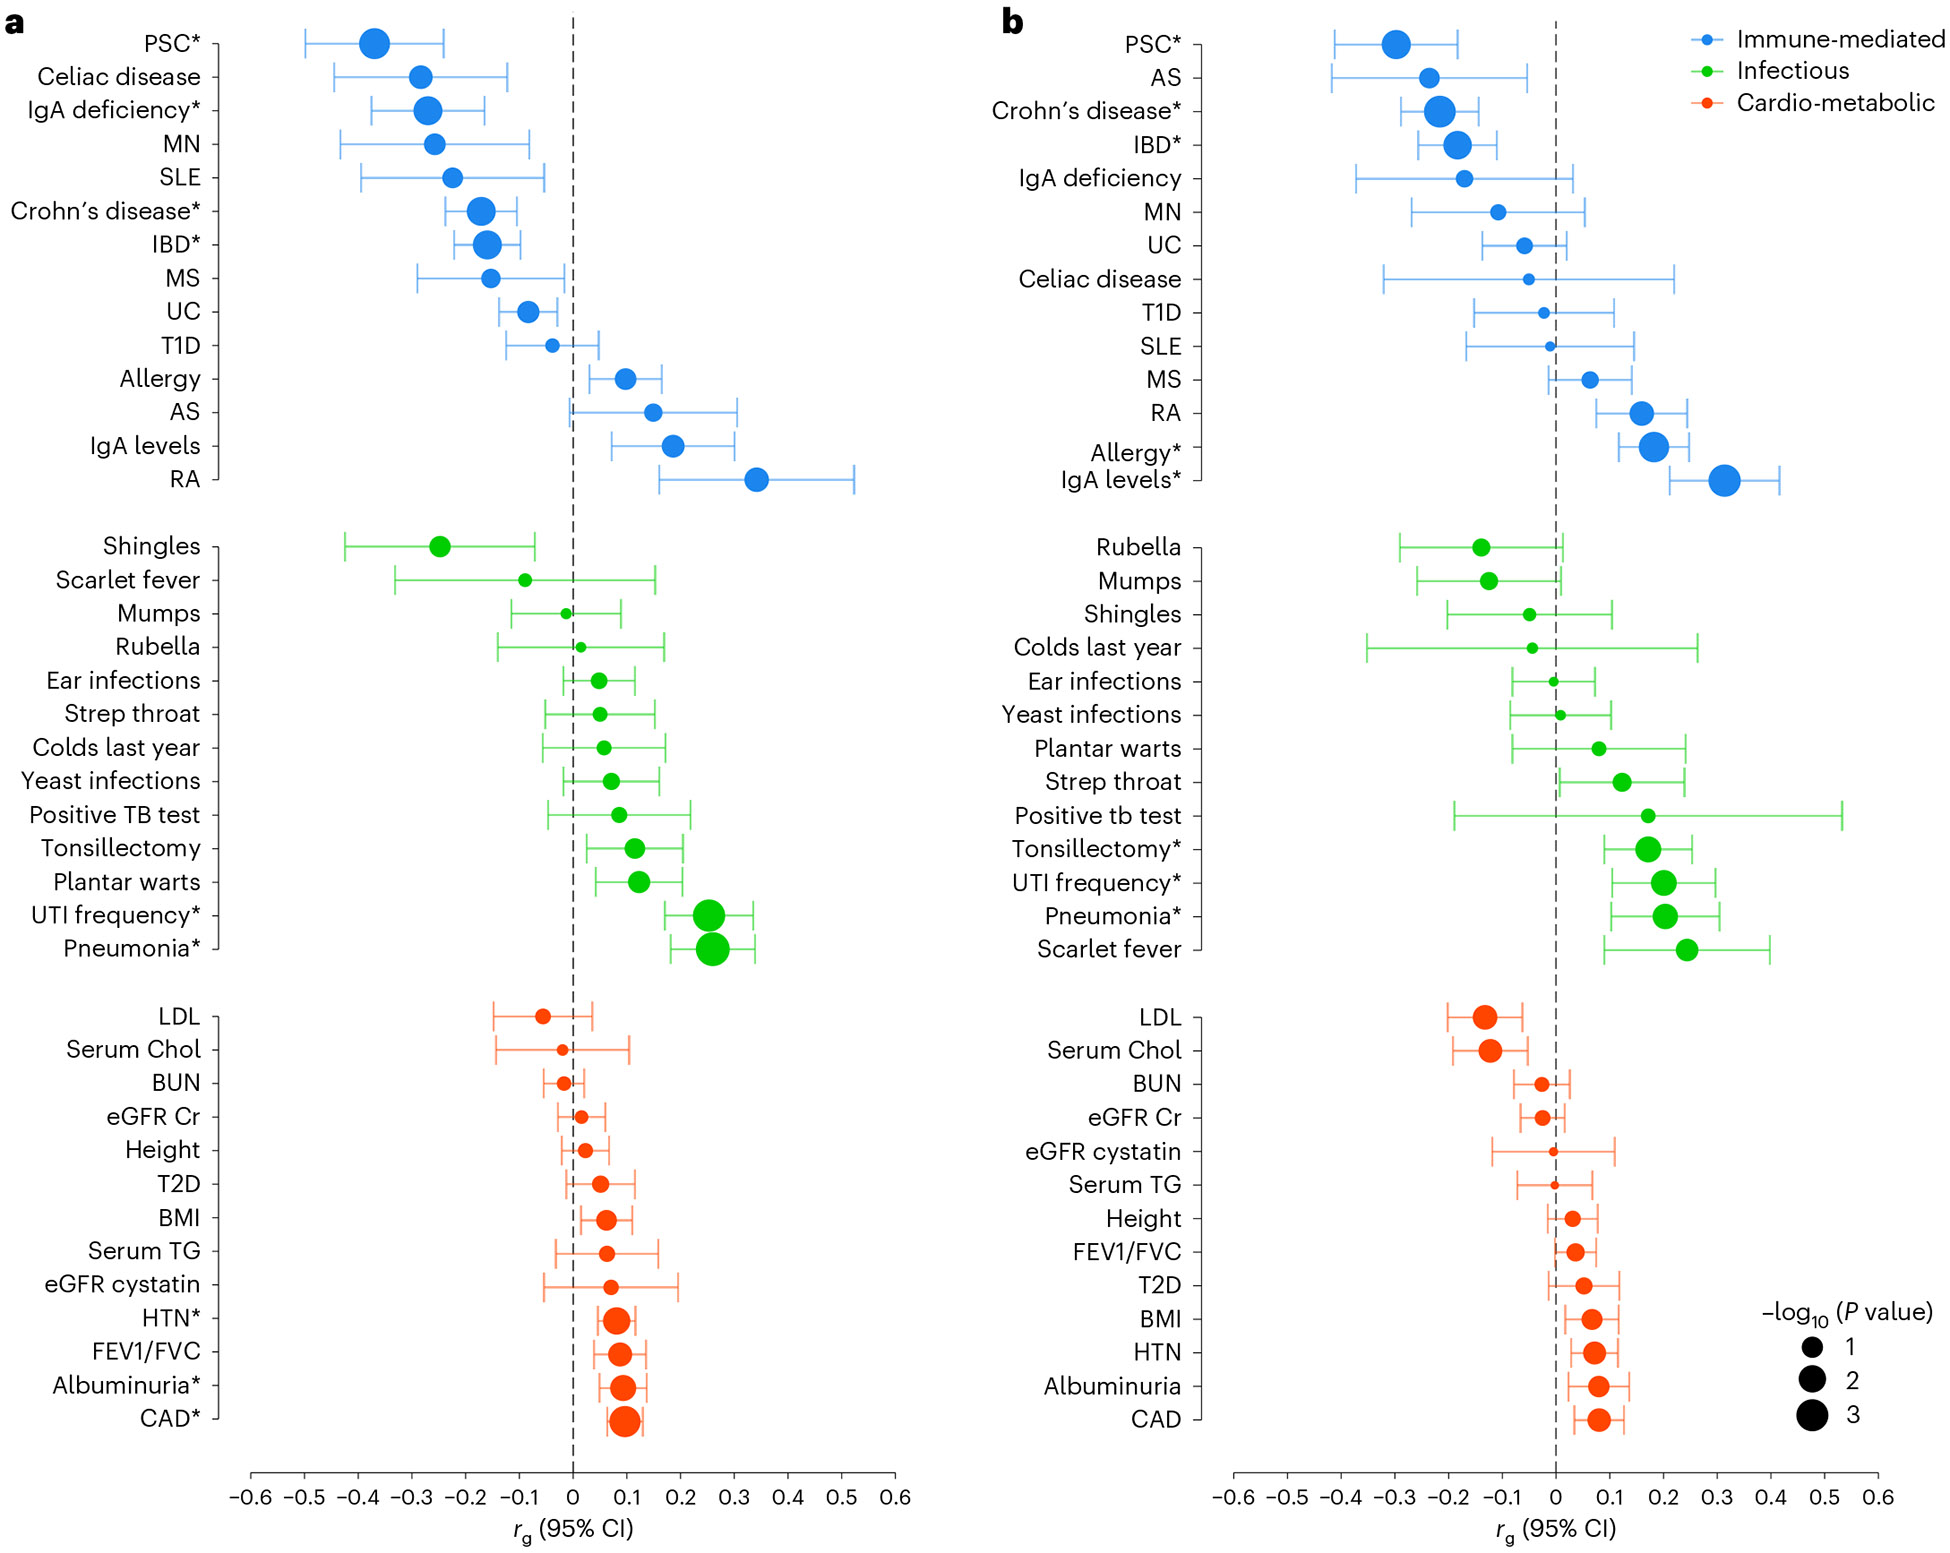
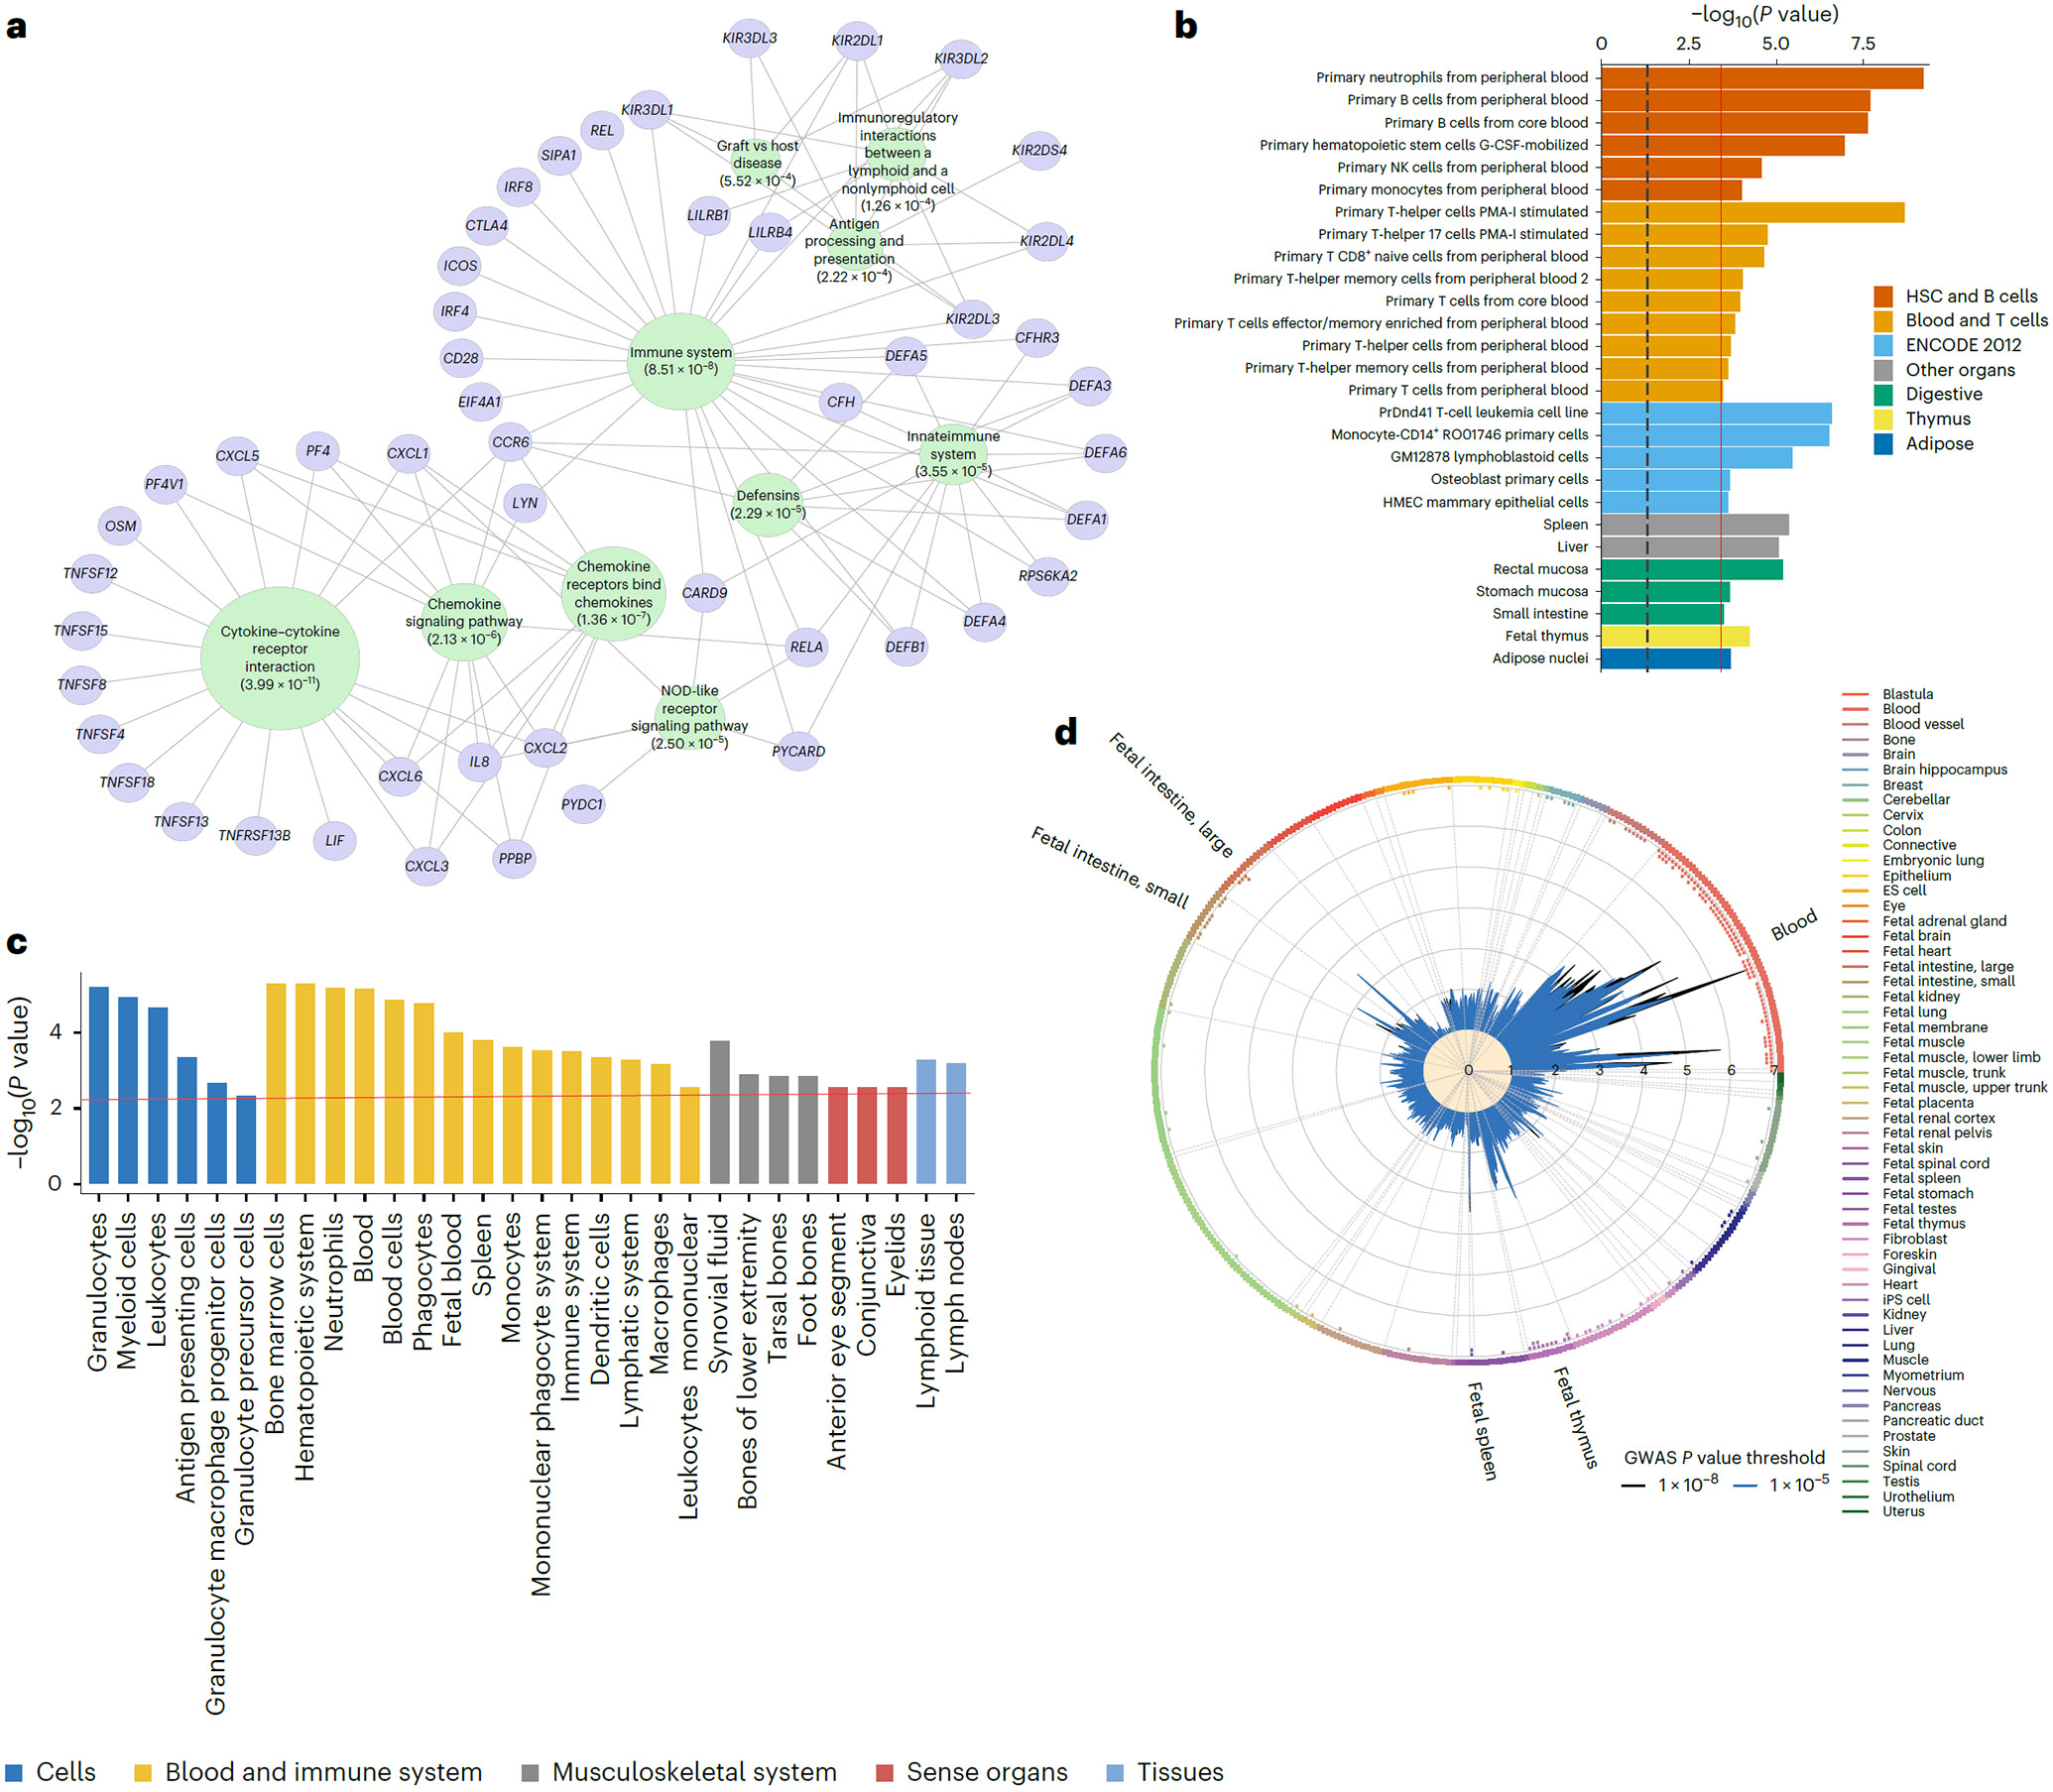
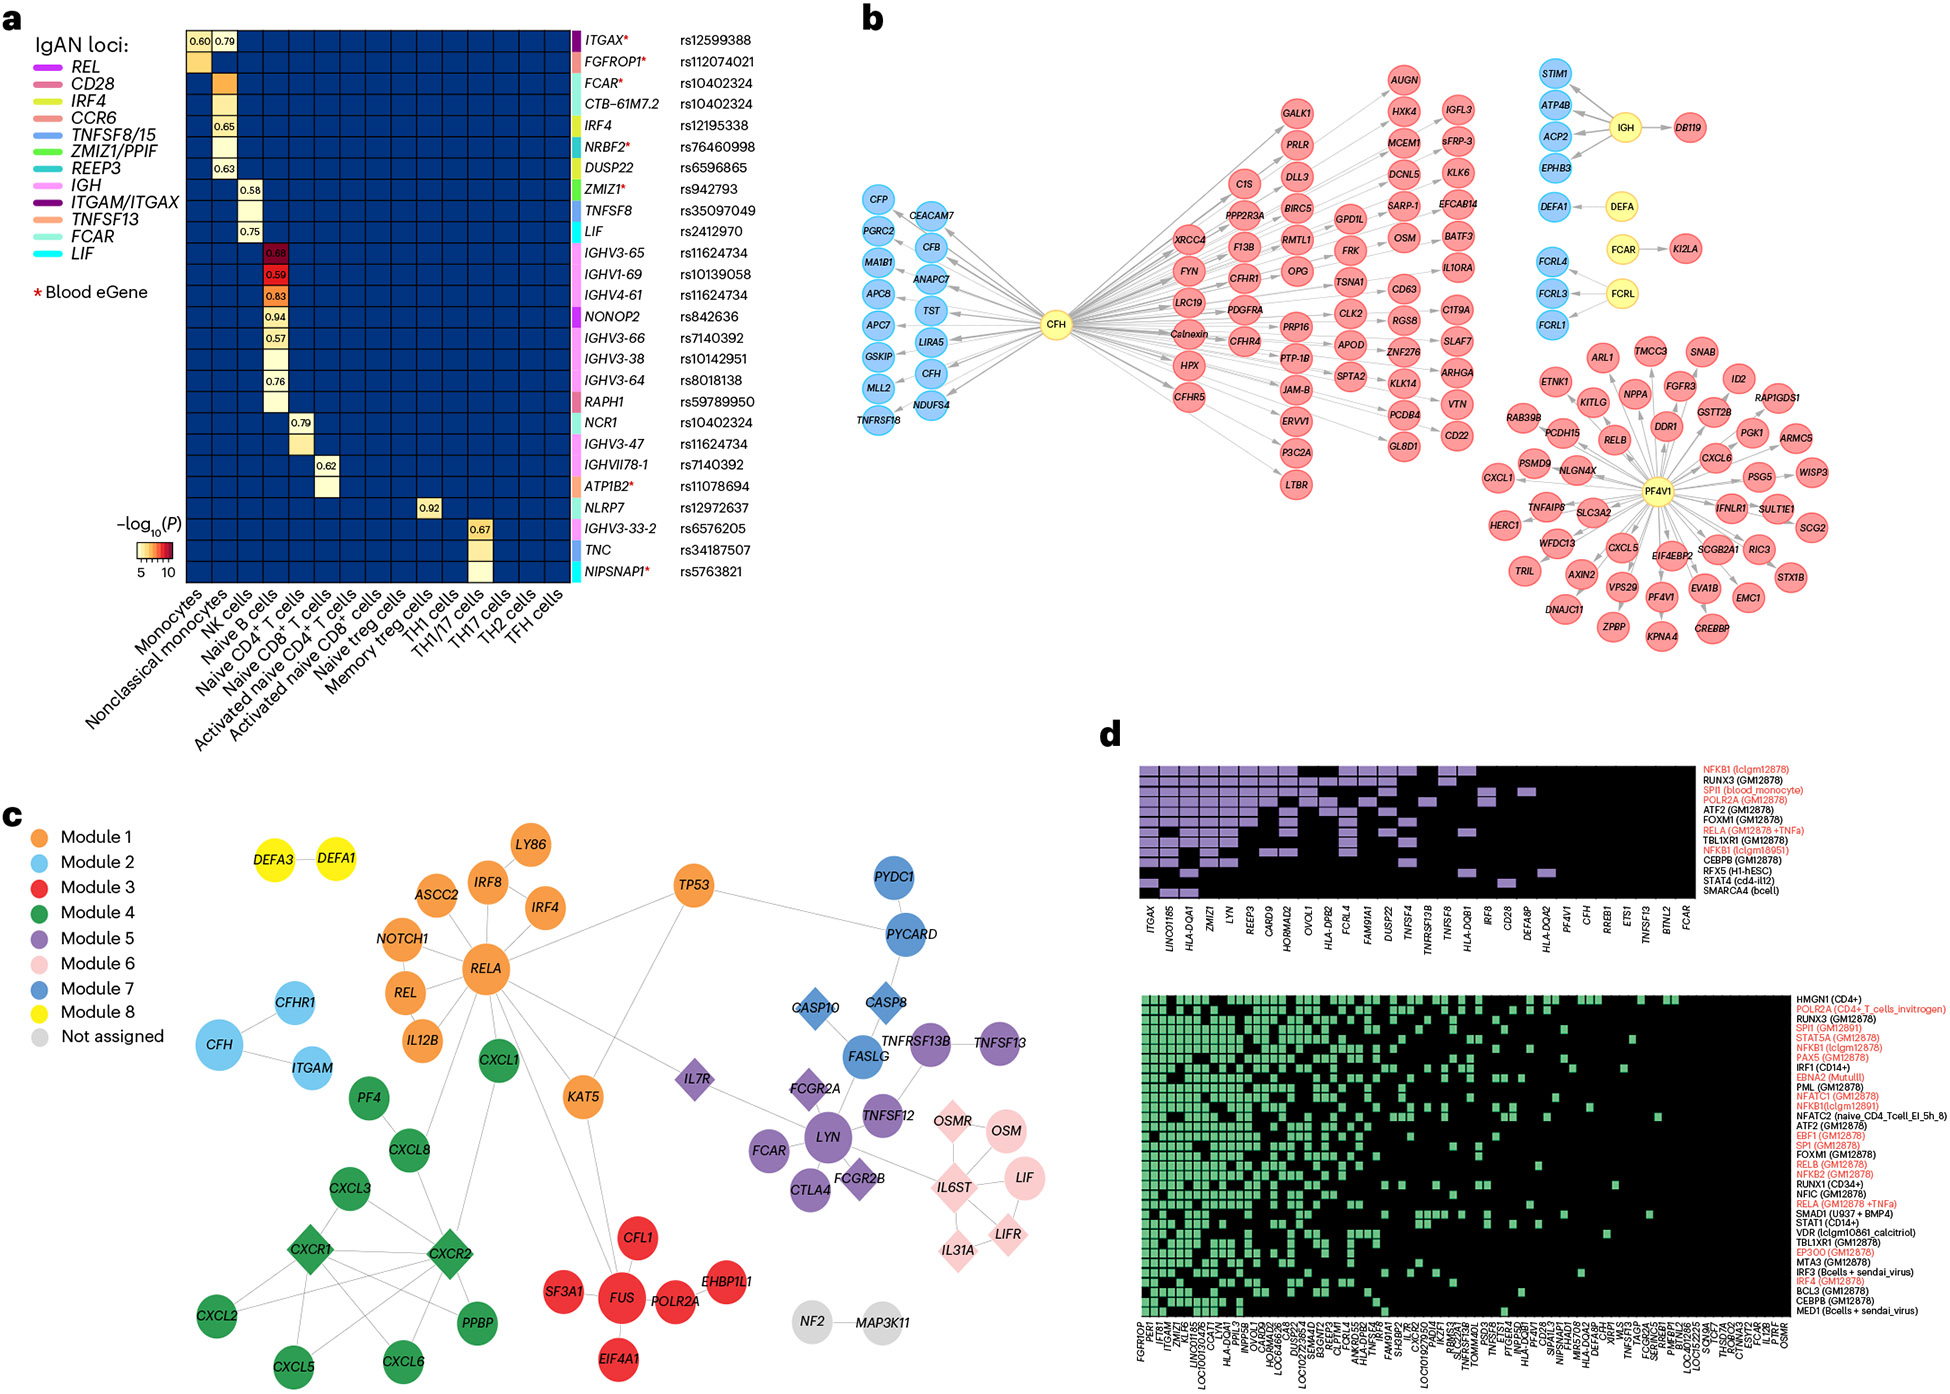
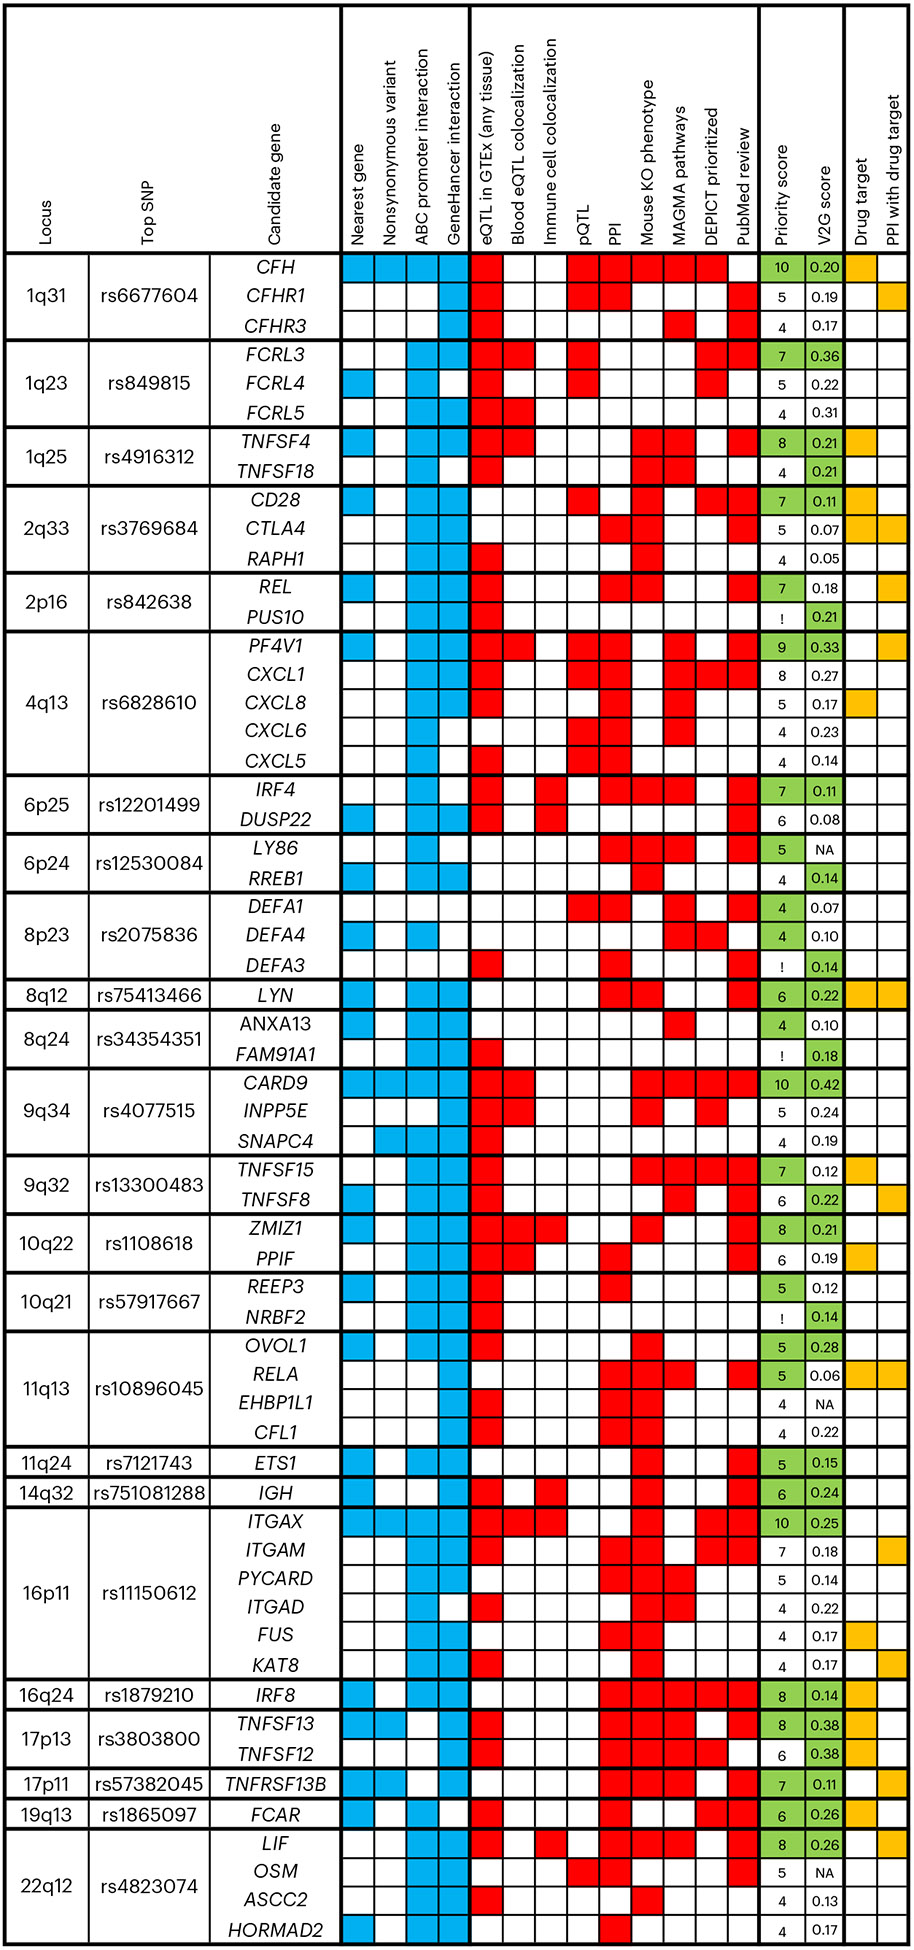
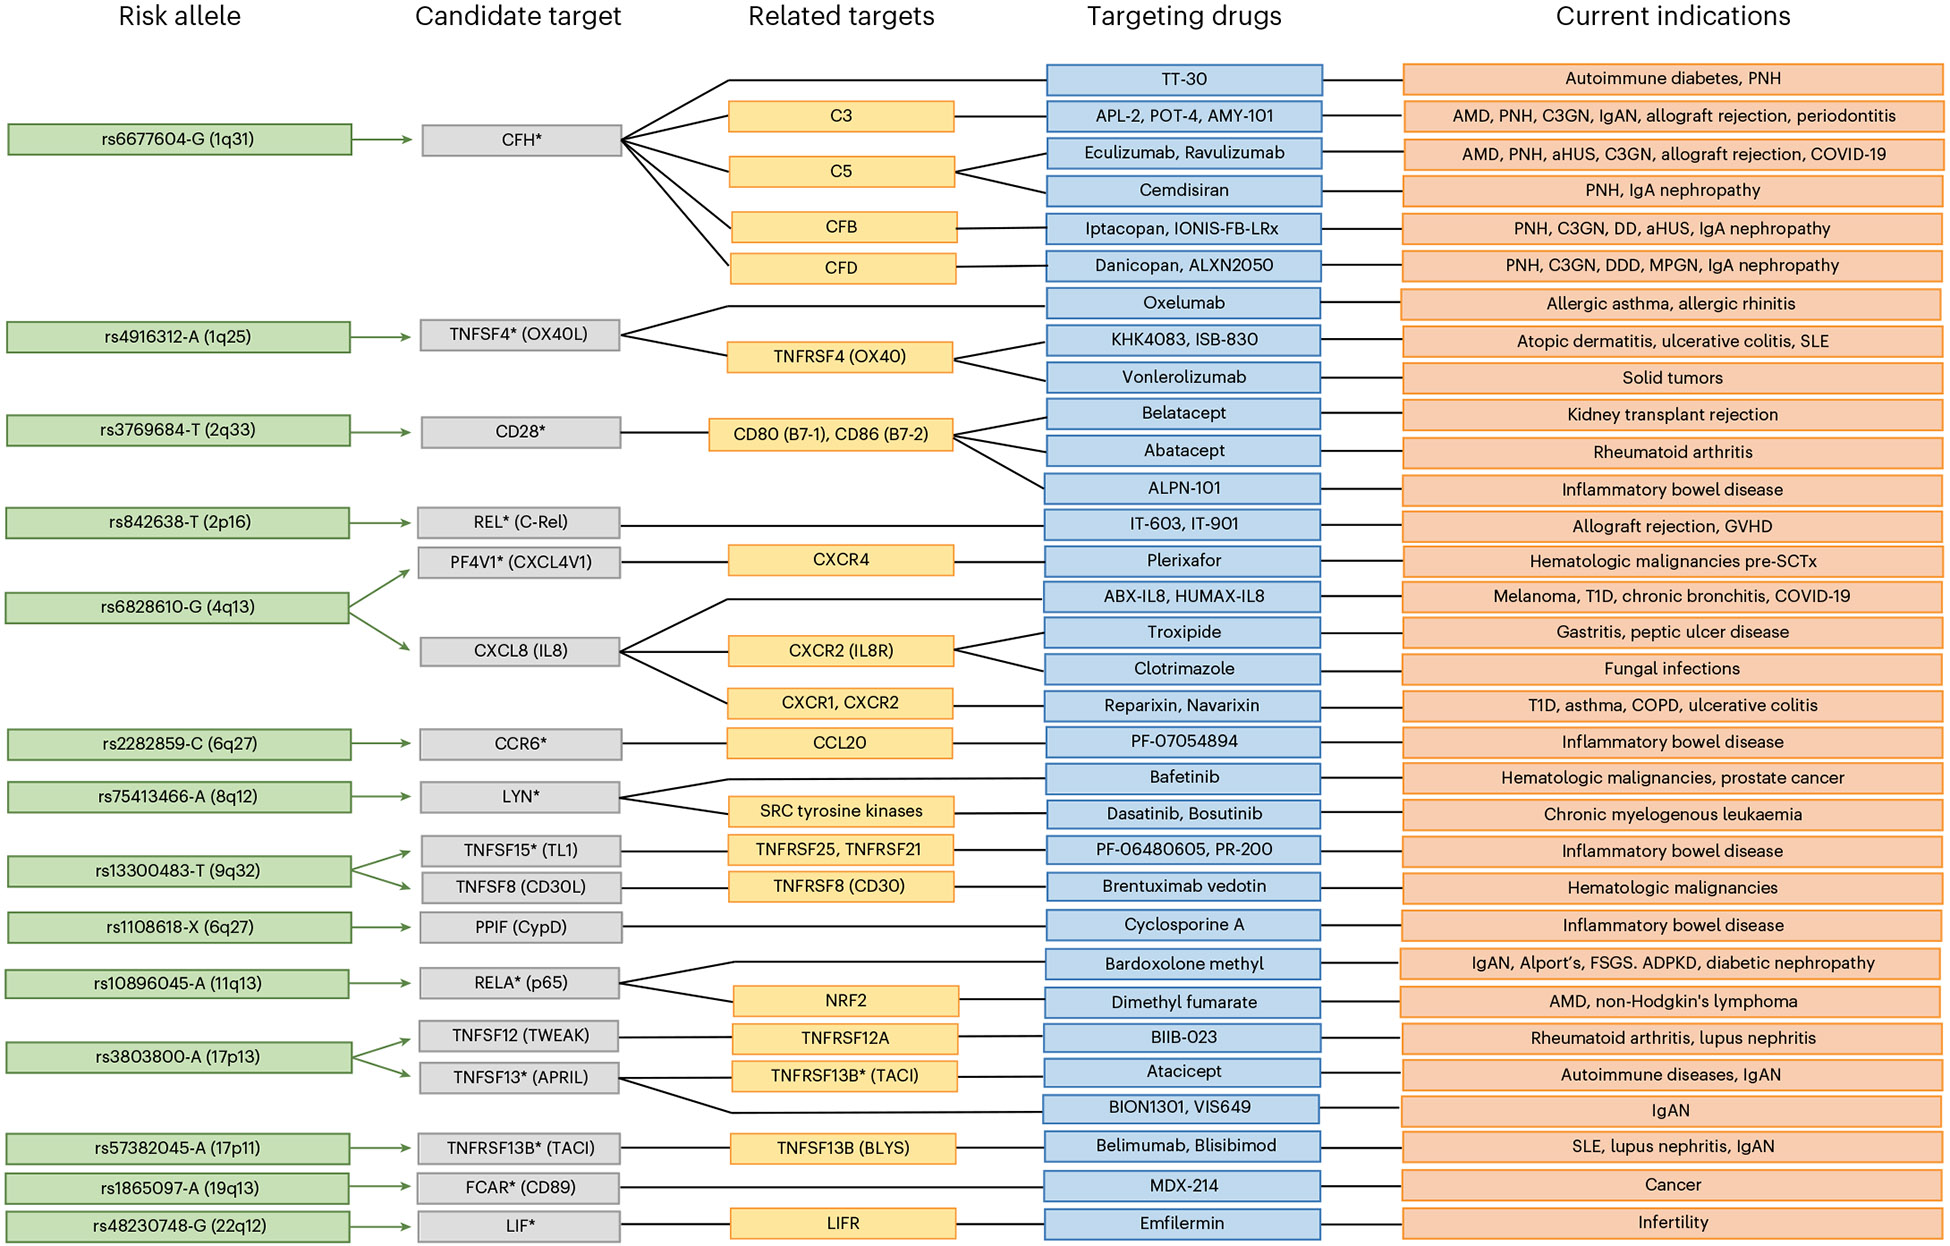
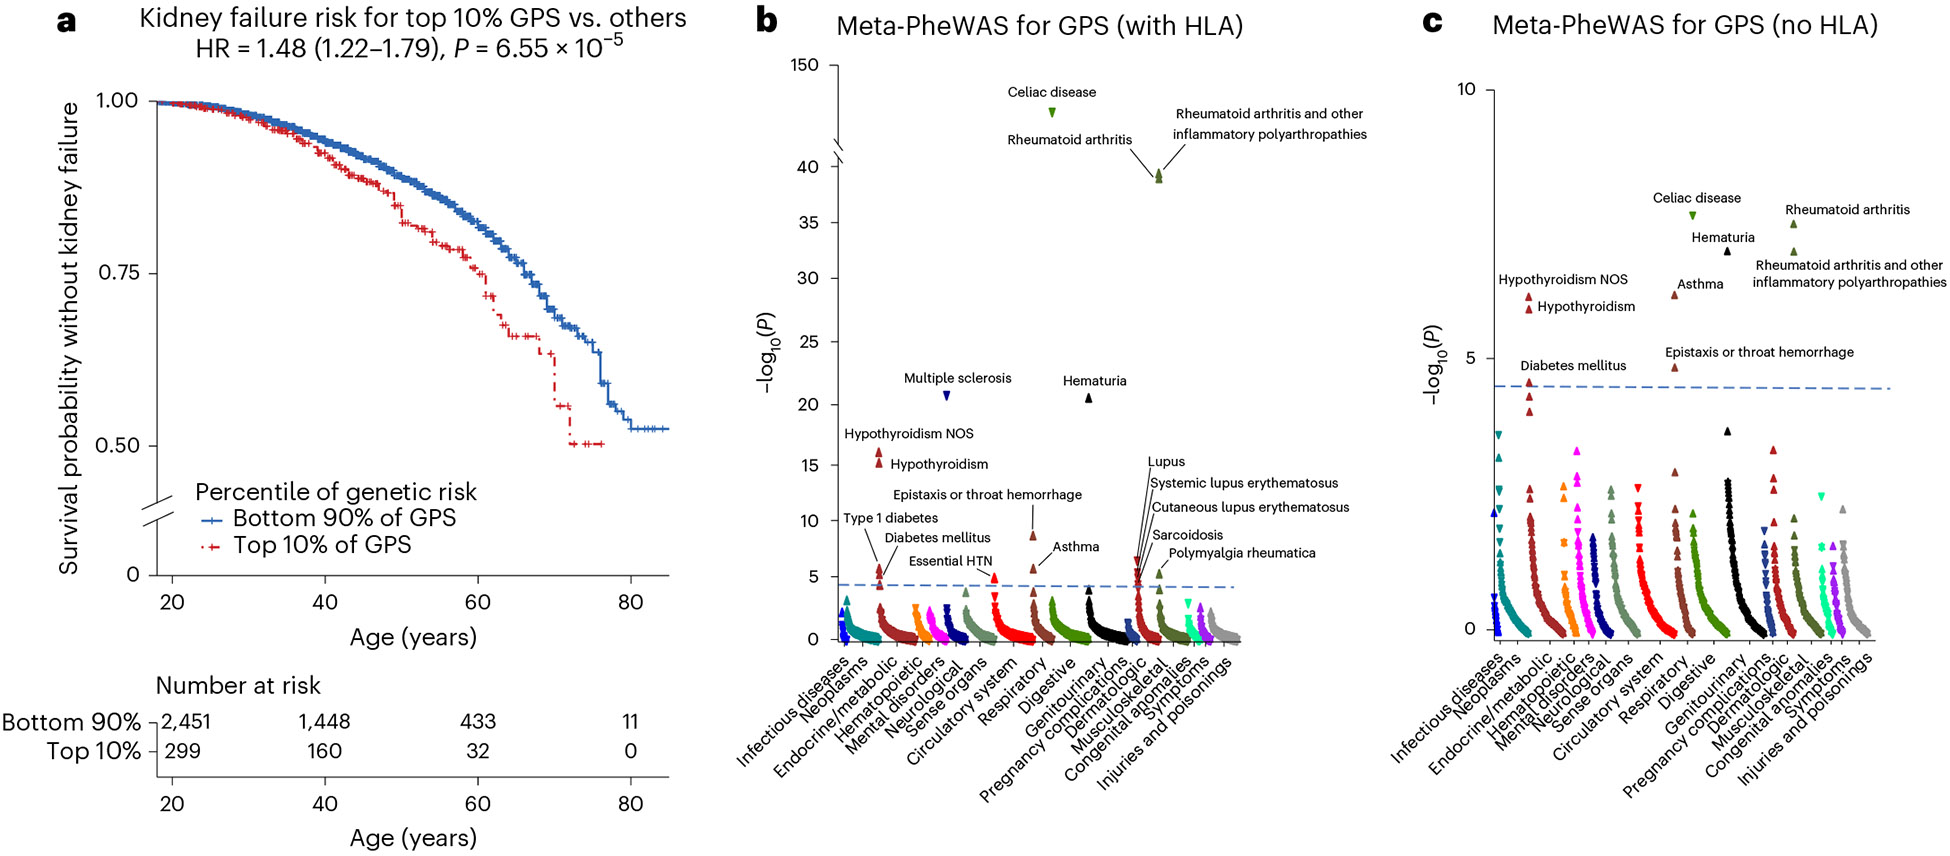
IgA nephropathy (IgAN) is a progressive form of kidney disease defined by glomerular deposition of IgA. Here we performed a genome-wide association study of 10,146 kidney-biopsy-diagnosed IgAN cases and 28,751 controls across 17 international cohorts. We defined 30 genome-wide significant risk loci explaining 11% of disease risk. A total of 16 loci were new, including TNFSF4/TNFSF18, REL, CD28, PF4V1, LY86, LYN, ANXA3, TNFSF8/TNFSF15, REEP3, ZMIZ1, OVOL1/RELA, ETS1, IGH, IRF8, TNFRSF13B and FCAR. The risk loci were enriched in gene orthologs causing abnormal IgA levels when genetically manipulated in mice. We also observed a positive genetic correlation between IgAN and serum IgA levels. High polygenic score for IgAN was associated with earlier onset of kidney failure. In a comprehensive functional annotation analysis of candidate causal genes, we observed convergence of biological candidates on a common set of inflammatory signaling pathways and cytokine ligand-receptor pairs, prioritizing potential new drug targets.


Figures

Extended Data Fig. 1 ∣
Extended Data Fig. 1 ∣. Quantile-quantile (QQ) plot of the combined meta-analysis across 38,897 individuals.
Blue dots represent the QQ plot based on all SNPs in the meta-analysis, and red dots represent the QQ plot after exclusion of SNPs within the MHC region. The overall genomic inflation factor (λ) was 1.048 with the MHC region, and 1.042 without the MHC region. The y-axis depicts −log10 of the observed two-sided P-values for a fixed effects meta-analysis of all cohorts without correction for multiple testing. The x-axis depicts −log10 of the expected two-sided P-values under the null hypothesis.
Extended Data Fig. 2 ∣
Extended Data Fig. 2 ∣. Regional plots for non-HLA genome-wide significant loci.
a, The FCRL locus. b, The TNFSF4 locus. c, The CFH locus. d, The REL locus. e, The CD28 locus. f, The PF4V1/CXCL8 locus. g, The IRF4 locus. h, The RREB1 locus. i, The DEFA locus. j, The LYN locus. k, The ANXA3 locus. l, The TNFSF8 locus. m, The CARD9 locus. n, The REEP3 locus. o, The ZMIZ1 locus. p, The RELA locus. q, The ETS1 locus. r, The IGH locus. s, The ITGAM locus. t, The IRF8 locus. u, The TNFSF13 locus. v, The TNFRSF13B locus. w, The FCAR locus. x, The HORMAD2/LIF locus. The x-axis shows the physical position in Mb (hg19 coordinates) and known genes. The left y-axis presents −log10 of two-sided P-values for variant association statistics (fixed effects meta-analysis under an additive model without correction for multiple testing), and the right y-axis shows the recombination rate across the region. The dotted horizontal line indicates a genome-wide significance threshold of 5.0 × 10⁻⁸.
Extended Data Fig. 3 ∣
Extended Data Fig. 3 ∣. Manhattan plots for East Asian GWAS subgroup analyses.
a, East Asian meta-analysis under an additive genetic model (λ = 1.040) revealed a new genome-wide significant locus on chr. 6 (CCR6, green). b, East Asian meta-analysis under a recessive model (λ = 0.940) revealed a new genome-wide significant locus on chr. 1 (encoding PADI3 and PADI4, green). The y-axis shows -log10 of two-sided P-values for a fixed effects meta-analysis under an additive or recessive genetic model without correction for multiple testing (note that y-axis is truncated to accommodate the HLA peak). The x-axis shows genomic position along each chromosome (1-22 and X). The dotted horizontal line indicates P = 5.0 × 10⁻⁸.
Extended Data Fig. 4 ∣
Extended Data Fig. 4 ∣. Stepwise conditional analyses of the CFH and HLA loci.
a, CFH locus. Initial meta-analysis results without conditioning (top left); after conditioning for the top SNP rs6677604 (top middle); and after controlling for the two significant SNPs rs6677604 and rs12029571 (top right). b, HLA locus. Initial meta-analysis results without conditioning (middle left); after conditioning for the top SNP rs9268557 (middle), after controlling for rs9268557 and rs9275355 (middle right), after controlling for rs9268557, rs9275355 and rs9272105 (bottom left), after controlling for rs9268557, rs9275355, rs9272105 and rs9275596 (bottom middle), and after controlling for rs9268557, rs9275355 rs9272105, rs9275596 and rs3128927 (bottom right) with no additional significant signals. The x-axis shows genomic position in Mb (hg19 coordinates) and known genes. The left y-axis presents −log10 P-values for association statistics (two-sided P-values for a fixed effects meta-analysis under an additive genetic model without correction for multiple testing). The right y-axis (light-blue line) shows the average recombination rate across the region. The dotted horizontal line indicates a genome-wide significance threshold of 5.0 × 10⁻⁸. The top SNP in each panel is marked by a red diamond.
Extended Data Fig. 5 ∣
Extended Data Fig. 5 ∣. Stepwise conditional analysis of imputed polymorphic amino-acid positions in DRβ, DQβ, and DQα peptides in East Asian and European cohorts.
a, East Asian cohorts. b, European cohorts. Each symbol represents a polymorphic site tested for association with IgAN along the peptide sequence. The x-axis shows genomic position of the sequence encoding each amino acid. The y-axis shows global statistical significance for each polymorphic site (two-sided multiallelic Wald test without adjustment for multiple testing). The dashed horizontal line corresponds to a genome-wide significance threshold of 5.0 × 10⁻⁸. c, Physical location of independently associated amino acid positions 11 (red) and 71 (orange) in the structural model of DRβ. The DR structure was visualized using UCSF Chimera v1.16 based on Protein Data Bank entry 3PDO.
Extended Data Fig. 6 ∣
Extended Data Fig. 6 ∣. Enrichment tests for the GWAS candidate gene set against human ortholog gene sets that when genetically manipulated in mice result in “Abnormal Antibody Levels” or “Abnormal Immunoglobulin A Levels”.
a, Plot for “Abnormal Antibody Levels”. b, Plot for “Abnormal Immunoglobulin A Levels”. The x-axis depicts gene rank by statistical significance. The y-axis depicts −log10 of two-sided P-value based on the enrichment test without multiple testing correction. The red horizontal line is the Bonferroni-corrected statistical significance level corrected for the number of genes tested.
Extended Data Fig. 7 ∣
Extended Data Fig. 7 ∣. Pathway, cell type and tissue enrichment analyses.
a,b, MAGMA pathway enrichment analysis based on GWAS summary statistics with (a) and without (b) the HLA region. −log10 of two-sided P-values for the enrichment test (not corrected for multiple testing) are depicted along the x-axis. Significant pathways are listed along the y-axis. Red vertical lines indicate significance threshold after accounting for multiple testing. c, Cell type-specific heritability enrichment for functional annotations in ImmGen dataset of mouse regulatory elements and expression data demonstrating the strongest enrichment in small intestine-derived macrophages profiled three days after Salmonella infection. d, Cell type-specific heritability enrichment for individual functional annotations generated by Roadmap Epigenomics demonstrates significant enrichment in immune cells, especially of B-cell lineage. All enrichments at nominal two-sided uncorrected P < 0.05 are displayed and grouped according to cell and tissue class. A solid red line represents a stringent Bonferroni-corrected −log10 of the two-sided P-value threshold of significance for the Roadmap dataset (P = 1.3 × 10⁻⁴). A dotted black line represents the −log10 of the nominal P-value of 0.05. GO, Gene Ontology; KEGG, Kyoto Encyclopedia of Genes and Genomes; MF, macrophages; P/I, post-injection.
Extended Data Fig. 8 ∣
Extended Data Fig. 8 ∣. Cis-regulatory effects at the CARD9 locus.
a, The CARD9 gene model depicting 13 exons of CARD9 and the splicing events from GTEx blood RNA-seq. The top IgAN risk allele (rs4077515-T) encodes S12N substitution in the second exon of CARD9. This SNP also exhibits a strong and statistically significant blood sQTL effect, wherein the risk allele is associated with higher rates of the chr9:136372094:136373532:clu_47895 splicing event, leading to the retention of exon 2 (red) in the coding sequence of CARD9 (isoform A), while the protective (rs4077515-C) allele is associated with the alternative splicing event that truncates exon 2 (isoform B). The functional CARD domain (green) maps to a portion of exon 2 that is intact in isoform A, but truncated in isoform B. b, Blood splice QTL violin plots of normalized intron excision ratios (corresponding to the ratio of isoform A to isoform B) by the genotype of rs10870077 (top blood sQTL in GTEx) and rs4077515 (top SNP in GWAS for IgAN). These two SNPs are in near perfect linkage disequilibrium (r2 > 0.98). The white bar represents a median, the thick gray bar represents an interquartile range, and the blue shape reflects the distribution kernel density estimation. Numbers in parentheses under the x-axis indicate n independent samples per each genotype group. c, Both rs10870077 and rs4077515 are also associated with a significant cis-eQTL effect on CARD9 mRNA levels in GTEx blood (violin plots with similar definitions as in b). d, The blood eQTL signal for CARD9 significantly co-localizes with the GWAS signal (PP4 of 0.86). The top panel represents a regional plot for the GWAS signal (Immunochip data excluded). The bottom panel represents a blood cis-eQTL signal for CARD9 from the QTLGen Consortium meta-analysis (y-axis truncated at P < 1 × 10−310); rs10870077 and rs4077515 are indicated in red. All P-values are two-sided, correspond to a logistic regression Wald test under an additive genetic model, and are not corrected for multiple testing.
Fig. 1 ∣
Fig. 1 ∣. Cross-ancestry GWAS for IgAN.
a, Manhattan plot for the combined meta-analysis across 38,897 individuals. The dashed horizontal line indicates a genome-wide significant P value = 5.0 × 10⁻⁸. The y axis shows −log10 of two-sided P values (fixed-effects meta-analysis of all cohorts without correcting for multiple testing) and is truncated to accommodate the HLA signal. The x axis shows genomic position for each chromosome (1–22 and X). Red, new genome-wide significant loci associated with IgAN; dark blue, previously known loci reaching genome-wide significance in this study. Locus name based on the top candidate gene from our biological prioritization strategy. b, Effect size (β, y axis) as a function of MAF (x axis) for suggestive and significant GWAS loci. Minor alleles with positive effect sizes (risk alleles) are represented at the top, and negative effect sizes (protective alleles) are represented at the bottom. A three-degree polynomial regression curve was fitted to illustrate positive and negative correlations. Correlation coefficients (R) and their corresponding P values (P) are also provided. Light-blue circles represent genome-wide significant loci and are labeled using the most likely candidate gene per locus. Blue triangles represent suggestive loci. c, Pleiotropic effects of non-HLA GWAS loci for IgAN based on the NHGRI GWAS catalog. Only genome-wide significant associations in LD (r2 > 0.5) with IgAN top SNPs are included as edges. Yellow are diseases and traits sharing at least one locus with IgAN. Edge thickness is proportional to the LD between the IgAN top SNP and the lead association SNP for GWAS catalog traits. Concordant effects are indicated in red, and opposed effects are indicated in blue. Green nodes represent IgAN GWAS loci, and light-blue nodes are IgAN-suggestive loci. Only 14 suggestive loci sharing at least one pleiotropic association with a genome-wide significant IgAN locus are depicted.
Fig. 2 ∣
Fig. 2 ∣. Genome-wide genetic correlation analysis between IgAN and other complex traits.
a, Including HLA region. b, Excluding HLA region. The traits are organized by immune-mediated (blue), infectious (green) and cardiometabolic (orange) categories and sorted based on the genetic correlation coefficient (rg). The data are presented as rg point estimates (center) with bars corresponding to 95% CIs. PSC, primary sclerosing cholangitis; MN, membranous nephropathy; SLE, systemic lupus erythematosus; IBD, inflammatory bowel disease; MS, multiple sclerosis; UC, ulcerative colitis; T1D, type 1 diabetes; AS, ankylosing spondylitis; RA, rheumatoid arthritis; Chol, total serum cholesterol levels; TG, total serum triglycerides levels; LDL, low-density lipoprotein levels; BUN, blood urea nitrogen; eGFR Cr, estimated glomerular filtration rate using serum creatinine levels; T2D, type 2 diabetes; BMI, body mass index; eGFR cystatin, estimated glomerular filtration rate using serum cystatin levels; HTN, essential hypertension; FEV1/FVC, forced expiration volume at 1 s over forced vital capacity; CAD, coronary artery disease. The asterisk indicates nominal two-sided P < 0.05 for a test of genetic correlation without multiple testing correction. Supplementary Table 13 provides references to all GWAS used in this analysis along with the statistics for each correlation test.
Fig. 3 ∣
Fig. 3 ∣. Global pathway, cell-type and tissue enrichment analyses.
a, KEGG, REACTOME and BIOCARTA pathway-enrichment map based on the gene set defined by genome-wide significant risk loci excluding HLA. The top ten most substantially enriched pathways and their intersecting GWAS genes are shown. Node size reflects −log10-transformed two-sided P values of the multiple testing-adjusted hypergeometric enrichment test in GSEA. b, Cell-type-specific heritability enrichment for functional annotations based on FUN-LDA scoring system for all ENCODE and Roadmap Epigenomics cell types and tissues. The x axis depicts −log10 of two-sided P values for heritability enrichment without multiple testing correction with only significant results grouped by the tissue type depicted. Solid red line represents the Bonferroni-corrected significance threshold (P = 3.9 × 10⁻⁴). Dashed black line represents the −log10 of the nominal uncorrected P value (P = 0.05). The most significant heritability enrichments were found in blood immune cells and gastrointestinal tissues. c, Tissue and cell-type enrichment analysis with DEPICT; only cells and tissues with a false discovery rate (FDR) < 0.05 are shown. The y axis represents the −log10 of the two-sided empirical P value without multiple testing correction. The x axis shows the first-level Medical Subject Headings (MeSH) annotations. The strongest enrichment is observed for blood and immune cells. The red horizontal line corresponds to FDR = 0.05. d, Global GWAS enrichment in DNase I-hypersensitive sites (DHS) using GARFIELD. Radial lines show odds ratios at two genome-wide significance thresholds (T) for all DHS cells and tissues on the outer circle. Dots in the inner ring of the outer circle denote significant GARFIELD enrichments for T < 1.0 × 10⁻⁵ (outermost) and T < 1.0 × 10⁻⁸ (innermost) loci by a two-sided enrichment test after multiple-testing correction for the number of effective annotations. Similar to FUN-LDA, GWAS results are most enriched in DHS sites in blood and immune cells, and intestinal mucosal tissue (labeled). ES cell, embryonic stem cell; iPS cell, induced pluripotent stem cell.
Fig. 4 ∣
Fig. 4 ∣. Functional annotations of non-HLA loci.
a, Cis-eQTL effects in primary immune cells. The x axis shows 15 immune cell types (DICE project). The y axis shows significant eGene–eSNP pairs with shared loci depicted by a color bar. Two-sided eQTL P values without multiple testing correction were used for a color scale. Posterior probability for a shared causal variant (PP4) is shown for the eQTL effects that colocalize at PP4 > 0.50. An asterisk indicates eGenes with blood cis-eQTLs. b, pQTL (protein quantitative trait loci) effects in blood. IgAN risk alleles or their proxies (yellow nodes) with significant blood pQTLs depicted by blue (reduced protein levels) and red (increased protein levels) nodes. Edge thickness corresponds to the LD between the lead GWAS and pQTL SNPs at a given locus. c, Protein–protein interaction network for candidate genes at GWAS loci. Modules represent genes that are more connected to one another than they are to other genes. Each of the following modules exhibits a functional enrichment network based on GO biological processes: module 1 (orange) represents response to stress and defense response networks; module 2 (light blue) represents regulation of inflammatory response network; module 3 (red) represents mRNA splicing via spliceosome network; module 4 (green) represents chemokine-mediated signaling pathway; module 5 (purple) represents an immune response network; module 6 (pink) represents cytokine-mediated signaling pathway; module 7 (dark blue) represents regulation of I-κB kinase/ NF-κB signaling and apoptotic signaling pathway; and module 8 (yellow) represents innate immune response in mucosa and antibacterial humoral response. The gray module has no functional enrichment. d, Intersection with TF ChIP–seq peaks with the significant (top) and suggestive (bottom) IgAN risk loci. The x axis shows IgAN risk loci. The y axis shows top significant TFs ranked by the number of intersecting loci. A colored box at the intersection indicates that a given locus has at least one IgAN-associated variant located within a ChIP–seq peak for the given TF. Datasets were considered significant if their RELI empirical P values corrected for multiple testing were <1 × 10⁻⁴. TFs binding to EBNA2 super-enhancers are colored in red; ChIP–seq dataset cell types are indicated in parentheses. Related cell lines for a given TF (for example, GM12878 and GM12891) were merged for clarity. I-κB, inhibitor of nuclear factor kappa B.
Fig. 5 ∣
Fig. 5 ∣. Prioritization of candidate genes at non-HLA loci.
Blue boxes indicate prioritization criteria based on genomic coordinates (the nearest gene to the index SNP, exonic variant in LD with the top SNP or top signal intersecting chromatin interaction site with the gene promoter). Red boxes indicate the presence of additional functional criteria (any GTEx eQTL effect, blood and immune cell eQTL colocalization, pQTL effects, PPI network connectivity, shared mouse knockout phenotype, shared pathways by MAGMA, prioritized by DEPICT and prioritized by manual PubMed review). The priority score represents a sum of the 13 scoring criteria depicted in blue and red. The genes with the maximum score at each locus (light green) were defined as ‘biological candidate genes’. V2G scores are also provided for comparison. Additional annotation indicates drug-target genes (orange). Only 58 of 311 positional candidate genes with a priority score >3 (or top V2G score per locus) are depicted.
Fig. 6 ∣
Fig. 6 ∣. Drug targets among candidate causal genes.
IgAN risk alleles (green), prioritized positional candidate genes (gray), related genes in PPI (for example, ligands/receptors) or same pathway (yellow), targeting drugs approved or currently in clinical trials including agonists and antagonists (blue) and diseases targeted by these drugs (orange). High-priority targets defined in Fig. 5 are indicated by an asterisk. GWAS loci with candidate causal genes not targeted by existing drugs are not depicted.
Fig. 7 ∣
Fig. 7 ∣. Clinical associations of the GPS for IgAN.
a, Survival analysis of lifetime risk of kidney failure for IgAN cases in the top 90th percentile of the GPS distribution (n = 2,879 cases with follow-up data). The x axis shows age starting from 18 years, and the y axis shows survival probability without kidney failure with the number of participants at risk at each age cut-off of 20, 40, 60 and 80 years depicted below. HR (95% CI) of kidney failure adjusted for sex, site and ancestry; two-sided P value from the adjusted Cox proportional hazards model is also provided. b,c, PheWAS for the GPS with (b) or without (c) the HLA region, based on joint meta-analysis of eMERGE-III (n = 102,138) and UKBB (n = 488,377) datasets. The x axis indicates electronic health record phenotypes (phecodes) grouped by system and sorted by significance. The y axis indicates the level of statistical significance expressed as −log10(P value). All P values are two-sided and correspond to a fixed effects meta-analysis of both datasets without correction for multiple testing. Dashed horizontal line represents the significance threshold after Bonferroni correction for the number of phenotypes; significant associations are labeled. An upward triangle indicates a positive association (increased risk) and a downward triangle indicates a negative association (decreased risk) with increasing GPS.

Comment in

Similar articles

Cited by

References

    1. Feehally J. et al. HLA has strongest association with IgA nephropathy in genome-wide analysis. J. Am. Soc. Nephrol 21, 1791–1797 (2010). - PMC - PubMed
    1. Gharavi AG et al. Genome-wide association study identifies susceptibility loci for IgA nephropathy. Nat. Genet 43, 321–327 (2011). - PMC - PubMed
    1. Kiryluk K. et al. Geographic differences in genetic susceptibility to IgA nephropathy: GWAS replication study and geospatial risk analysis. PLoS Genet. 8, e1002765 (2012). - PMC - PubMed
    1. Kiryluk K. et al. Discovery of new risk loci for IgA nephropathy implicates genes involved in immunity against intestinal pathogens. Nat. Genet 46, 1187–1196 (2014). - PMC - PubMed
    1. Yu XQ et al. A genome-wide association study in Han Chinese identifies multiple susceptibility loci for IgA nephropathy. Nat. Genet 44, 178–182 (2012). - PubMed

Publication types

MeSH terms

Substances

LinkOut - more resources