. 2023 Jul;5(7):1204-1220.
doi: 10.1038/s42255-023-00825-8. Epub 2023 Jun 19.

Quantitative analysis of metabolic fluxes in brown fat and skeletal muscle during thermogenesis

Affiliations

Quantitative analysis of metabolic fluxes in brown fat and skeletal muscle during thermogenesis

Grace Park et al. Nat Metab. 2023 Jul.

Abstract

Adaptive thermogenesis by brown adipose tissue (BAT) dissipates calories as heat, making it an attractive anti-obesity target. Yet how BAT contributes to circulating metabolite exchange remains unclear. Here, we quantified metabolite exchange in BAT and skeletal muscle by arteriovenous metabolomics during cold exposure in fed male mice. This identified unexpected metabolites consumed, released and shared between organs. Quantitative analysis of tissue fluxes showed that glucose and lactate provide ~85% of carbon for adaptive thermogenesis and that cold and CL316,243 trigger markedly divergent fuel utilization profiles. In cold adaptation, BAT also dramatically increases nitrogen uptake by net consuming amino acids, except glutamine. Isotope tracing and functional studies suggest glutamine catabolism concurrent with synthesis via glutamine synthetase, which avoids ammonia buildup and boosts fuel oxidation. These data underscore the ability of BAT to function as a glucose and amino acid sink and provide a quantitative and comprehensive landscape of BAT fuel utilization to guide translational studies.


Conflict of interest statement

Competing interests: The authors declare no competing interests.

Figures

Extended Data Figure 1.
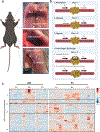
Extended Data Figure 1.. Establishment of AV metabolomics for BAT and hind limb in mice.
a, Schematic of blood vessels used for AV sampling. The Sulzer’s vein (SV) and femoral vein (FV) were used to characterize BAT and hind limb activity. Systemic arterial blood was collected from the left ventricle (LV). Made with BioRender.com. b, Different biological scenarios reflected by AV gradients across BAT. Positive and negative values indicate net release and absorption, while net zero values indicate metabolite bypass (neither uptake nor release). intracellular futile cycling (release equal to uptake) or intercellular cross-exchange between adipocytes and non-adipocytes. c, Heat map shows different metabolite abundances between LV, SV and FV blood collected from mice adapted to mild (22°C) or severe cold (6°C). Box 1 highlights metabolites more abundant in BAT-draining blood (SV) than blood from other sites, regardless of temperature, boxes 2–3 highlight metabolites more abundant in BAT-draining blood (SV) or systemic arterial blood (LV) and temperature-sensitive, and box 4 highlights metabolites sensitive to temperature across organs. Each column shows an individual mouse.
Extended Data Figure 2.
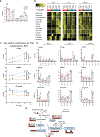
Extended Data Figure 2.. Characterization of BAT in TN, CC, AC, and CL.
a, Daily food intake of TN and CC adapted mice. Data are mean ± s.e. ****p=3×10⁻¹² by unpaired two-tailed Student’s t-test. b, Final body weight of TN, CC, AC, CL treated mice. Data are mean ± s.e. **p=0.001 and p=0.009 by one-way ANOVA with Tukey’s multiple comparisons test. c, Western blot of key markers in BAT from mice in TN, CC, AC, and CL. S.E., short exposure; L.E., long exposure. d, H&E images of BAT from mice in TN, CC, AC, and CL. Scale bar = 50 um.
Extended Data Figure 3.
Extended Data Figure 3.. AV concentration gradients of the 35 primary fuel metabolites.
Median values from mice in Figures 1–3 are shown.
Extended Data Figure 4.
Extended Data Figure 4.. Quantitative analysis of BAT total carbon and nitrogen influx and efflux in TN and CL.
Colors indicate different metabolite categories. Metabolites are ordered based on their relative contributions from greatest to least. Fatty acids from lipoprotein particles are indicated as “LIPID” after each fatty acid species (e.g., C16:0 LIPID).
Extended Data Figure 5.
Extended Data Figure 5.. Temperature-dependent glutamine carbon usage by BAT and liver.
a, Glutamine fractional labeling (both carbon and nitrogen) at 5 min after tracer administration in BAT for TN, MC and CC. Data are mean ± s.e. N=6 mice per temperature condition. b, Heatmap shows median of the total 13C-labeled carbons in metabolites in BAT, liver and serum for TN, MC and CC, scaled for each metabolite and organ. N=6 mice for TN, N=6 mice for MC, N=7 mice for CC at 2.5 min, N=6 mice for all temperature conditions at 5 min, N=6 mice for TN, N=6 mice for MC, N=5 mice for CC at 15 min for BAT, and N=6 mice for all temperature conditions at 15 min for liver and serum. c, Total normalized labeling fraction of carbon atoms in representative TCA intermediates in BAT. Data are mean ± s.e. ****p<0.0001 by two-way ANOVA with post-hoc Tukey HSD Test. Malate MC vs TN **p=0.0021, Succinate CC vs TN ***p=0.0002 and MC vs TN **p=0.0027. N=6 mice for TN, N=6 mice for MC, N=7 mice for CC at 2.5 min, N=6 mice for all temperature conditions at 5 min, N=6 mice for TN, N=6 mice for MC, N=5 mice for CC at 15 min. d, Normalized carbon labeling fraction of representative TCA intermediates at 5 min after tracer administration. Data are mean ± s.e. N=6 mice per temperature condition. e, Schematic of TCA cycle labeling from glutamine. Conventional TCA cycle predicts M+4 labeling of succinate, malate, and citrate from glutamine tracer, whereas reversed TCA cycle (i.e., reductive carboxylation) predicts M+5 labeling of citrate. PC flux can also generate M+5 citrate with labeled CO2 incorporation. Citrate can be used for de novo lipogenesis. Made with BioRender.com.
Extended Data Figure 6.
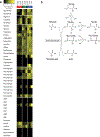
Extended Data Figure 6.. Temperature-dependent glutamine nitrogen usage by BAT.
a, Heatmap shows median of total 15N-labeled nitrogen in BAT metabolites for TN, MC and CC. N=6 mice for TN, N=6 mice for MC, N=7 mice for CC at 2.5 min, N=6 mice for all temperature conditions at 5 min, N=6 mice for TN, N=6 mice for MC, N=5 mice for CC at 15 min. b, Schematic of nitrogen exchange reactions between glutamine, glutamate and keto acids. Made with BioRender.com.
Extended Data Figure 7.
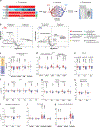
Extended Data Figure 7.. Cold-induced glutamine synthetase in BAT.
a, qRT-PCR comparing Glul gene expression in BAT for TN and CC. N=8 mice per condition. Data are mean ± s.e. ***p=0.0003 by unpaired two-tailed Student’s t-test. b, Western blot of GS in brown adipocytes during adipogenesis. c, Western blot of GS in different tissues from mice at 22°C. iB, interscapular BAT; sB, subcutaneous BAT; iW, inguinal white fat; pW, perigonadal white fat; LV, liver; Q, quadricep; S, spleen; H, heart; Lu, lung; B, brain; K, kidney. d-g,15N1-labeled glutamine and glutamate abundances in liver (d,e) or serum (f,g) after 15N-ammonia tracer administration. N=5 mice were used for each time point except TN 15-minute and CC 5-minute N=4 mice were used. Data are mean ± s.e. h, Full graph of oxygen consumption rate in mature brown adipocytes transfected with control or Glul targeting siRNAs with or without norepinephrine (NE) stimulation. N=15 biological replicates. Data are mean ± s.e.
Fig. 1
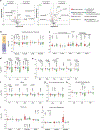
Fig. 1. Arterio-venous (AV) metabolomics reveals broadly altered metabolic activities of BAT in cold-adapted mice.
a, Experimental scheme of AV metabolomics under thermoneutral (TN), chronic cold (CC) adaptation, acute cold (AC) exposure, and CL-316,243 (CL) injection conditions. Made with BioRender.com. b, CC-adapted BAT absorbs a variety of circulating metabolites. Volcano plots show changes in BAT’s metabolite uptake and release in TN and CC. Different colors indicate metabolite categories. MC, medium-chain; SC, short-chain; PC, phosphatidylcholine; PI, phosphatidylinositol. c-k, BAT’s uptake and release of the 35 abundant and high flux-carrying circulating fuel metabolites, categorized by the indicated groups. The data shows log2 V/A ratios. Individual data points represent each mouse. N=19 mice for TN and N=18 mice for CC. Data are mean ± s.e. P-values (vertical) compared to a null value (zero exchange) by 1-tailed one sample t-test. P-values (horizontal) compared to TN by two-paired Student’s t-test. LCFA, long-chain fatty acids, BCAA; branched-chain amino acids, EAA; essential amino acids, NEAA; non-essential amino acids.
Fig 2.
Fig 2.. Acute cold challenge is only partially replicated by pharmacological β-adrenergic receptor activation.
a, Volcano plots show changes in BAT’s metabolite uptake and release in AC and CL. Different colors indicate metabolite categories. b-j, BAT’s uptake and release of the 35 abundant and high flux-carrying circulating fuel metabolites, categorized by the indicated groups. The data shows log2 V/A ratios. Individual data points represent each mouse. N=19 mice for TN and N=14 mice for AC and CL. Data are mean ± s.e. P-values (vertical) compared to null value (zero exchange) by 1-tailed one sample t-test. P-values (horizontal) for group differences determined via one-tailed ANOVA with Tukey’s HSD.
Fig. 3.
Fig. 3.. The landscape of leg metabolic activities under various thermogenic conditions.
a-d, Volcano plots show changes in leg metabolite uptake and release across TN, CC, AC and CL conditions. Different colors indicate metabolite categories. PE, phosphatidylethanolamine; GSSG, glutathione disulfide. e-m, Leg uptake and release of the 35 abundant and high flux-carrying circulating fuel metabolites, categorized by the indicated groups. The data shows log2 V/A ratios. Individual data points represent each mouse. N=20 mice for TN, N=16 mice for CC, N=14 mice for AC, and N=13 mice for CL. Data are mean ± s.e. P-values (vertical) compared to a null value (zero exchange) by 1-tailed one sample t-test. P-values (horizontal) for group differences determined via one-tailed ANOVA with Tukey’s HSD.
Fig 4.
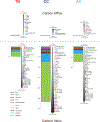
Fig 4.. Quantitative analysis of BAT carbon influx and efflux.
Colors indicate different metabolite categories. Metabolites are ordered based on their relative contributions from greatest to least. Fatty acids from lipoprotein particles are indicated as “LIPID” after each fatty acid species (e.g., C16:0 LIPID).
Fig 5
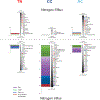
Fig 5. Quantitative analysis of BAT nitrogen influx and efflux.
Colors indicate different metabolite categories. Metabolites are ordered based on their relative contributions from greatest to least.
Fig. 6.
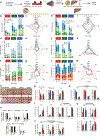
Fig. 6.. Distinct usage of glutamine nitrogen by BAT and liver at different temperatures.
a, Schematic of in vivo glutamine tracing experiment. Made with BioRender.com. b-m, Various usage of glutamine nitrogen in BAT (b-g) versus liver (h-m) in TN, MC and CC. Bar graphs show the concentration of 15N-labeled metabolites at each time point, with the most abundant metabolites shown on the top. Spider plots show area under-curve. N=6 mice for TN, N=6 mice for MC, N=7 mice CC at 2.5 min, N=6 mice for all temperature conditions at 5 min, N=6 mice for TN, N=6 mice for MC, N=5 mice for CC at 15 min. Data are mean ± s.e. n, Schematic depicting various scenarios of metabolite production from glutamine in BAT versus liver and their exchange via circulation. Made with BioRender.com. o, Comparison of fractional labeling between BAT, liver, and serum informs the production site of the labeled metabolites, with higher labeling in a certain tissue than blood reflecting its generation by the tissue. Made with BioRender.com. p-t, Means indicate 95% confidence interval for fold changes of average AUC of tissue fractional labeling versus serum. Error bars indicate 95% CI calculated with bootstrapping utilizing 10,000 simulations. N=18 mice for TN, N=18 mice for MC, N=18 mice for CC.
Fig. 7.
Fig. 7.. Cold-induced glutamine synthetase facilitates fuel oxidation in BAT by scavenging ammonia.
a. Schematic of glutamine synthesis and catabolism. Made with BioRender.com. b, Heatmap of nitrogen metabolism genes with FDR values less than 3% scaled for each gene. c-d, Western blots show induction of GS in CC only in BAT (c) but not in liver (d). e, Schematic of in vivo ammonia tracing experiment. Made with BioRender.com. f-h, 15N1-labeled glutamine (f) and glutamate (g) abundances in BAT from mice in TN versus CC and labeling fractions of 15N-labeled Gln and Glu isotopomers in BAT from mice in CC (h). N=5 mice were used for each time point except TN 15-minute and CC 5-minute N=4 mice were used (f-h). Data are mean ± s.e. TIC, total ion count. i, Western blots show mature brown adipocytes transfected with siRNA non-target (siNT) or targeting Glul (siGlul). j-k, 15N1-labeled glutamine fractional labeling after 15N-NH4Cl tracer (j) or 15N2-Gln tracer (k) in mature brown adipocytes transfected with siNT or siGlul. Tracers were administered for 6 hours. N=3 biological replicates. Data are mean ± s.e. ****p=7×10⁻⁶ (j) and ****p=6×10⁻⁶ (k) by unpaired two-tailed Student’s t-test. l, Oxygen consumption rates (OCR) of mature brown adipocytes transfected with siNT or siGlul. N=15 biological replicates. Data are mean ± s.e. ****p=2×10⁻⁹ by unpaired two-tailed Student’s t-test. m, Ammonia levels in the culture media of mature brown adipocytes transfected with siNT or siGlul. N=6 biological replicates. Data are mean ± s.e. ****p=8×10⁻⁶ by unpaired two-tailed Student’s t-test.

References

    1. Cannon B & Nedergaard J Brown adipose tissue: function and physiological significance. Physiol Rev 84, 277–359, doi:10.1152/physrev.00015.2003 (2004). - DOI - PubMed
    1. Rothwell NJ & Stock MJ A role for brown adipose tissue in diet-induced thermogenesis. Nature 281, 31–35, doi:10.1038/281031a0 (1979). - DOI - PubMed
    1. Feldmann HM, Golozoubova V, Cannon B & Nedergaard J UCP1 ablation induces obesity and abolishes diet-induced thermogenesis in mice exempt from thermal stress by living at thermoneutrality. Cell metabolism 9, 203–209, doi:10.1016/j.cmet.2008.12.014 (2009). - DOI - PubMed
    1. von Essen G, Lindsund E, Cannon B & Nedergaard J Adaptive facultative diet-induced thermogenesis in wild-type but not in UCP1-ablated mice. Am J Physiol Endocrinol Metab 313, E515–E527, doi:10.1152/ajpendo.00097.2017 (2017). - DOI - PubMed
    1. Hung CM et al. Rictor/mTORC2 loss in the Myf5 lineage reprograms brown fat metabolism and protects mice against obesity and metabolic disease. Cell Rep 8, 256–271, doi:10.1016/j.celrep.2014.06.007 (2014). - DOI - PMC - PubMed

Publication types