. 2023 Jun;5(6):996-1013.
doi: 10.1038/s42255-023-00820-z. Epub 2023 Jun 19.

Adipogenic and SWAT cells separate from a common progenitor in human brown and white adipose depots

Affiliations

Adipogenic and SWAT cells separate from a common progenitor in human brown and white adipose depots

Nagendra P Palani et al. Nat Metab. 2023 Jun.

Abstract

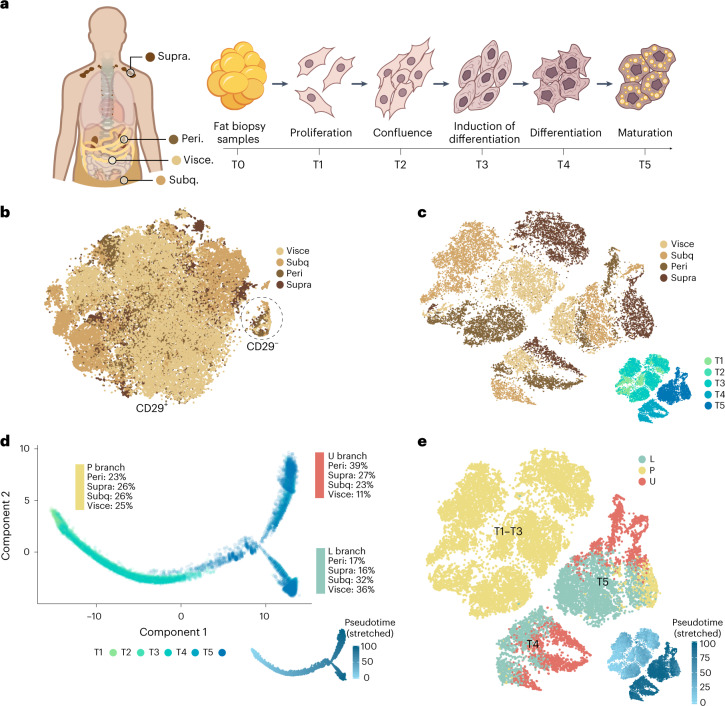
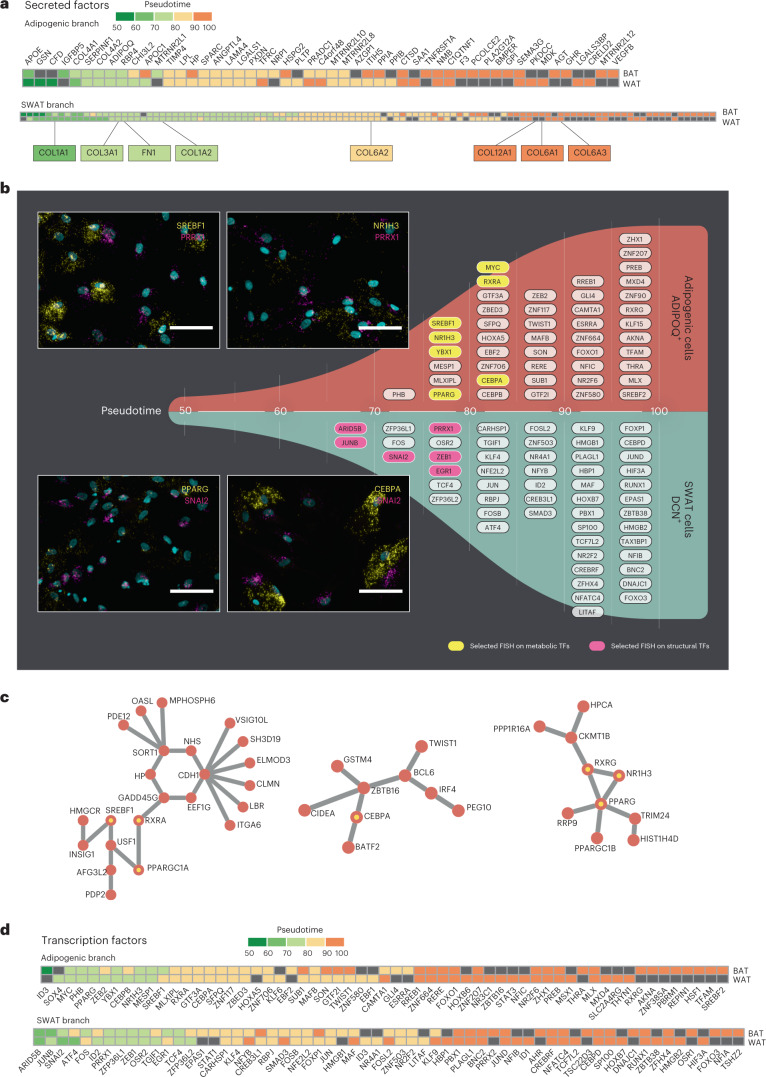
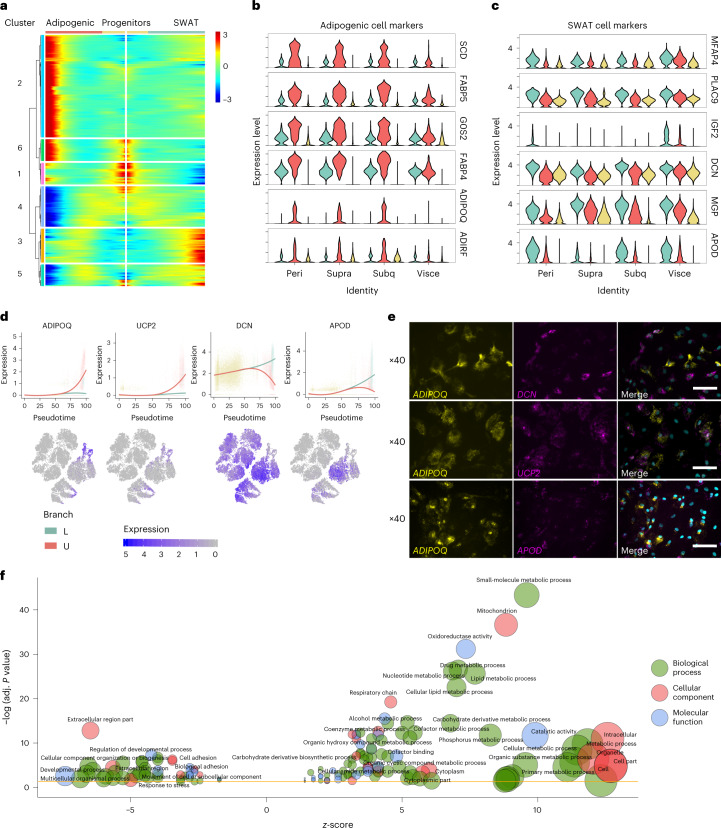
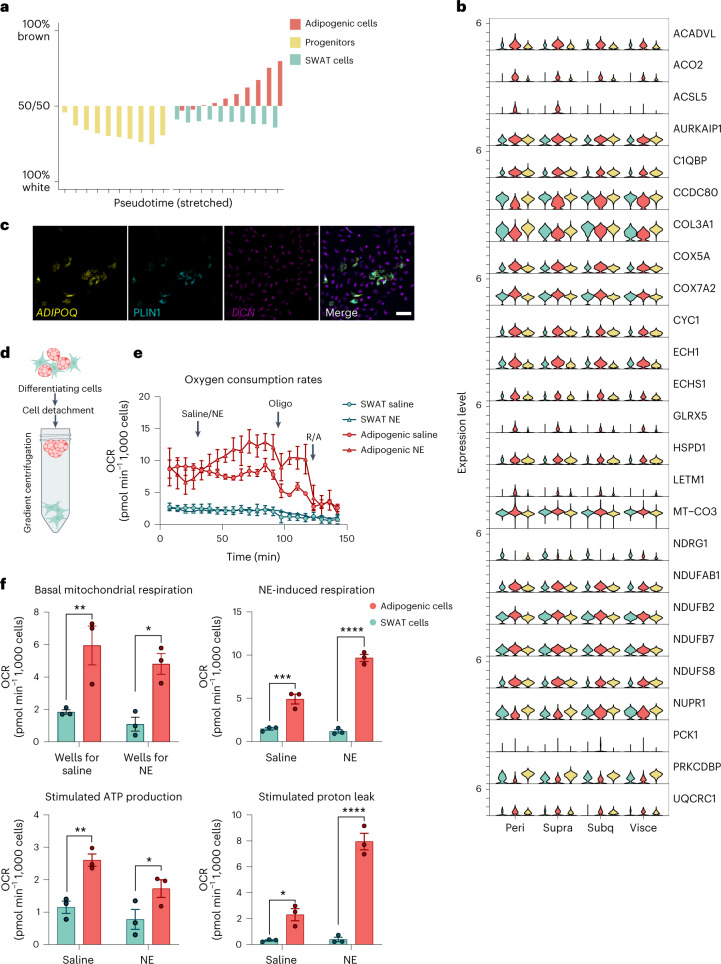
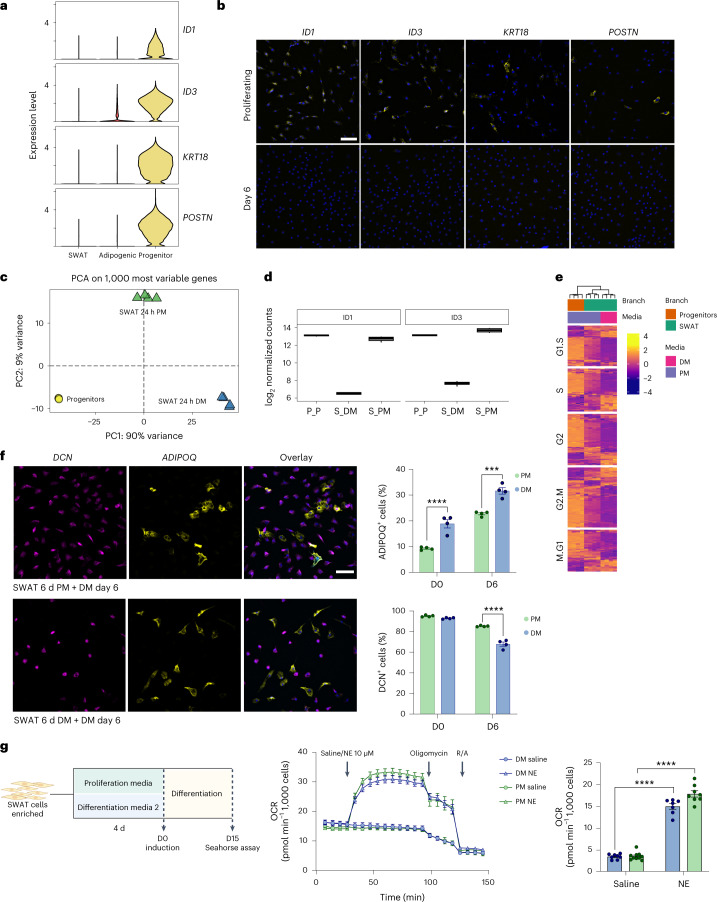
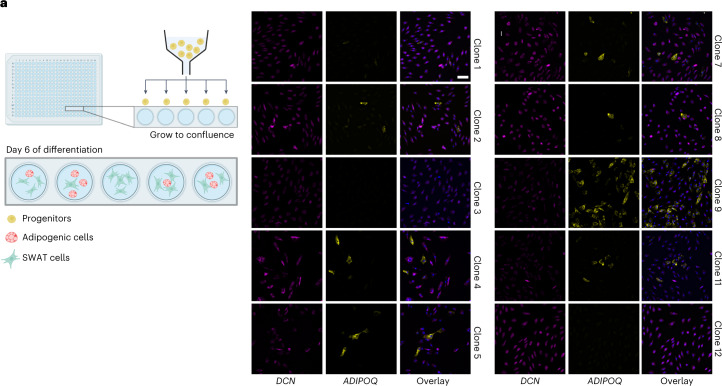
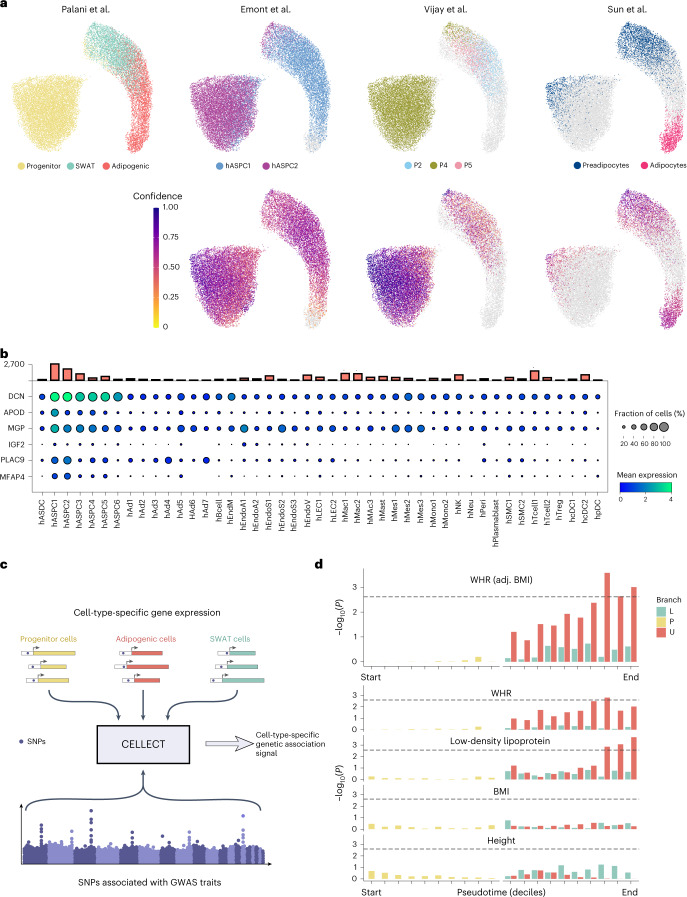
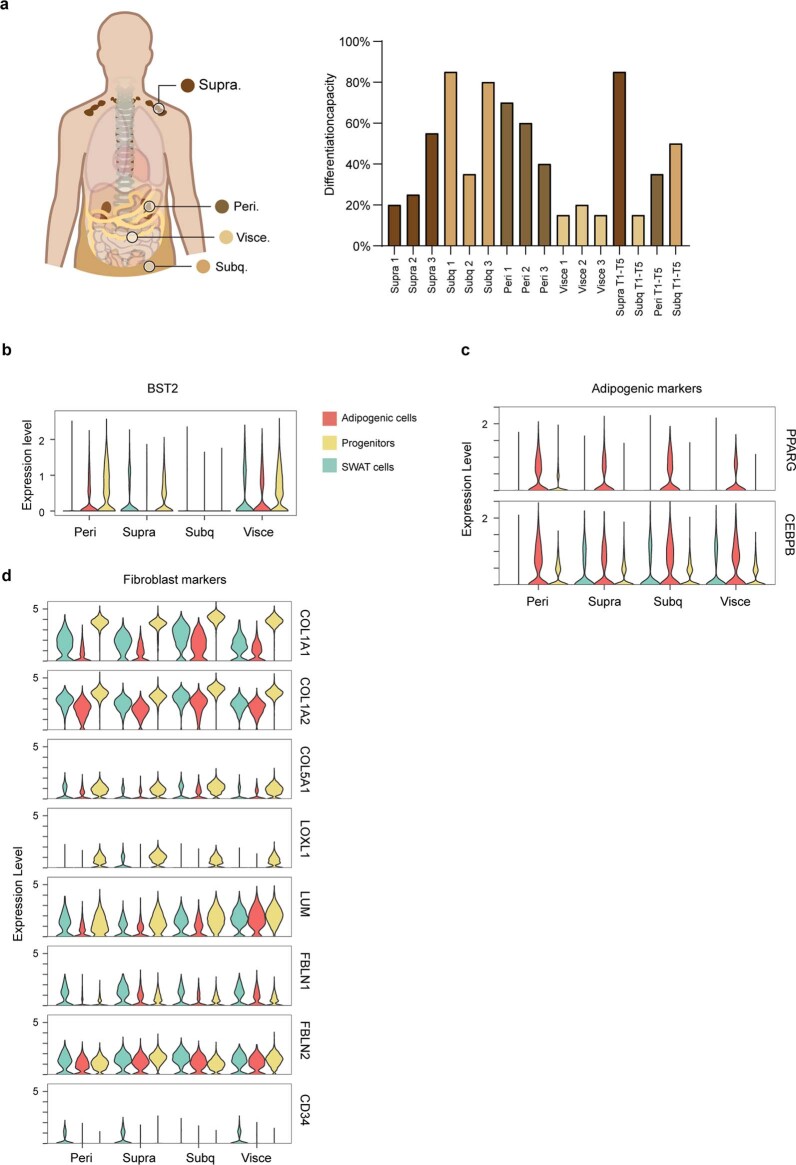
Adipocyte function is a major determinant of metabolic disease, warranting investigations of regulating mechanisms. We show at single-cell resolution that progenitor cells from four human brown and white adipose depots separate into two main cell fates, an adipogenic and a structural branch, developing from a common progenitor. The adipogenic gene signature contains mitochondrial activity genes, and associates with genome-wide association study traits for fat distribution. Based on an extracellular matrix and developmental gene signature, we name the structural branch of cells structural Wnt-regulated adipose tissue-resident (SWAT) cells. When stripped from adipogenic cells, SWAT cells display a multipotent phenotype by reverting towards progenitor state or differentiating into new adipogenic cells, dependent on media. Label transfer algorithms recapitulate the cell types in human adipose tissue datasets. In conclusion, we provide a differentiation map of human adipocytes and define the multipotent SWAT cell, providing a new perspective on adipose tissue regulation.


Conflict of interest statement

The authors declare no competing interests.

Figures

Fig. 1
Fig. 1. Single-cell trajectory analysis of developing adipocyte progenitors.
Human adipocyte progenitors isolated from tissue biopsies of four adipose depots were collected at five time points (T1–T5) during in vitro differentiation and subsequent single-cell analysis was performed using the 10x Genomics platform. a, Overview of adipose depots and cellular developmental stages. b, t-SNE atlas generated using the Seurat alignment algorithm, analysing proliferating adipocyte progenitors (T1) derived from 11 individuals. Peri, perirenal; subq, subcutaneous; supra, supraclavicular; visce, visceral. c, t-SNE atlas of developing adipocyte progenitors (T1–T5) of four adipose depots from different individuals. The inset indicates the collection time point. Clustering analysis grouped T1–T3 samples by adipose depot and T4 and T5 samples by time point and adipose depot. d, Monocle pseudotime trajectory of adipocyte progenitors from T1–T5. Cells from T1–T3 align in a common progenitor (P) branch. Following induction of differentiation, the P branch split into an upper (U) and a lower (L) branch, thus containing cells from T4 and T5. Cells from all depots are represented in the U and L branches (the percentage of cells from each depot is indicated for each branch). The inset shows the trajectory coloured by stretched pseudotime that quantitatively measures how far an adipocyte progenitor has progressed through development. Stretched pseudotime is a normalized pseudotime scale ranging from 0 (least progressed) to 100 (most progressed). e, Cell atlas coloured by trajectory branch identities. The inset shows the cellular development as measured by pseudotime.
Fig. 2
Fig. 2. Adipocyte progenitors develop into adipogenic and SWAT cells.
a, Adipogenic and SWAT branch-specific expression patterns of predicted secreted proteins, separated by origin from brown (supraclavicular + perirenal) and white (subcutaneous + visceral) depots. The SWAT branch is characterized by branch-specific expression of extracellular matrix components. The black box indicates no divergence in gene expression between branches. b, Transcription factors identified as increasing in expression in one branch over another are indicated on respective branches, at the stretched pseudotime point where the smoothed gene expression is observed to diverge. Inset images are from RNA FISH labelling in brown adipocytes of selected combinations of branch-specific transcription factors. Scale bar, 75 µm. c, Scellnetor analysis identified key transcriptional networks enriched in the adipogenic branch, confirming the role of several transcription factors identified above as involved in adipogenic cell-type development. d, Branch-specific transcription factor analysis performed independently for brown (perirenal + supraclavicular) and white (visceral + subcutaneous) depots. Colour scale indicates pseudotime point at which expression of a gene diverges between branches, and the black box indicates no divergence in gene expression between branches. A shared set of transcription factors characterize early differentiation across depots, whereas further differentiation proceeds through depot-specific transcription factors. TF, transcription factor.
Fig. 3
Fig. 3. Gene cluster signatures defining adipogenic and SWAT cell branches.
a, BEAM analysis identified six kinetic clusters of branch-dependent genes. b, Violin plots of adipogenic marker genes from cluster 2, showing gene expression in branches across depots. c, SWAT cell marker genes from cluster 3, showing gene expression in branches across depots. d, Expression dynamics are displayed as a function of pseudotime (stretched, ranging from 0 to 100) of marker genes for the U branch (ADIPOQ, UCP2) and the L branch (DCN, APOD). Solid lines show smoothed expression curves for each branch. e, FISH staining of human brown adipocytes collected at T5 (halfway through full maturation) using RNAscope probes for branch marker genes. Scale bar, 75 µm. f, GO term enrichment analysis visualized using REViGO and the GOplot R package.
Fig. 4
Fig. 4. Mitochondrial signature and oxidative capacity of adipogenic compared to SWAT cells.
a, Predicted brown and white adipocyte content in pseudotime trajectories using BATLAS. Cells are grouped by each developmental branch and pseudotime decile. b, BATLAS genes overlapping with this work’s scRNA-seq dataset, expressed in branches across depot origins. c, Adipogenic cells contain lipid droplets as indicated by immunofluorescence staining of differentiating adipocytes for perilipin (green) combined with FISH RNAscope for DCN (magenta) and ADIPOQ (yellow). Nuclei in blue. Scale bar, 100 μm. d, Illustration demonstrating density gradient centrifugation to enrich adipogenic and SWAT cells from heterogeneous cultures. Created with BioRender.com. e, Seahorse extracellular flux analysis of enriched adipogenic and SWAT cells separated on day 10 of differentiation. Oxygen consumption rates (OCRs) were measured 24 h after plating in DM (5,000 cells per well) and normalized to cell count. N = 3 biologically independent cell samples, cultured separately in parallel for 24 h following density gradient centrifugation between SWAT and adipogenic cells. f, Calculations of the data visualized in e. Two-way analysis of variance (ANOVA) was used to assess differences between cell types and NE treatment in: basal mitochondrial respiration (effect of cell type P = 0.0006; effect of NE: P = 0.222), NE-stimulated mitochondrial respiration (effect of cell type P = 0.0003; effect of NE: P < 0.0001), stimulated ATP production (effect of cell type: P = 0.0012; effect of NE: P = 0.3310) and stimulated proton leak (effect of cell type: P < 0.0001; effect of NE: P = 0.0001). N = 3 biologically independent cell samples, cultured separately in parallel for 24 h following density gradient centrifugation between SWAT and adipogenic cells. Sidak’s post hoc test was used for comparisons between cell types, and significance values are shown in the graphs *P < 0.05, **P < 0.01, ***P < 0.001, ****P < 0.0001. Data are presented as the mean ± s.e.m. NE, noradrenaline; oligo, oligomycin; R, rotenone; A, antimycin; DM, differentiation medium 2.
Fig. 5
Fig. 5. Multipotency of SWAT cells.
a, Progenitor marker gene expression across branches in scRNA-seq data. b, FISH RNAscope staining validating the expression of selected progenitor markers (yellow) in proliferating brown progenitor cells but not in differentiating cells (day 6). Nuclei in blue. Scale bar, 100 µm. c, PCA of bulk RNA-seq samples based on the 1,000 most variable genes. d, RNA-seq normalized gene counts for selected progenitor markers across conditions. The centre of the box plot is the median of normalized gene expression from N = 4 replicates, expressed in log2 scale. The lower and upper hinges of the box plot are the first and third quartiles (25th and 75th percentiles), respectively. The whiskers extend from the lower/upper hinges to the smallest/largest values less than 1.5 times the interquartile range (distance between 1st and 3rd quartiles). N = 4 biologically independent samples, derived from four separate heterogeneous cell cultures, separated with four individual density gradients and subsequently cultured separately. e, Heat map of cell cycle gene expression across conditions, split by cell cycle phase. f, Enriched brown SWAT cells on day 12 of differentiation were seeded until they reached sub-confluence in either PM or DM for 6 d and then induced for differentiation. FISH staining confirmed the development of adipogenic (yellow) and SWAT (magenta) cells in both cultures. Nuclei in blue. Scale bar, 100 µm. Two-way ANOVA was used to assess the effects of differentiation in the two groups cultured in different media before differentiation. Top, quantification of ADIPOQ-positive cells (effect of differentiation: P < 0.0001; effect of cell culture media: P < 0.0001). Bottom, quantification of DCN-positive cells (effect of differentiation: P < 0.0001; effect of cell culture media: P = 0.0001). N = 4 biologically independent cell samples, cultured separately in parallel for 24 h following density gradient centrifugation between SWAT and adipogenic cells. Sidak’s post hoc test was used for comparisons between cell types, and significance values are shown in the graphs *P < 0.05, **P < 0.01, ***P < 0.001, ****P < 0.0001. Data are presented as the mean ± s.e.m. g, Experimental outline to assess the functionality of brown adipogenic cells developed from differentiated SWAT cells seeded in PM or DM (left). Created with BioRender.com. Seahorse extracellular flux analysis (right). Oxygen consumption rates were normalized to cell count. N numbers are biologically independent cell samples, cultured and differentiated separately in parallel following density gradient centrifugation between SWAT and adipogenic cells. Left, N = 10 for PM-cultured samples. N = 8 for DM-cultured samples. Right, two PM-cultured samples and one DM-cultured sample stimulated with NE were excluded due to issues with oligomycin injections, resulting in N = 8 for PM and N = 7 for DM. Right, calculated stimulated proton leak. Two-way ANOVA analyses was used to assess the effects of NE in the two groups cultured in different cell culture media before differentiation (effect of NE: P < 0.0001; effect of cell culture media: P = 0.0051). Sidak’s post hoc test was used for comparisons between NE and saline treatment, and significance values are shown in the graphs *P < 0.05, **P < 0.01, ***P < 0.001, ****P < 0.0001. Data are presented as the mean ± s.e.m. DCN, decorin; ADIPOQ, adiponectin; PM, proliferation medium. Two-way ANOVA with Sidak’s post hoc test *P < 0.05, **P < 0.01, ***P < 0.001, ****P < 0.0001. Data are presented as the mean ± s.e.m.
Fig. 6
Fig. 6. FACS-based cloning of human adipose stem and progenitor cells.
a, Graphic illustration of single-cell-sorted progenitors with subsequent differentiation of the clonal populations. Created with BioRender.com. Clonal populations developed into adipogenic (yellow) and SWAT (magenta) cells as visualized with FISH RNAscope staining on day 6 of differentiation. Nuclei in blue. Scale bar, 100 µm.
Fig. 7
Fig. 7. Label transfer to human adipose tissue and genome-wide association study traits.
a, Uniform manifold approximation and projection dimensionality reduction scatterplots of cells from Palani et al., scRNA-seq (this work) mapped with labels transferred from reference datasets, as annotated in the figure, using Scanorama. Confidence scores are the probability of label assignment by k-nearest neighbours (kNN) classifier. b, Dot plot displaying the expression of top markers for SWAT cells in the ASPC subpopulations as defined. Bar plot on top indicates the number of cells associated with each cell-type annotation. c, CELLECT tool method. d, CELLECT analysis of progenitor, U (adipogenic) and L (SWAT) branch cells, binned by pseudotime deciles. Adipogenic cells with the highest pseudotime values showed significant association with WHR (adjusted to BMI) and low-density lipoprotein. Other traits did not reveal any association.
Extended Data Fig. 1
Extended Data Fig. 1. Characteristics of the cell cultures included in the scRNA seq experiments.
a) Differentiation capacity assessed by visual estimation of percentage of accumulated lipid droplets. b) Violin plots of BST2 gene expression divided among branches and based on depot origin. c) Violin plots of the adipogenic markers PPARG and CEBPB gene expression divided among branches and based on depot origin. d) Violin plots of multiple fibroblast markers gene expression divided among branches and based on depot origin.
Extended Data Fig. 2
Extended Data Fig. 2. Fluorescent in Situ Hybridization (FISH) of transcription factors branching in pseudotime.
Labelling of early timepoint mRNA markers defining the SWAT and adipogenic branch as annotated in Fig. 2. a) ADIPOQ (magenta) and MYC (yellow), representing the adipogenic branch, are co-localized in the same cell type. b) ADIPOQ (magenta) and CEBPA (yellow), representing the adipogenic branch, co-localized in the same cell type at day 6. c) JUNB (magenta) and CEBPA (yellow), represents the SWAT and adipogenic branch, respectively. FISH of the transcripts showed co-localization in the same cell type at day 6. d) ZEB1 (magenta) and ADIPOQ (yellow), represents the SWAT and adipogenic branch, respectively. FISH analysis supported the singe cell data showing expression in different cell types at day 6. e) DCN (magenta) and RXRA (yellow), represents the SWAT and adipogenic branch, respectively. FISH analysis partly supported the single cell data showing expression in different cell types at day 4. f) EGR1 (magenta) and ADIPOQ (yellow), represents the SWAT and adipogenic branch, respectively. FISH analysis supported the single cell data showing expression in different cell types at day 4. g) Positive and negative controls.
Extended Data Fig. 3
Extended Data Fig. 3. Enriched SWAT cells incubated 24 h and 48 h in proliferation media.
SWAT cells were seeded in proliferation media (PM) or Differentiation media 2 (DM) for 24 or 48 hours and co-stained for progenitor markers (ID1, ID3, POSTN, KRT18) in yellow, DCN (magenta) and ADIPOQ (cyan). Nuclei in blue. Scale bar = 100 μM.
Extended Data Fig. 4
Extended Data Fig. 4. Label transfer using scNym.
UMAP dimensionality reduction scatterplots of cells from Palani et al., scRNA-seq (this work) mapped with labels transferred from reference datasets, as annotated in the figure, using scNym.
Extended Data Fig. 5
Extended Data Fig. 5. SWAT markers in previously defined APSC subpopulations.
a) Violin plot displaying the expression of top markers for SWAT cells in the ASPC subpopulations as defined (10). Bar plots on top indicates the number of cells associated with each cell type annotation. b) Dot plot and c) Violin plot displaying the expression of top markers for SWAT cells in a BAT single nuclei data set as defined (46). Bar plots on top indicates the number of cells associated with each cell type annotation. d) Dot plot and e) Violin plot displaying the expression of top markers for SWAT cells in a stromal vascular fraction data set as defined (45). Bar plots on top indicates the number of cells associated with each cell type annotation.

Comment in

References

    1. Karpe F, Pinnick KE. Biology of upper-body and lower-body adipose tissue link to whole-body phenotypes. Nat. Rev. Endocrinol. 2014;11:90–100. doi: 10.1038/nrendo.2014.185. - DOI - PubMed
    1. Becher T, et al. Brown adipose tissue is associated with cardiometabolic health. Nat. Med. 2021;27:58–65. doi: 10.1038/s41591-020-1126-7. - DOI - PMC - PubMed
    1. Almalki SG, Agrawal DK. Key transcription factors in the differentiation of mesenchymal stem cells. Differentiation. 2016;92:41–51. doi: 10.1016/j.diff.2016.02.005. - DOI - PMC - PubMed
    1. Rauch A, et al. Osteogenesis depends on commissioning of a network of stem cell transcription factors that act as repressors of adipogenesis. Nat. Genet. 2019;51:716–727. doi: 10.1038/s41588-019-0359-1. - DOI - PubMed
    1. Fink T, et al. Adipose-derived stem cells from the brown bear (Ursus arctos) spontaneously undergo chondrogenic and osteogenic differentiation in vitro. Stem Cell Res. 2011;7:89–95. doi: 10.1016/j.scr.2011.03.003. - DOI - PubMed

Publication types