

A novel extrachromosomal circular DNA related genes signature for overall survival prediction in patients with ovarian cancer
- PMID: 37337170
- PMCID: PMC10278296
- DOI: 10.1186/s12920-023-01576-x
A novel extrachromosomal circular DNA related genes signature for overall survival prediction in patients with ovarian cancer
Abstract
Objective: Ovarian cancer (OV) has a high mortality rate all over the world, and extrachromosomal circular DNA (eccDNA) plays a key role in carcinogenesis. We wish to study more about the molecular structure of eccDNA in the UACC-1598-4 cell line and how its genes are associated with ovarian cancer prognosis.
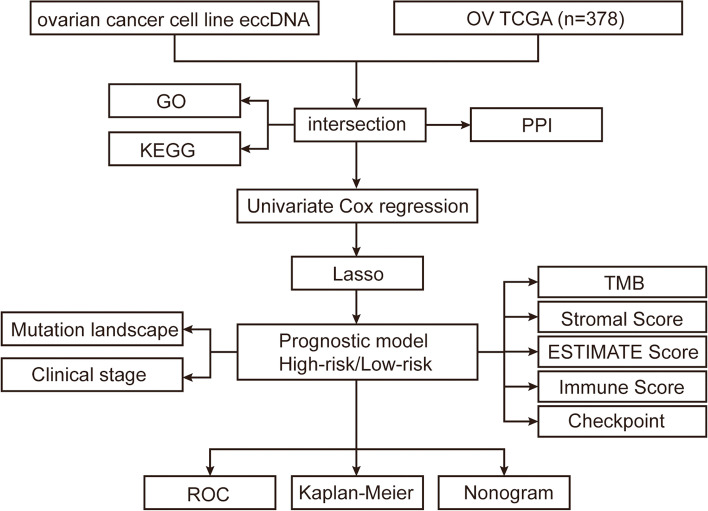
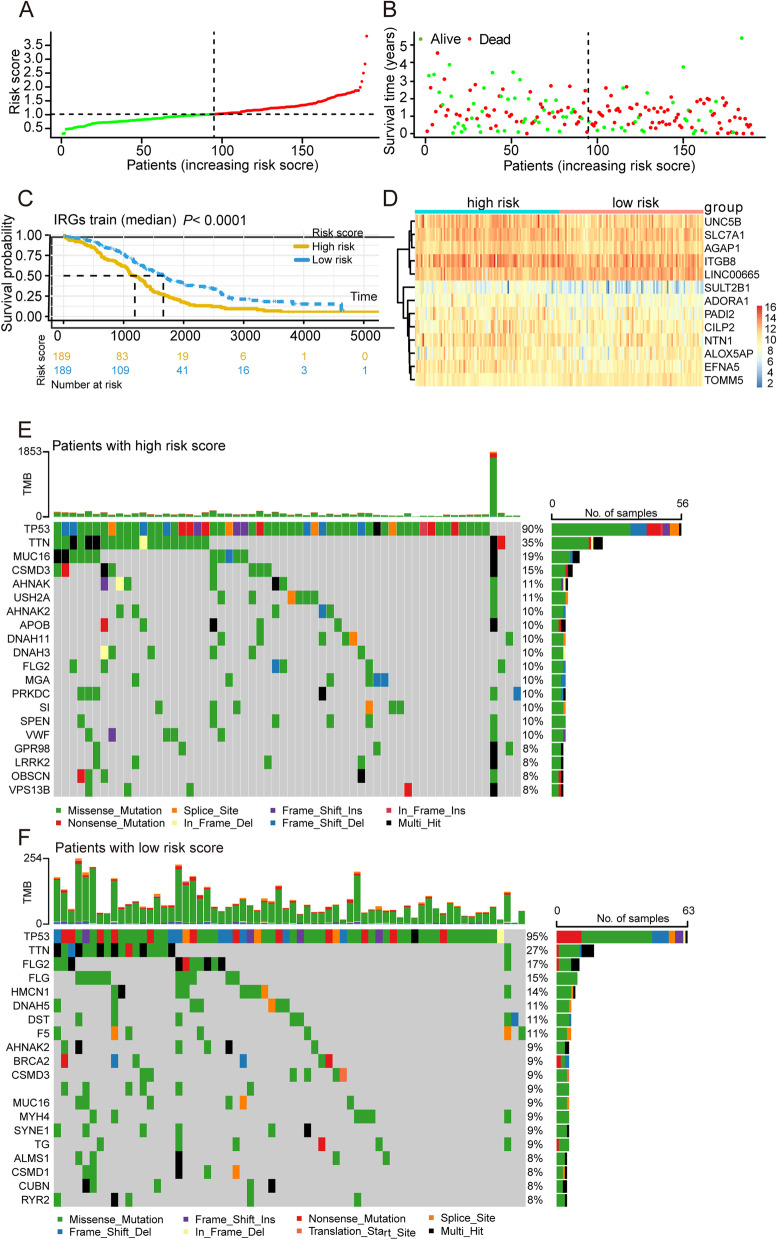
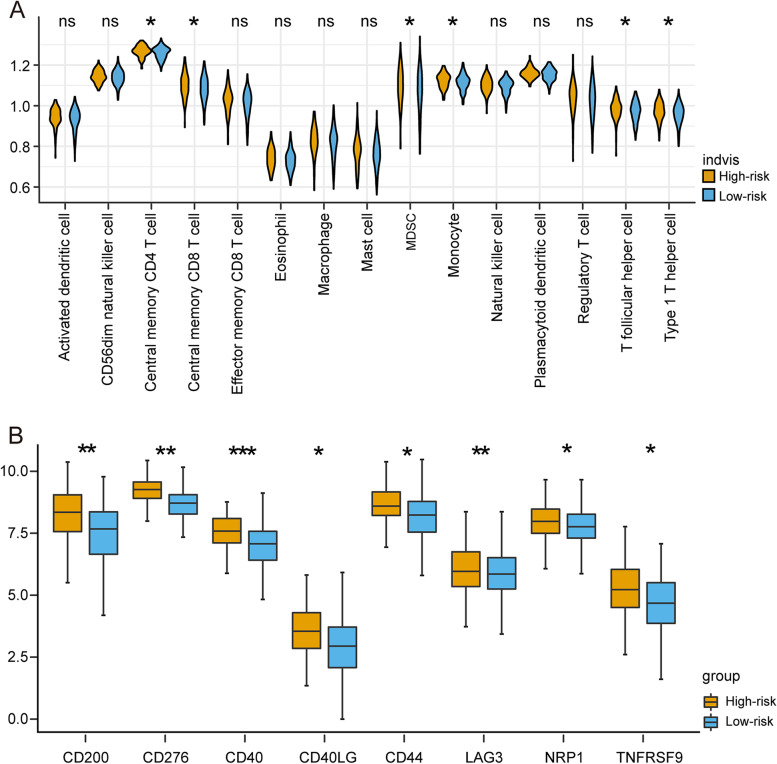
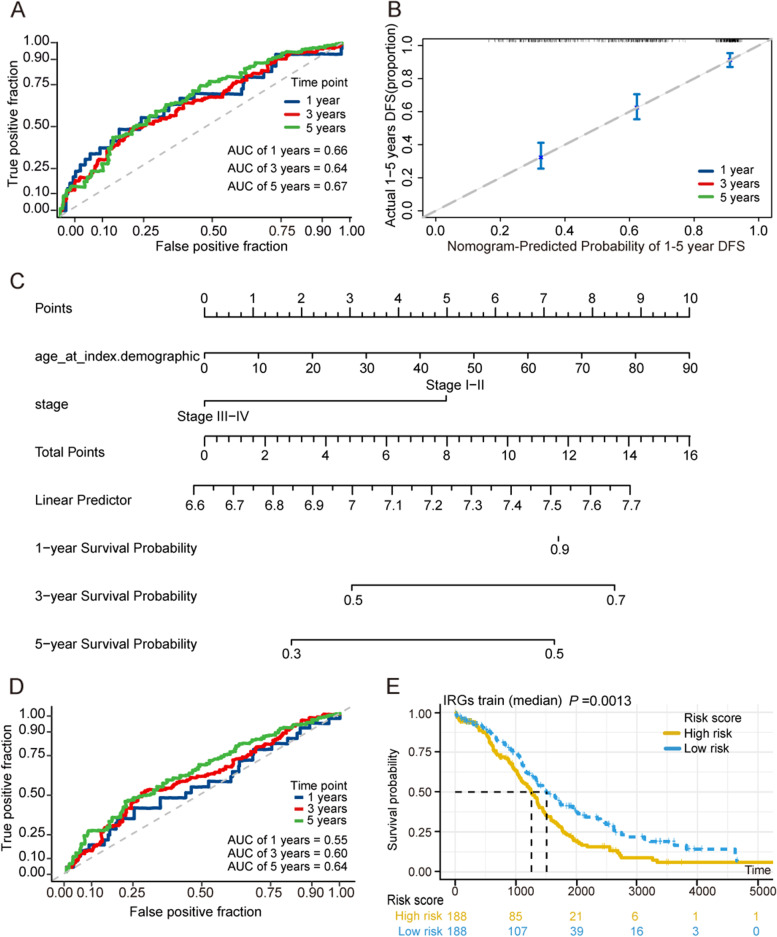
Methods: We sequenced and annotated the eccDNA by Circle_seq of the OV cell line UACC-1598-4. To acquire the amplified genes of OV on eccDNA, the annotated eccDNA genes were intersected with the overexpression genes of OV in TCGA. Univariate Cox regression was used to find the genes on eccDNA that were linked to OV prognosis. The least absolute shrinkage and selection operator (LASSO) and cox regression models were used to create the OV prognostic model, as well as the receiver operating characteristic curve (ROC) curve and nomogram of the prediction model. By applying the median value of the risk score, the samples were separated into high-risk and low-risk groups, and the differences in immune infiltration between the two groups were examined using ssGSEA.
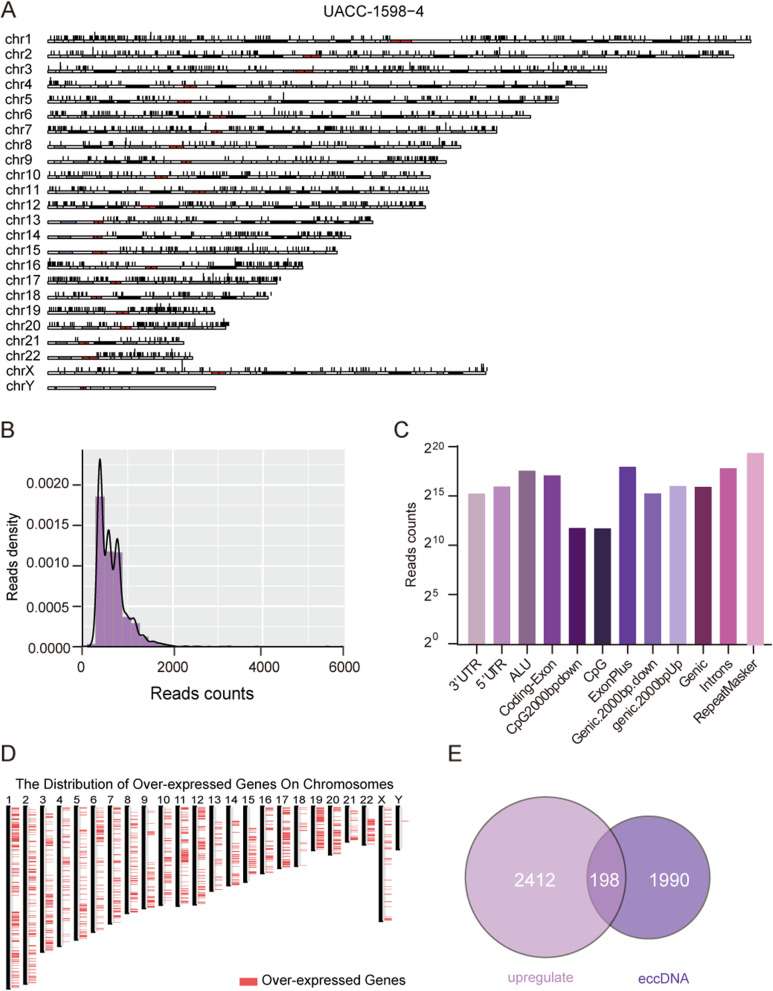
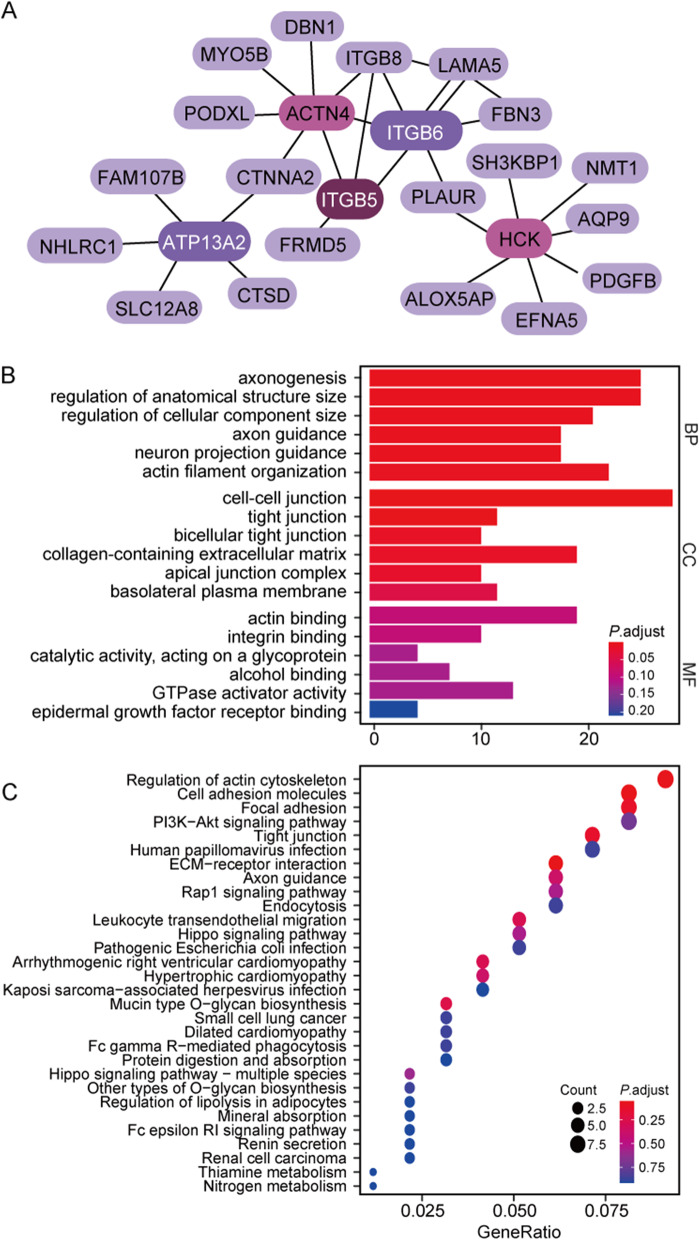
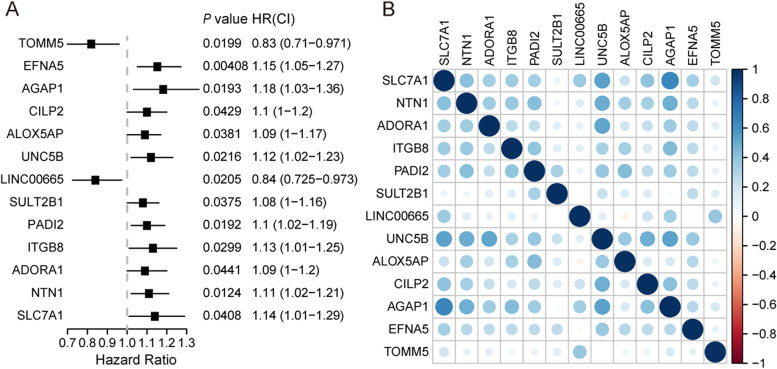
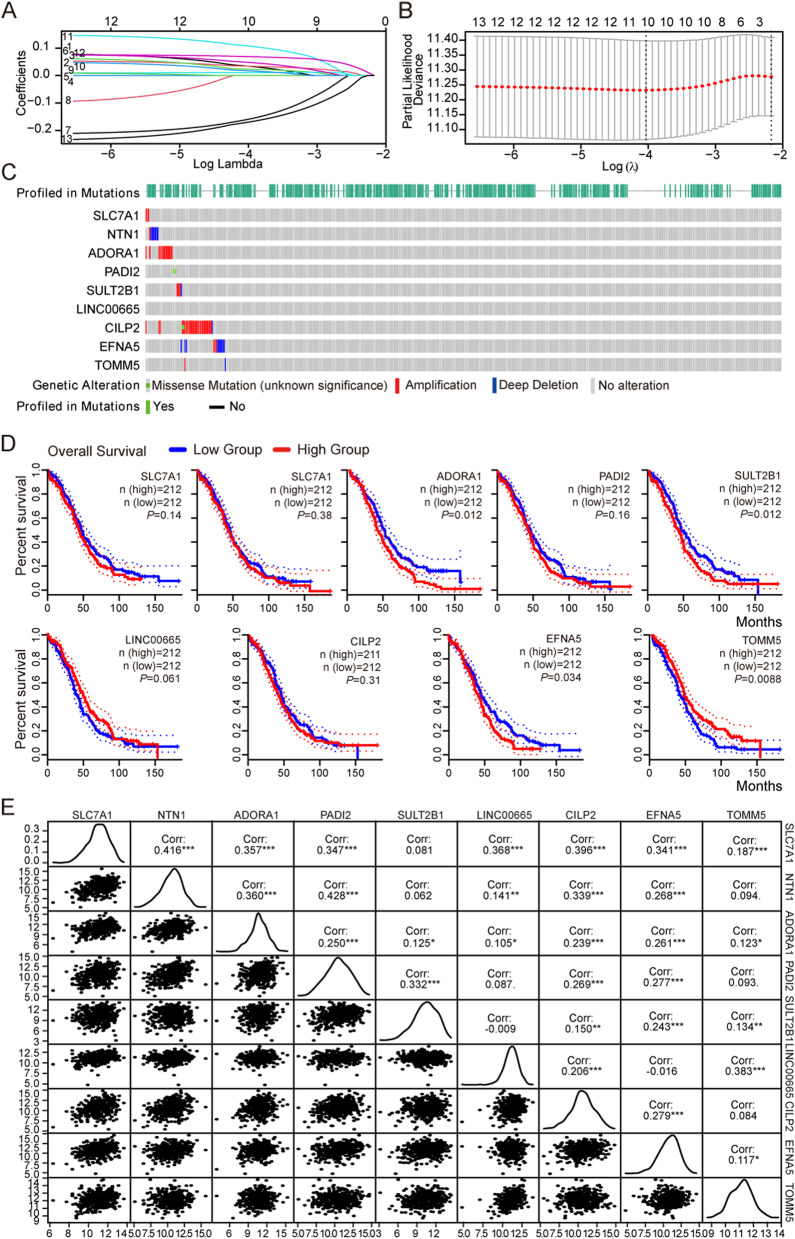
Results: EccDNA in UACC-1598-4 has a length of 0-2000 bp, and some of them include the whole genes or gene fragments. These eccDNA originated from various parts of chromosomes, especially enriched in repeatmasker, introns, and coding regions. They were annotated with 2188 genes by Circle_seq. Notably, the TCGA database revealed that a total of 198 of these eccDNA genes were overexpressed in OV (p < 0.05). They were mostly enriched in pathways associated with cell adhesion, ECM receptors, and actin cytoskeleton. Univariate Cox analysis showed 13 genes associated with OV prognosis. LASSO and Cox regression analysis were used to create a risk model based on remained 9 genes. In both the training (TCGA database) and validation (International Cancer Genome Consortium, ICGC) cohorts, a 9-gene signature could successfully discriminate high-risk individuals (all p < 0.01). Immune infiltration differed significantly between the high-risk and low-risk groups. The model's area under the ROC curve was 0.67, and a nomograph was created to assist clinician.
Conclusion: EccDNA is found in UACC-1598-4, and part of its genes linked to OV prognosis. Patients with OV may be efficiently evaluated using a prognostic model based on eccDNA genes, including SLC7A1, NTN1, ADORA1, PADI2, SULT2B1, LINC00665, CILP2, EFNA5, TOMM.
Keywords: Immune infiltration; Ovarian cancer; Prognostic model; TCGA; eccDNA.
© 2023. The Author(s).
Conflict of interest statement
TCGA belong to public databases. The patients involved in the database have obtained ethical approval. Users can download relevant data for free for research and publish relevant articles. Our study is based on open-source data, so there are no ethical issues and other conflicts of interest.
The authors declare no competing interests.
Figures
References
-
- Bradbury A, O'Donnell R, Drew Y, Curtin NJ, Sharma Saha S. Characterisation of Ovarian Cancer Cell Line NIH-OVCAR3 and Implications of Genomic, Transcriptomic, Proteomic and Functional DNA Damage Response Biomarkers for Therapeutic Targeting. Cancers. 2020;12(7):1939. doi: 10.3390/cancers12071939. - DOI - PMC - PubMed
-
- da Costa A, Baiocchi G. Genomic profiling of platinum-resistant ovarian cancer: The road into druggable targets. Semin Cancer Biol. 2021;77:29–41. - PubMed
-
- Ekmann-Gade AW, Hogdall CK, Seibaek L, Noer MC, Fago-Olsen CL, Schnack TH. Incidence, treatment, and survival trends in older versus younger women with epithelial ovarian cancer from 2005 to 2018: A nationwide Danish study. Gynecol Oncol. 2022;164(1):120–8. - PubMed
Publication types
MeSH terms
Substances
LinkOut - more resources
Full Text Sources
Medical
