

Detrimental alteration of mesenchymal stem cells by an articular inflammatory microenvironment results in deterioration of osteoarthritis
- PMID: 37337188
- PMCID: PMC10280917
- DOI: 10.1186/s12916-023-02923-6
Detrimental alteration of mesenchymal stem cells by an articular inflammatory microenvironment results in deterioration of osteoarthritis
Abstract
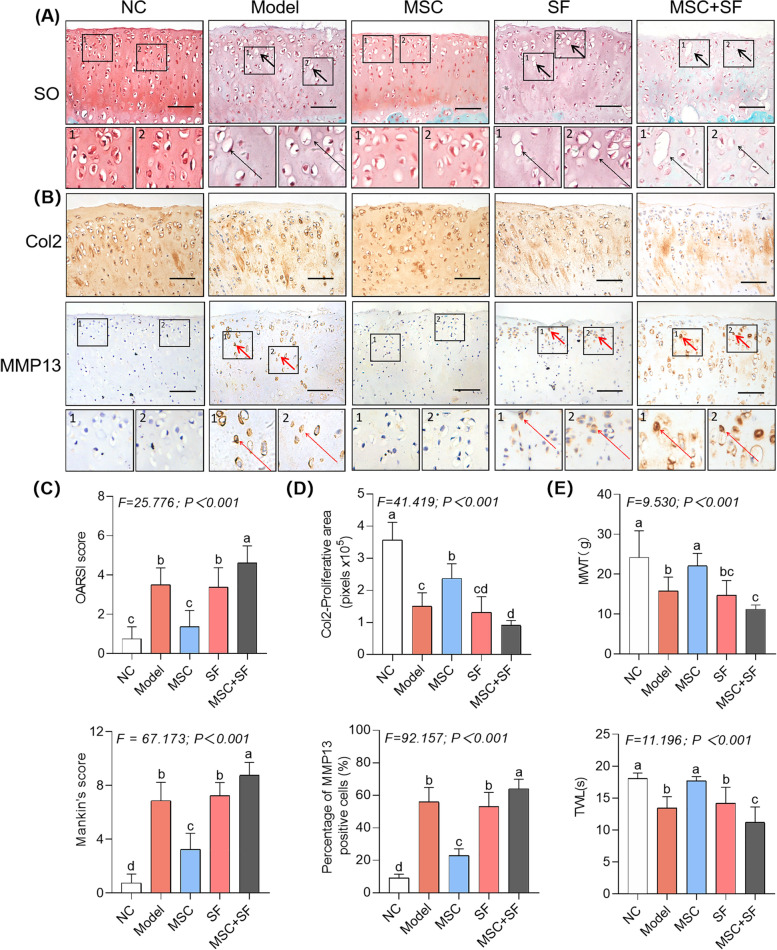
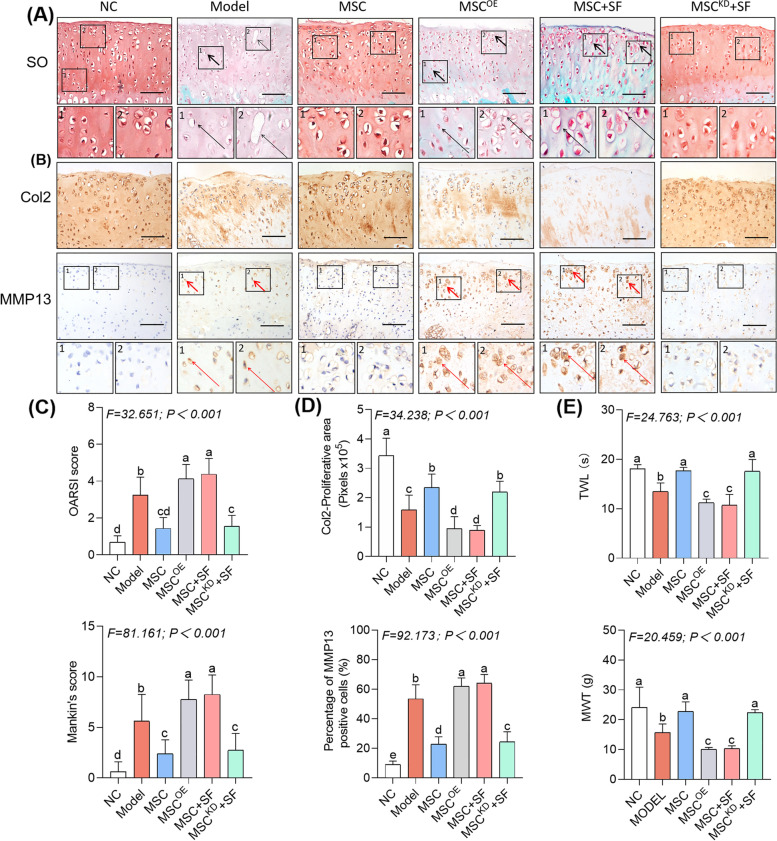
Background: Articular injection of mesenchymal stem cells (MSCs) has been applied to treat knee osteoarthritis (kOA), but its clinical outcomes are controversial. This study investigated whether an articular inflammatory microenvironment (AIM) impacts MSC-based therapy in a rat model of kOA.
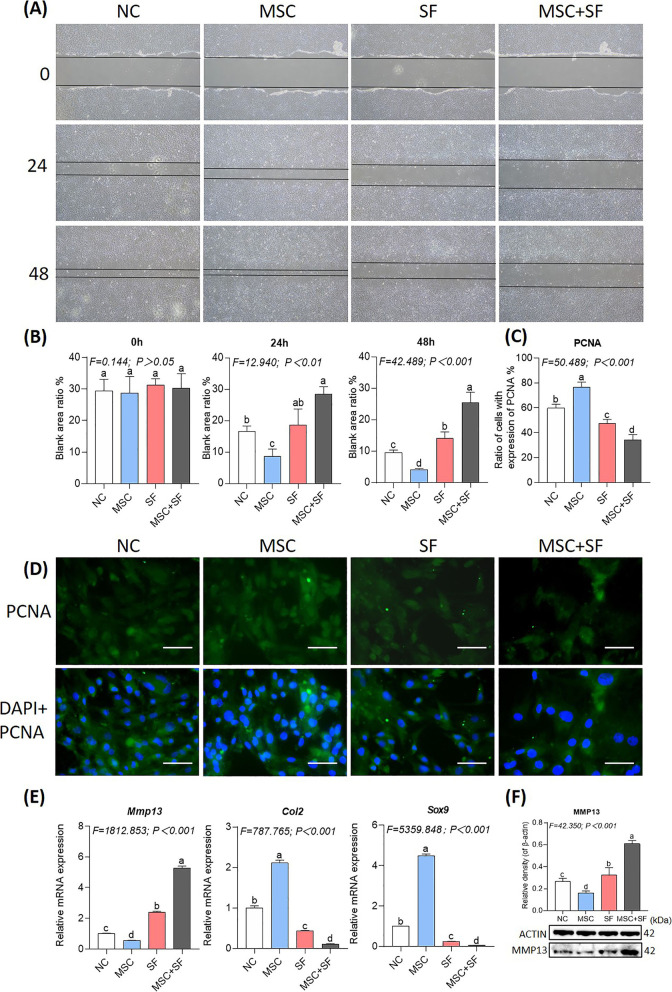
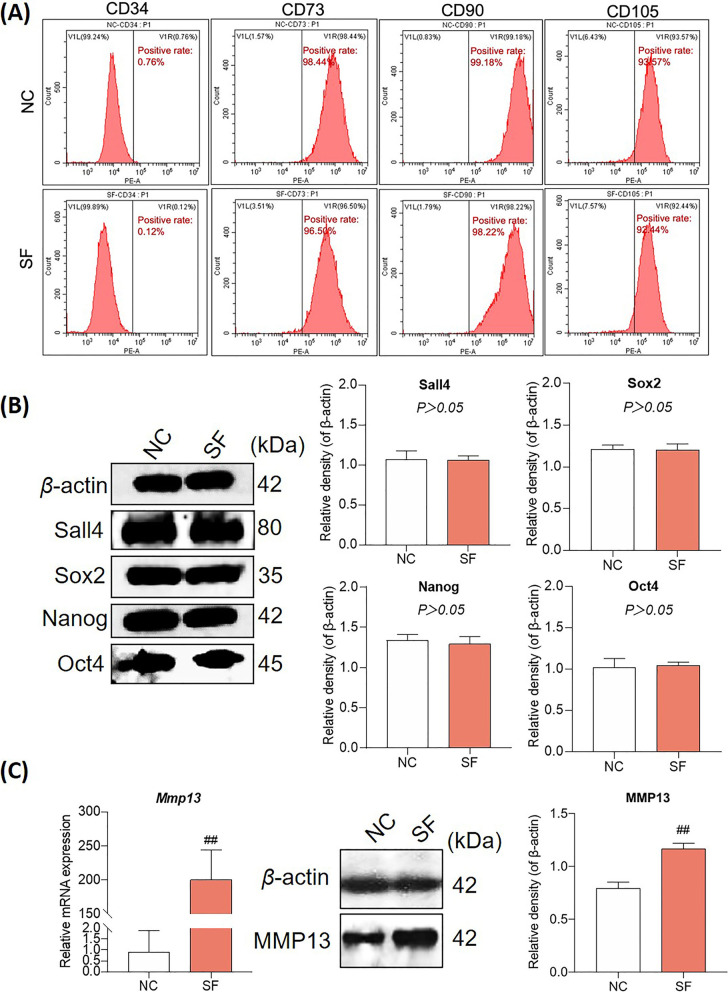
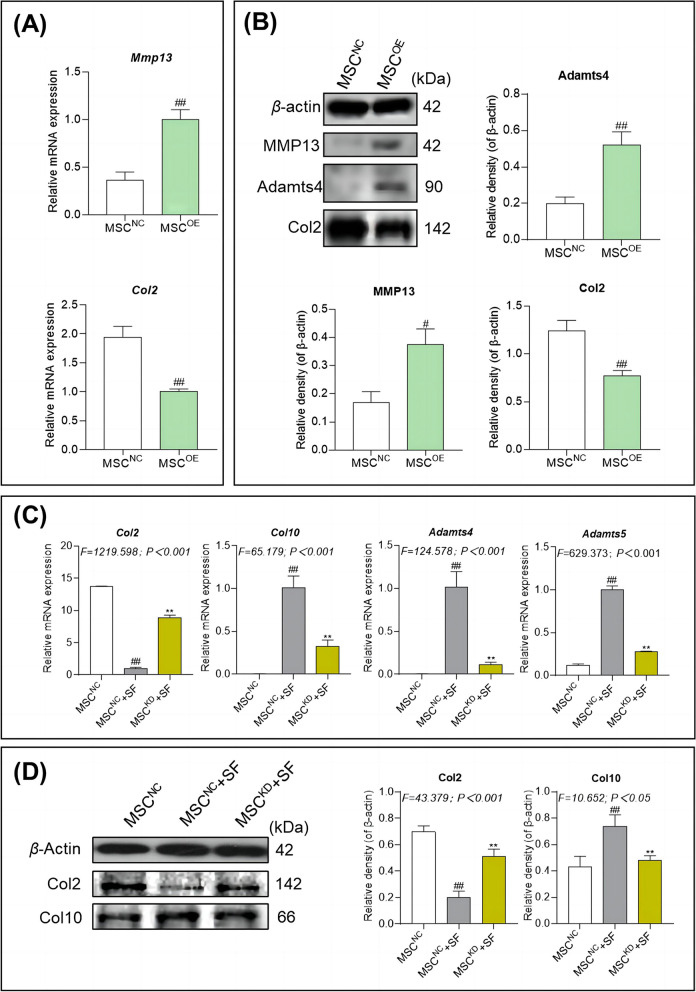
Methods: The biological change of MSCs and the functional change of MSCs on chondrocytes were evaluated under AIM. The key mediator and mechanism for the AIM impact on MSC therapy were explored via gain- and loss-of-function approaches.
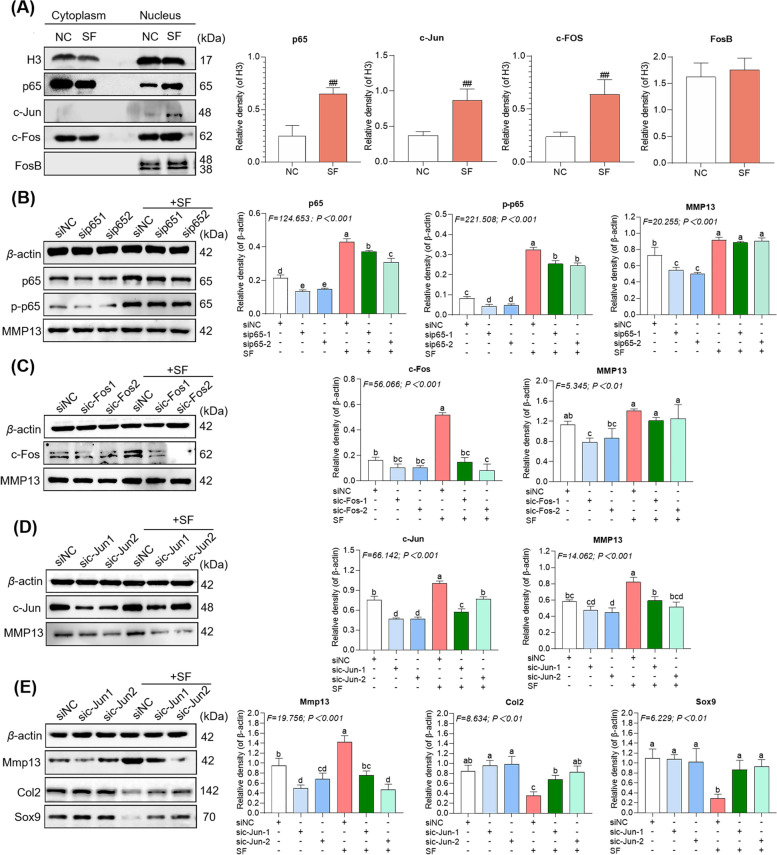
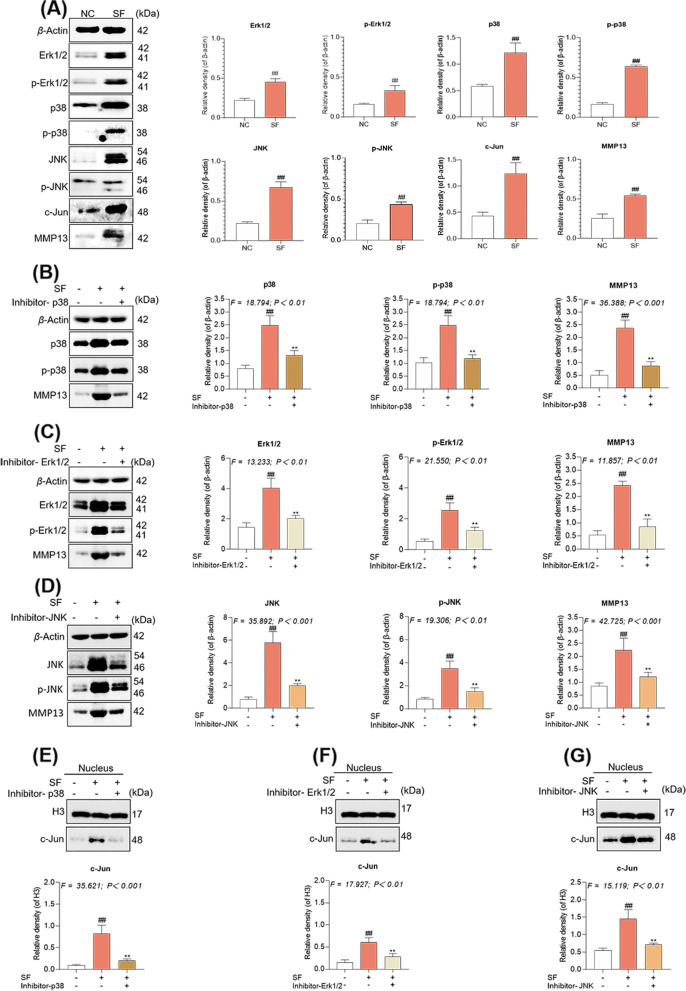
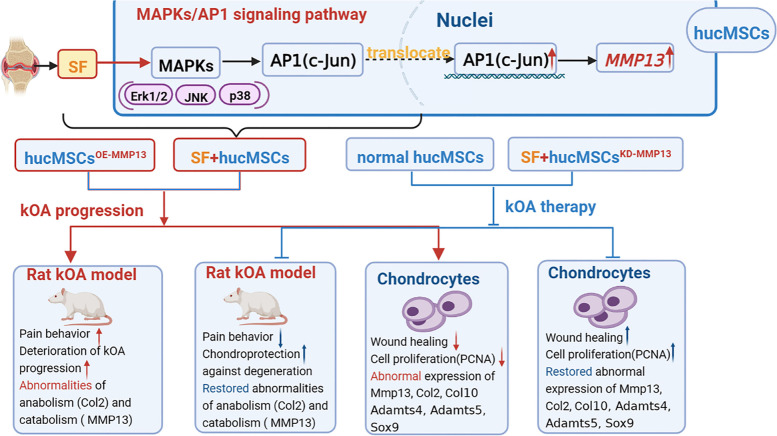
Results: The results showed that MSCs exerted potent anti-kOA effects in vivo and in vitro, but that this therapy become chondrodestructive if a chronic AIM was present. Mechanistically, the overexpression of MMP13 in the injected MSCs via a MAPKs-AP1 signaling axis was revealed as the underlying mechanism for the detriment outcome.
Conclusions: This study thus clarifies recent clinical findings while also suggesting a means to overcome any detrimental effects of MSC-based therapy while improving its efficacy.
Keywords: Articular inflammatory microenvironment; Human umbilical cord mesenchymal stem cells; Knee osteoarthritis; MAPKs; MMP13; Synovial fluid; c-Jun.
© 2023. The Author(s).
Conflict of interest statement
The authors declare that they have no competing interests.
Figures
Similar articles
-
Characteristics of MSCs in Synovial Fluid and Mode of Action of Intra-Articular Injections of Synovial MSCs in Knee Osteoarthritis.Int J Mol Sci. 2021 Mar 11;22(6):2838. doi: 10.3390/ijms22062838. Int J Mol Sci. 2021. PMID: 33799588 Free PMC article.
-
Intra-articular injection of mesenchymal stem cells in treating knee osteoarthritis: a systematic review of animal studies.Osteoarthritis Cartilage. 2018 Apr;26(4):445-461. doi: 10.1016/j.joca.2018.01.010. Epub 2018 Feb 8. Osteoarthritis Cartilage. 2018. PMID: 29427723
-
Intra-articular delivery of umbilical cord-derived mesenchymal stem cells temporarily retard the progression of osteoarthritis in a rat model.Int J Rheum Dis. 2020 Jun;23(6):778-787. doi: 10.1111/1756-185X.13834. Epub 2020 Apr 21. Int J Rheum Dis. 2020. PMID: 32319197
-
Intraarticular injection of bone marrow-derived mesenchymal stem cells enhances regeneration in knee osteoarthritis.Knee Surg Sports Traumatol Arthrosc. 2020 Dec;28(12):3827-3842. doi: 10.1007/s00167-020-05859-z. Epub 2020 Jan 31. Knee Surg Sports Traumatol Arthrosc. 2020. PMID: 32006075 Free PMC article. Review.
-
Intra-Articular Mesenchymal Stem Cell Injection for Knee Osteoarthritis: Mechanisms and Clinical Evidence.Int J Mol Sci. 2022 Dec 21;24(1):59. doi: 10.3390/ijms24010059. Int J Mol Sci. 2022. PMID: 36613502 Free PMC article. Review.
Cited by
-
Effects of Conditioned Media From Human Umbilical Cord-Derived Mesenchymal Stem Cells on Tenocytes From Degenerative Rotator Cuff Tears in an Interleukin 1β-Induced Tendinopathic Condition.Orthop J Sports Med. 2024 Nov 12;12(11):23259671241286412. doi: 10.1177/23259671241286412. eCollection 2024 Nov. Orthop J Sports Med. 2024. PMID: 39534392 Free PMC article.
-
Subchondral injection of human umbilical cord mesenchymal stem cells ameliorates knee osteoarthritis by inhibiting osteoblast apoptosis and TGF-beta activity.Stem Cell Res Ther. 2025 May 9;16(1):235. doi: 10.1186/s13287-025-04366-7. Stem Cell Res Ther. 2025. PMID: 40346614 Free PMC article.
-
Combination Hyaluronic Acid and Multipotent Stromal Cells Fails to Improve Rat Knee OA Outcomes Compared to Cells Alone.Orthop Res Rev. 2025 Jul 11;17:299-312. doi: 10.2147/ORR.S525292. eCollection 2025. Orthop Res Rev. 2025. PMID: 40666263 Free PMC article.
-
Roles of Microenvironment on Mesenchymal Stem Cells Therapy for Osteoarthritis.J Inflamm Res. 2024 Oct 3;17:7069-7079. doi: 10.2147/JIR.S475617. eCollection 2024. J Inflamm Res. 2024. PMID: 39377043 Free PMC article. Review.
-
Distribution and metabolism of iPSC-MSCs in the joint cavity of an osteoarthritis rat model.Front Bioeng Biotechnol. 2025 Jun 17;13:1555983. doi: 10.3389/fbioe.2025.1555983. eCollection 2025. Front Bioeng Biotechnol. 2025. PMID: 40599407 Free PMC article.
References
-
- Hunter DJ, Bierma-Zeinstra S. Osteoarthritis Lancet. 2019;393:1745–1759. - PubMed
Publication types
MeSH terms
LinkOut - more resources
Full Text Sources
Miscellaneous
