

Comparative phylogenetic analysis and transcriptomic profiling of Dengue (DENV-3 genotype I) outbreak in 2021 in Bangladesh
- PMID: 37337232
- PMCID: PMC10278332
- DOI: 10.1186/s12985-023-02030-1
Comparative phylogenetic analysis and transcriptomic profiling of Dengue (DENV-3 genotype I) outbreak in 2021 in Bangladesh
Erratum in
-
Correction to: Comparative phylogenetic analysis and transcriptomic profiling of dengue (DENV-3 genotype I) outbreak in 2021 in Bangladesh.Virol J. 2023 Aug 18;20(1):184. doi: 10.1186/s12985-023-02151-7. Virol J. 2023. PMID: 37596600 Free PMC article. No abstract available.
Abstract
Background: The next-generation sequencing (NGS) technology facilitates in-depth study of host-pathogen metatranscriptome. We, therefore, implicated phylodynamic and transcriptomic approaches through NGS technology to know/understand the dengue virus (DENV) origin and host response with dengue fever.
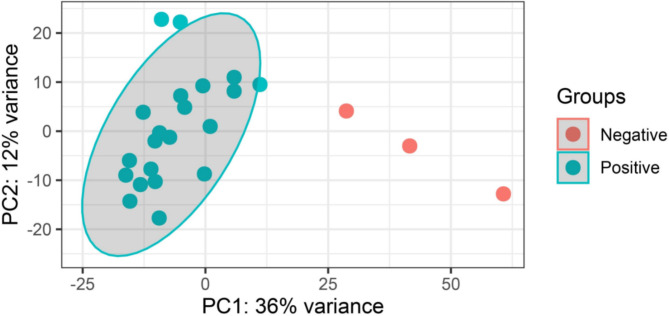
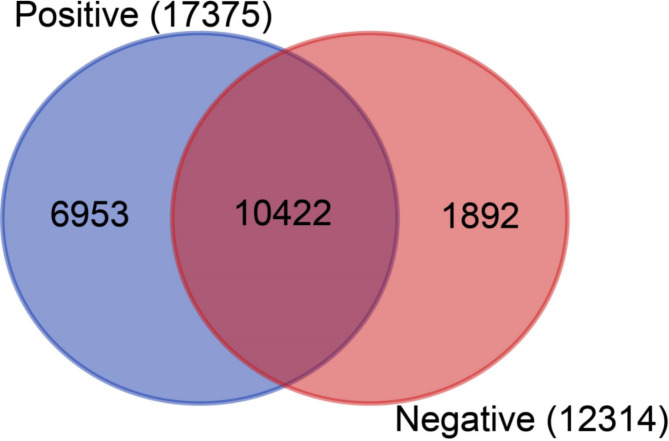
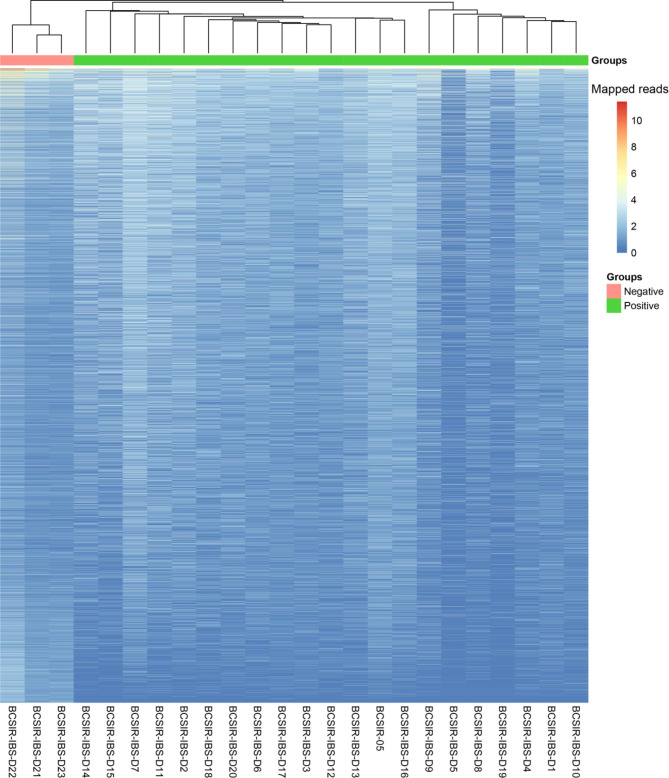
Methods: In this study, blood serum RNA was extracted from 21 dengue patients and 3 healthy individuals. Total transcriptomic data were analyzed for phylogenetic, phylodynamic, differential express gene (DEG), and gene ontology (GO) using respective bioinformatics tools.
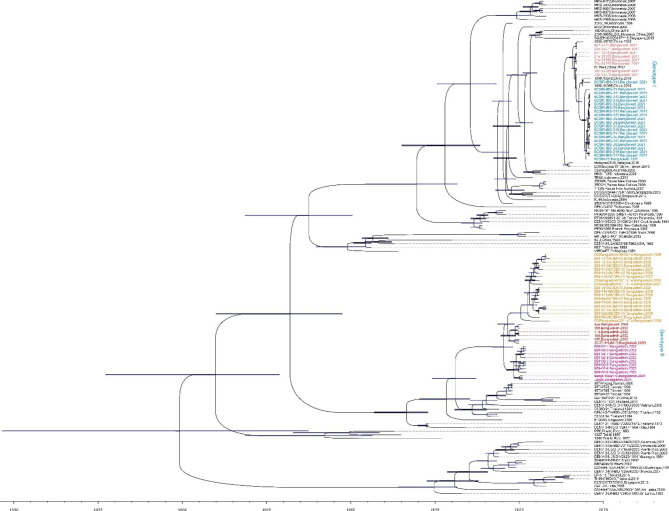
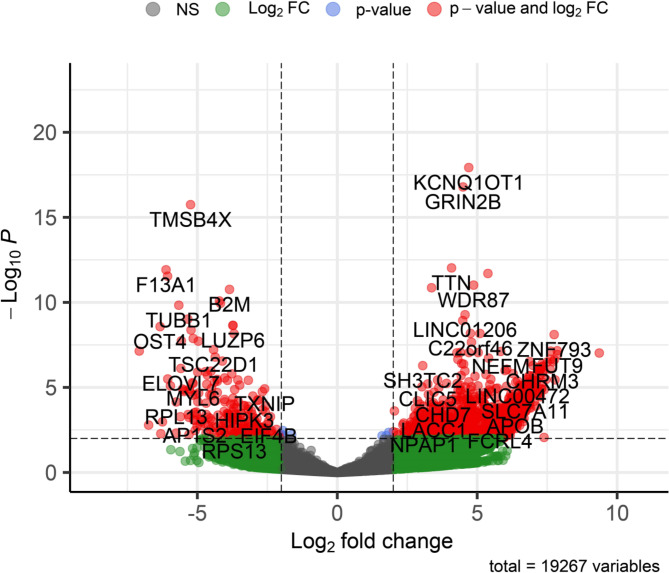
Results: The viral genome sequence revealed dengue viral genome size ranges 10647 to 10707 nucleotide. Phylogenetic and phylodynamic analysis showed that the 2021 epidemic isolates were DENV-3 genotype-I and maintained as a new clade in compared to 2019 epidemic. Transcriptome analysis showed a total of 2686 genes were DEG in dengue patients compared to control with a q-value < 0.05. DESeq2 plot counts function of the top 24 genes with the smallest q-values of differential gene expression of RNA-seq data showed that 11 genes were upregulated, whereas 13 genes were downregulated. GO analysis showed a significant upregulation (p = < 0.001) in a process of multicellular organismal, nervous system, sensory perception of chemical stimulus, and G protein-coupled receptor signaling pathways in the dengue patients. However, there were a significant downregulation (p = < 0.001) of intracellular component, cellular anatomical entity, and protein-containing complex in dengue patients. Most importantly, there was a significant increase of a class of immunoregulatory proteins in dengue patients in compared to the controls, with increased GO of immune system process. In addition, upregulation of toll receptor (TLR) signaling pathways were found in dengue patients. These TLR pathways were particularly involved for the activation of innate system coupled with adaptive immune system that probably involved the rapid elimination of dengue virus infected cells. These differentially expressed genes could be further investigated for target based prophylactic interventions for dengue.
Conclusion: This is a first report describing DENV complete genomic features and differentially expressed genes in patients in Bangladesh. These genes may have diagnostic and therapeutic values for dengue infection. Continual genomic surveillance is required to further investigate the shift in dominant genotypes in relation to viral pathogenesis.
Supplementary Information: The online version contains supplementary material available at 10.1186/s12985-023-02030-1.
Conflict of interest statement
The authors declare that they have no conflict of interest.
Figures


References
-
- Aziz MM, Hasan KN, Hasanat MA, Siddiqui MA, Salimullah M, Chowdhury AK, et al. Predominance of the DEN-3 genotype during the recent dengue outbreak in Bangladesh. Southeast Asian J Trop Med Public Health. 2002;33:42–8. - PubMed
-
- Suzuki K, Phadungsombat J, Nakayama EE, Saito A, Egawa A, Sato T et al. Genotype replacement of dengue virus type 3 and clade replacement of dengue virus type 2 genotype Cosmopolitan in Dhaka, Bangladesh in 2017.Infect Genet Evol. 2019;75. - PubMed
MeSH terms
LinkOut - more resources
Full Text Sources
Medical
