. 2023 Jun 19;42(1):150.
doi: 10.1186/s13046-023-02702-4.

Oridonin promotes endoplasmic reticulum stress via TP53-repressed TCF4 transactivation in colorectal cancer

Affiliations

Oridonin promotes endoplasmic reticulum stress via TP53-repressed TCF4 transactivation in colorectal cancer

Fangyuan Zhou et al. J Exp Clin Cancer Res. .

Abstract

Background: The incidence of colorectal cancer and cancer death rate are increasing every year, and the affected population is becoming younger. Traditional Chinese medicine therapy has a unique effect in prolonging survival time and improving the prognosis of patients with colorectal cancer. Oridonin has been reported to have anti-cancer effects in a variety of tumors, but the exact mechanism remains to be investigated.

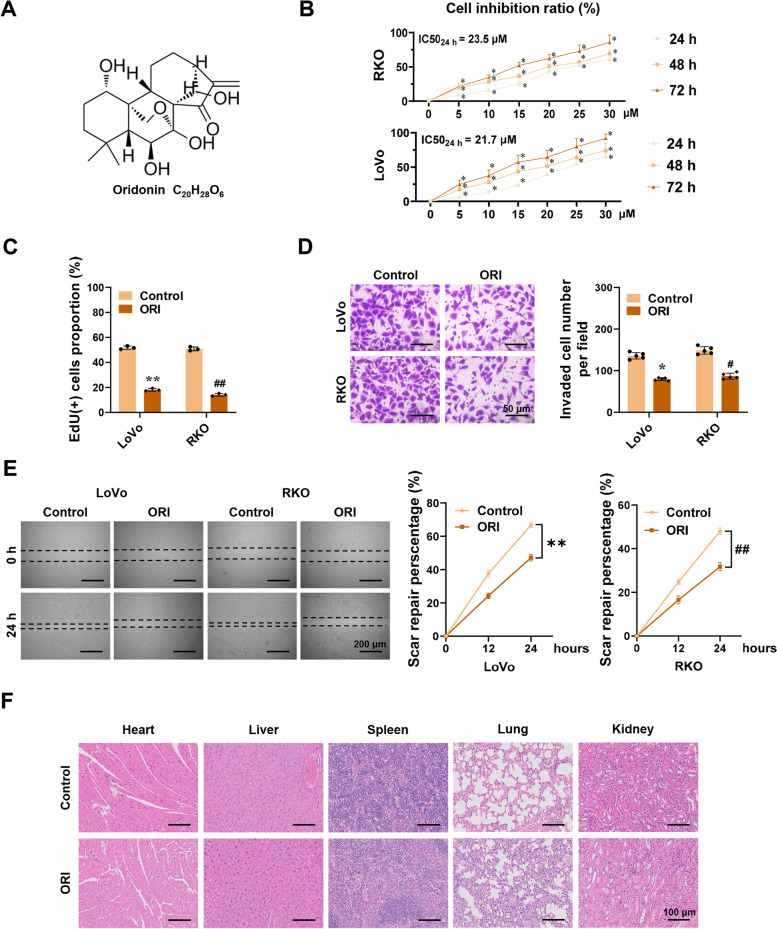
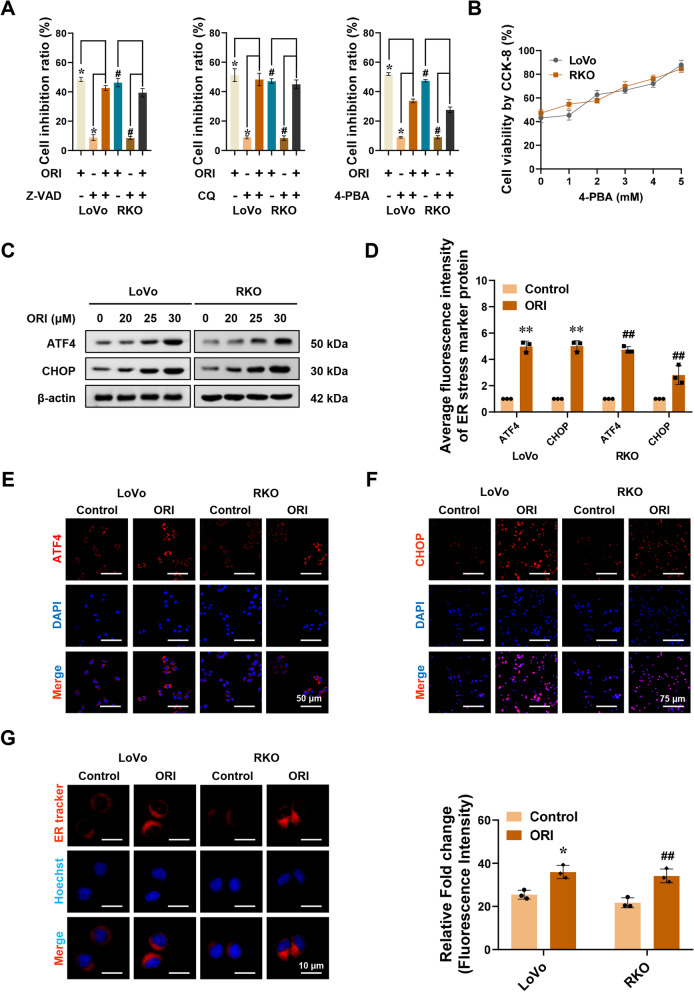
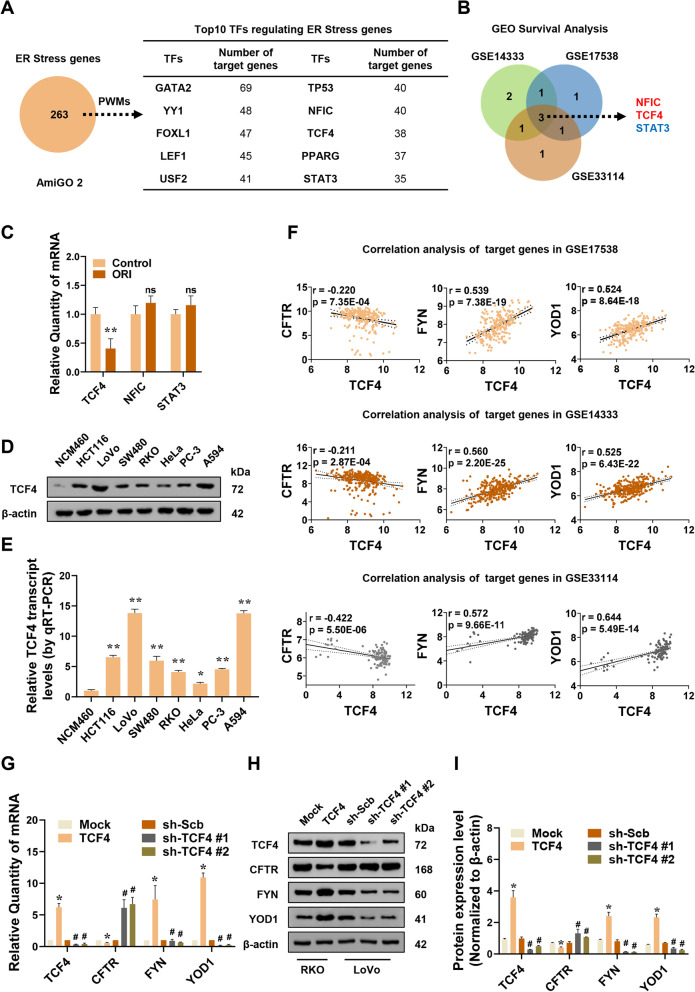
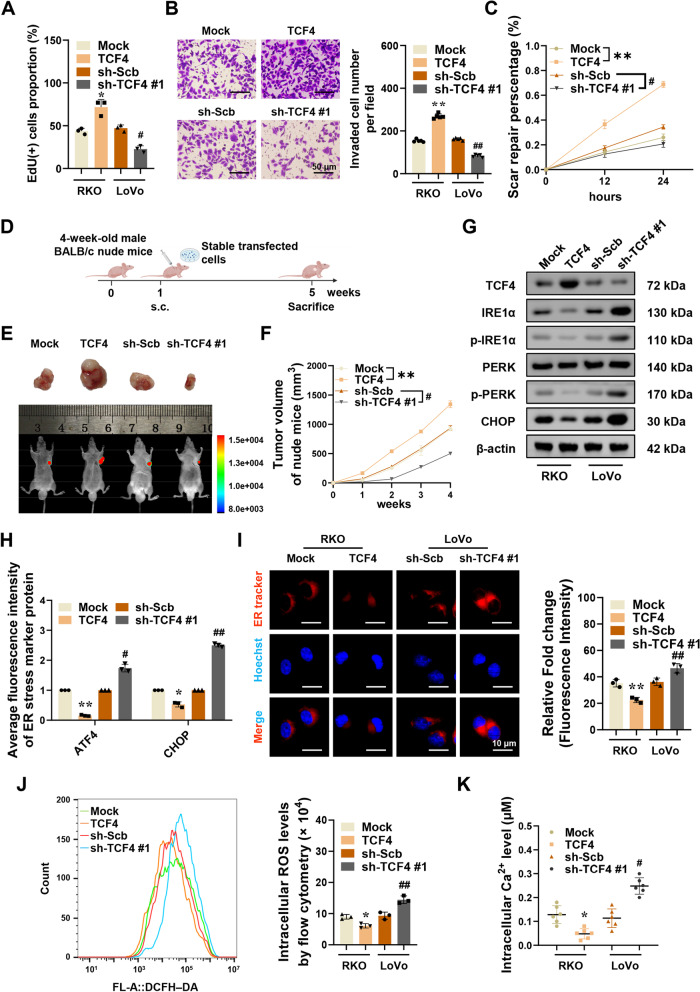
Methods: Cell Counting Kit-8 assay (CCK8) and 5-Ethynyl-2'-deoxyuridine (EdU) staining assay, Tranwell, and Wound healing assays were performed to measure cell proliferation, invasion, and migration capacities, respectively. The protein and mRNA expression levels of various molecules were reflected by Western blot and Reverse Transcription quantitative Polymerase Chain Reaction (qRT-PCR). Transcription Factor 4 (TCF4) and its target genes were analyzed by Position Weight Matrices (PWMs) software and the Gene Expression Omnibus (GEO) database. Immunofluorescence (IF) was performed to visualize the expression and position of Endoplasmic Reticulum (ER) stress biomarkers. The morphology of the ER was demonstrated by the ER tracker-red. Reactive Oxygen Species (ROS) levels were measured using a flow cytometer (FCM) or fluorescent staining. Calcium ion (Ca2+) concentration was quantified by Fluo-3 AM staining. Athymic nude mice were modeled with subcutaneous xenografts.

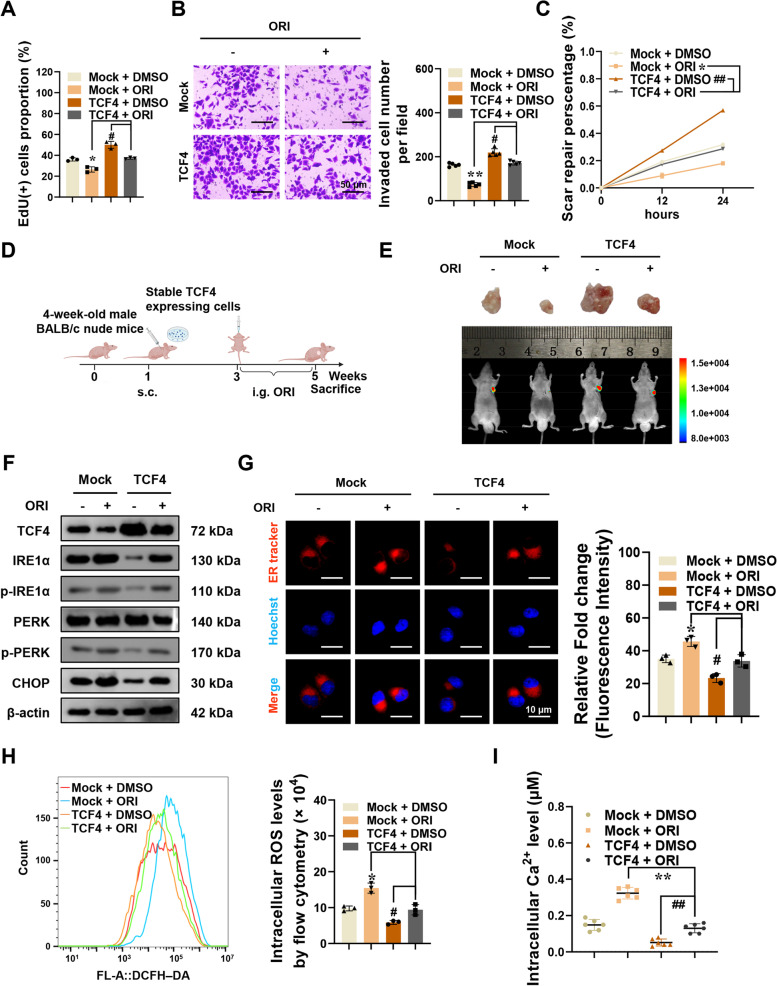
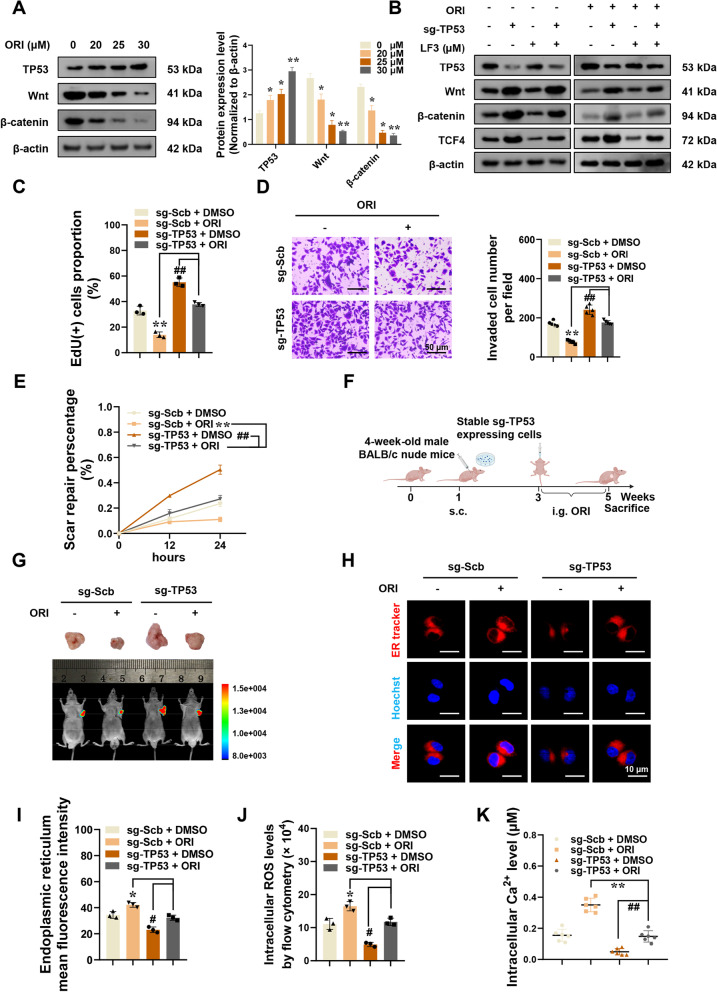
Results: Oridonin inhibited the proliferation, invasion, and migration of colorectal cancer, and this effect was weakened in a concentration-dependent manner by ER stress inhibitors. In addition, oridonin-induced colorectal tumor cells showed increased expression of ER stress biomarkers, loose morphology of ER, increased vesicles, and irregular shape. TCF4 was identified as a regulator of ER stress by PWMs software and GEO survival analysis. In vitro and in vivo experiments confirmed that TCF4 inhibited ER stress, reduced ROS production, and maintained Ca2+ homeostasis. In addition, oridonin also activated TP53 and inhibited TCF4 transactivation, further exacerbating the elevated ROS levels and calcium ion release in tumor cells and inhibiting tumorigenesis in colorectal cancer cells in vivo.

Conclusions: Oridonin upregulated TP53, inhibited TCF4 transactivation, and induced ER stress dysregulation in tumor cells, promoting colorectal cancer cell death. Therefore, TCF4 may be one of the important nodes for tumor cells to regulate ER stress and maintain protein synthesis homeostasis. And the inhibition of the TP53/TCF4 axis plays a key role in the anti-cancer effects of oridonin.

Keywords: Colorectal cancer; Endoplasmic reticulum stress; Oridonin; Transcription factor 4; Tumor protein p53.


Conflict of interest statement

The authors declare that they have no competing interests.

Figures

Fig. 1
Fig. 1
Oridonin prevents the development of colorectal cancer. A Molecular structure of oridonin. B Cell viability was measured by CCK8. RKO and LoVo cells were treated with oridonin (0, 5, 10, 15, 20, 25, 30 μM) for 24, 48, or 72 h. The IC50 of oridonin for 24 h was marked in the right panel (n = 6; IC50LoVo = 21.7 μM, IC50RKO = 23.5 μM). C-E EdU staining, Tranwell, and Wound healing assays indicate the proliferation, invasion, and migration of LoVo and RKO cells after treatment with or without 22 μM oridonin for 24 h (n = 3). Scale bars of D: 50 μm. Scale bars of E: 200 μm. F HE staining of the hearts, livers, spleens, lungs, and kidneys of tumor-bearing athymic nude mice treated with oridonin (ORI, 160 mg/kg) or DMSO (n = 5). Scale bars: 100 μm. The statistical results were presented as mean ± SD. Student’s t-test compared the difference in C and D; two-way ANOVA compared the difference in B and E. * P < 0.05, ** P < 0.01 compared with the Control in LoVo cells; # P < 0.05, ## P < 0.01 compared with the Control in RKO cells; * P < 0.05 compared with the oridonin (0 μM) in B. ORI: oridonin; CCK8: cell counting kit-8; IC50: the half maximal inhibitory concentration; EdU: 5-Ethynyl-2'-deoxyuridine; HE staining: hematoxylin–eosin staining; DMSO: dimethyl sulfoxide; SD: standard deviation; ANOVA: analysis of variance
Fig. 2
Fig. 2
Oridonin induces Endoplasmic Reticulum stress in colorectal cancer. A CCK-8 assay showing the cell inhibition ratio of LoVo and RKO cells. LoVo and RKO cells were treated with oridonin (ORI, 22 μM) and with or without Z-VAD (10 μM) or CQ (20 μM) or 4-PBA (3 mM) for 24 h (n = 6). B CCK-8 assay showing the cell viability of LoVo and RKO cells treated with oridonin (22 μM) and 4-PBA (0, 1, 2, 3, 4, 5 mM) for 24 h (n = 6). C Western blot assay showing the expression of the ATF4 and CHOP in LoVo and RKO cells treated with oridonin (0, 20, 25, 30 μM) for 24 h (n = 3). D-F The quantitative histogram (D) and representative fluorescence images (EF) for ATF4 and CHOP in LoVo and RKO cells treated with or without oridonin for 24 h. Scale bars of E: 50 μm. Scale bars of F: 75 μm (n = 3). G The representative fluorescence images (left panel) and fluorescence intensity quantitative histogram (right panel) of ER tracker-red in LoVo and RKO cells (n = 3). Scale bars: 10 μm. The statistical results were presented as mean ± SD. Student’s t-test compared the difference in A, D, and G; one-way ANOVA compared the difference in B. * P < 0.05, ** P < 0.01 compared with the Control in LoVo cells; # P < 0.05, ## P < 0.01 compared with the Control in RKO cells. ER: Endoplasmic reticulum; Z-VAD: Z-VAD-FMK; CQ: chloroquine; 4-PBA: 4-Phenylbutyric acid; ATF4: Activating transcription factor 4; CHOP: DNA damage-inducible transcript 3
Fig. 3
Fig. 3
TCF4 functions as an essential transcription factor in the regulation of ER stress. A The top 10 transcription factors (right table) regulating the expression of ER stress genes from the AmiGO 2 database (left panel) were analyzed by PWMs software. B Kaplan–Meier survival analysis in colorectal cancer GEO database (GSE14333, GSE17538, GSE33114) finding three transcription factors regulating ER stress genes. C qRT-PCR assay revealing the levels of TCF4, NFIC, and STAT3 in RKO cells treated with or without oridonin (n = 3). Normalized to β-actin. D-E Western blot and qRT-PCR assays showing the levels of TCF4 in different cell lines (n = 3). Normalized to β-actin. F Correlation analysis of TCF4 and target genes in colorectal cancer GEO database. G-I Western blot and qRT-PCR assays revealing the expression of TCF4, CFTR, FYN, YOD1 in RKO or LoVo cells stably transfected with empty vector pCMV-Mock (Mock), TCF4 eukaryotic expression plasmid pCMV-TCF4 (TCF4) or knockdown control plasmid pLV3-U6-sh-Scb (sh-Scb), RNA interference plasmid pLV3-U6-shTCF4 #1 (sh-TCF4 #1) and pLV3-U6-shTCF4 #2 (sh-TCF4 #2) (n = 3). Normalized to β-actin. The statistical results were presented as mean ± SD. Student’s t-test compared the difference in C-E and G-I; Linear regression analysis in F. * P < 0.05, ** P < 0.01 compared with Control, NCM460, Mock in C, D, E, G, and I; # P < 0.05 compared with sh-Scb in G and I; ns compared with Control in C. TFs: transcription factors; PWMs: Position Weight Matrices; GEO: Gene Expression Omnibus database; qRT-PCR: reverse transcription-quantitative polymerase chain reaction; TCF4: transcription factor 4; NFIC: nuclear factor 1 C-type; STAT3: signal transducer and activator of transcription 3; CFTR: Cystic fibrosis transmembrane conductance regulator; FYN: Tyrosine-protein kinase Fyn; YOD1: YOD1 deubiquitinase; ns: not statistically significant
Fig. 4
Fig. 4
TCF4 promotes tumorigenesis and inhibits ER stress in colorectal cancer. A-C EdU staining, Tranwell, and Wound healing assays showing proliferation, invasion, and migration of RKO or LoVo cells stably expressing Mock, TCF4, sh-Scb, or sh-TCF4 #1 (n = 3). Scale bars of B: 50 μm. D Flowchart of xenografts by subcutaneous injection of RKO cells stably transfected with Mock, TCF4, sh-Scb, or sh-TCF4 #1 into the dorsal flanks of nude mice. E–F Representative fluorescence and tumor images (E) and tumor growth curve of xenografts (F) by subcutaneous injection of RKO cells stably transfected with Mock, TCF4, sh-Scb, or sh-TCF4 #1 into the dorsal flanks of nude mice (n = 5). G Western blot assay showing the expression of TCF4, IRE1α, p-IRE1α, PERK, p-PERK, and CHOP in RKO or LoVo cells stably expressing Mock, TCF4, sh-Scb, or sh-TCF4 #1 (n = 3). Normalized to β-actin. H The quantitative histogram for the fluorescence images of ATF4 and CHOP in RKO or LoVo cells stably expressing Mock, TCF4, sh-Scb, or sh-TCF4 #1. I Representative fluorescence images and the quantitative histogram of ER tracker-red in RKO or LoVo cells stably expressing Mock, TCF4, sh-Scb, or sh-TCF4 #1 (n = 3). Scale bars: 10 μm. J Flow cytometry analysis of intracellular ROS levels in RKO or LoVo cells stably expressing Mock, TCF4, sh-Scb, or sh-TCF4 #1 (n = 3). K The calcium indicator Fluo-3 AM detects intracellular Ca2+ levels in RKO or LoVo cells stably expressing Mock, TCF4, sh-Scb, or sh-TCF4 #1 (n = 6). The statistical results were presented as mean ± SD. Student’s t-test compared the difference in A-B and H–K, and two-way ANOVA compared the difference in C and F. * P < 0.05, ** P < 0.01 compared with Mock; # P < 0.05, ## P < 0.01 compared with sh-Scb. IRE1α: endoplasmic reticulum to nucleus signaling 1-alpha; p-IRE1α: phosphor-IRE1α; PERK: eukaryotic translation initiation factor 2 alpha kinase 3, EIF2AK3; p-PERK: phosphor-PERK; ROS: reactive oxygen species; Ca2+: calcium
Fig. 5
Fig. 5
Oridonin blocks the inhibition of ER stress by TCF4 in colorectal cancer. A-C EdU, Tranwell, and Wound healing assays showing proliferation, invasion, and migration of RKO cells stably transfected with Mock or TCF4 and treated with or without oridonin (n = 3). Scale bars of B: 50 μm. D Flowchart of xenografts by subcutaneous injection of RKO cells stably transfected with Mock or TCF4 and treatment with or without oridonin. E Representative fluorescence and tumor images of the xenografts by subcutaneous injection of RKO cells stably transfected with Mock or TCF4 and treatment with or without oridonin (n = 5). F Western blot assay indicating the levels of TCF4, IRE1α, p-IRE1α, PERK, p-PERK, and CHOP in RKO cells stably transfected with Mock or TCF4 and treated with or without oridonin (n = 3). Normalized to β-actin. G Representative fluorescence images and the quantized histogram of ER tracker-red in RKO cells stably transfected with Mock or TCF4 and treated with or without oridonin (n = 3). Scale bars: 10 μm. H Flow cytometry analysis of intracellular ROS levels in RKO cells stably transfected with Mock or TCF4 and treated with or without oridonin (n = 3). G The calcium indicator Fluo-3 AM detects intracellular Ca2+ levels in RKO cells stably transfected with Mock or TCF4 and treated with or without oridonin (n = 6). The statistical results were presented as mean ± SD. Student’s t-test compared the difference in A-B and G-I, and two-way ANOVA compared the difference in C. * P < 0.05, ** P < 0.01 compared with Mock + ORI, and # P < 0.05, ## P < 0.01 compared with TCF4 + DMSO
Fig. 6
Fig. 6
Oridonin attenuates ER stress by TP53/TCF4 axis in colorectal cancer. A Western blot assay showing the protein levels of TP53, Wnt, and β-catenin in colorectal cancer cells co-cultured with oridonin (0, 20, 25, 30 μM) for 24 h (n = 3). Normalized to β-actin. B Western blot assay showing the protein levels of TP53, Wnt, β-catenin, and TCF4 in RKO cells stably transfected with sg-Scb or sg-TP53 and treated with oridonin or LF3 (10 μM) (n = 3). C-E EdU staining, Tranwell, and Wound healing assays showing proliferation, invasion, and migration of RKO cells stably transfected with sg-Scb or sg-TP53 and treated with or without oridonin (n = 3). Scale bars of D: 50 μm. F Flowchart of xenografts by subcutaneous injection of RKO cells stably transfected with sg-Scb or sg-TP53 and treatment with or without oridonin. G Representative fluorescence and tumor images of xenografts by subcutaneous injection of RKO cells stably transfected with sg-Scb or sg-TP53 and treatment with or without oridonin (n = 5). H-I Representative fluorescence images (H) and the quantized histogram (I) of ER tracker-red in RKO cells stably transfected with sg-Scb or sg-TP53 and treated with or without oridonin (n = 3). Scale bars: 10 μm. J Flow cytometry analysis of intracellular ROS levels in RKO cells stably transfected with sg-Scb or sg-TP53 and treated with or without oridonin (n = 3). K The calcium indicator Fluo-3 AM detects intracellular Ca2+ levels in RKO cells stably transfected with sg-Scb or sg-TP53 and treated with or without oridonin (n = 6). The statistical results were presented as mean ± SD. Student’s t-test compared the difference in C-D and I-K, one-way ANOVA compared the difference in A, and two-way ANOVA compared the difference in E. * P < 0.05, ** P < 0.01 compared with ORI (0 μM) or sh-Scb + ORI, and # P < 0.05, ## P < 0.01 compared with sh-TP53 + DMSO. TP53: tumor protein p53

Similar articles

Cited by

References

    1. Ferlay J, Soerjomataram I, Dikshit R, Eser S, Mathers C, Rebelo M, et al. Cancer incidence and mortality worldwide: sources, methods and major patterns in GLOBOCAN 2012. Int J Cancer. 2015;136:E359–E386. doi: 10.1002/ijc.29210. - DOI - PubMed
    1. Cunningham D, Atkin W, Lenz HJ, Lynch HT, Minsky B, Nordlinger B, et al. Colorectal cancer. Lancet (London, England) 2010;375:1030–1047. doi: 10.1016/S0140-6736(10)60353-4. - DOI - PubMed
    1. Siegel RL, Miller KD, Goding Sauer A, Fedewa SA, Butterly LF, Anderson JC, et al. Colorectal cancer statistics, 2020. CA Cancer J Clin. 2020;70:145–64. doi: 10.3322/caac.21601. - DOI - PubMed
    1. The LO. Colorectal cancer: a disease of the young? Lancet Oncol. 2017;18:413. doi: 10.1016/S1470-2045(17)30202-4. - DOI - PubMed
    1. Li C, Zhang K, Pan G, Ji H, Li C, Wang X, et al. Dehydrodiisoeugenol inhibits colorectal cancer growth by endoplasmic reticulum stress-induced autophagic pathways. J Experiment Clin Cancer Res : CR. 2021;40:125. doi: 10.1186/s13046-021-01915-9. - DOI - PMC - PubMed