. 2023 Jun 19;21(1):148.
doi: 10.1186/s12964-023-01166-5.

Local GHR roles in regulation of mitochondrial function through mitochondrial biogenesis during myoblast differentiation

Affiliations

Local GHR roles in regulation of mitochondrial function through mitochondrial biogenesis during myoblast differentiation

Bowen Hu et al. Cell Commun Signal. .

Abstract

Background: Myoblast differentiation requires metabolic reprogramming driven by increased mitochondrial biogenesis and oxidative phosphorylation. The canonical GH-GHR-IGFs axis in liver exhibits a great complexity in response to somatic growth. However, the underlying mechanism of whether local GHR acts as a control valve to regulate mitochondrial function through mitochondrial biogenesis during myoblast differentiation remains unknown.

Methods: We manipulated the GHR expression in chicken primary myoblast to investigate its roles in mitochondrial biogenesis and function during myoblast differentiation.

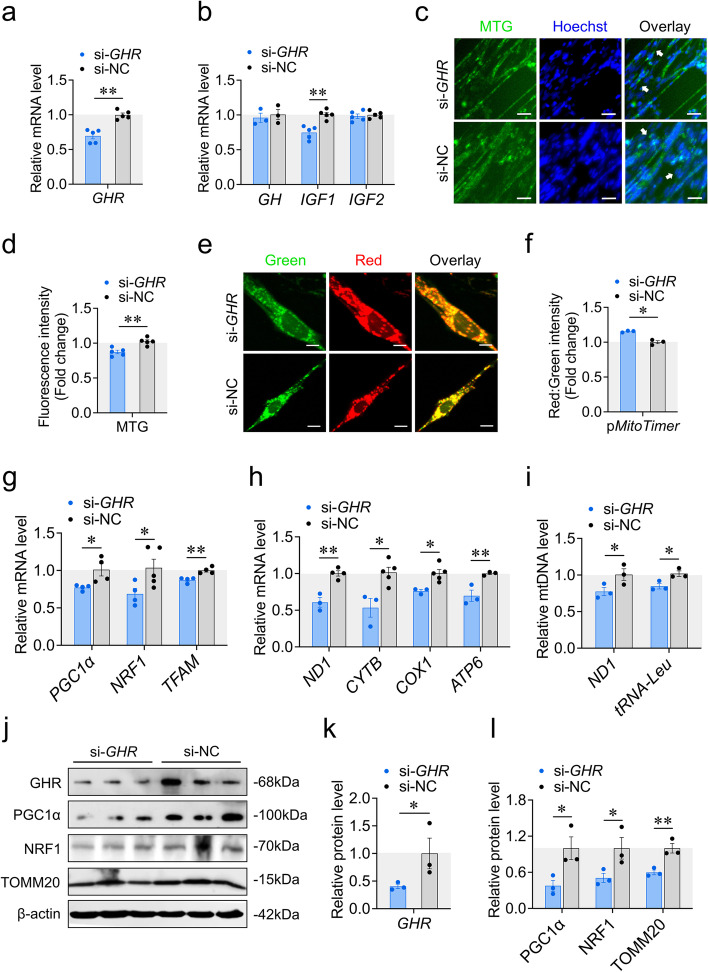
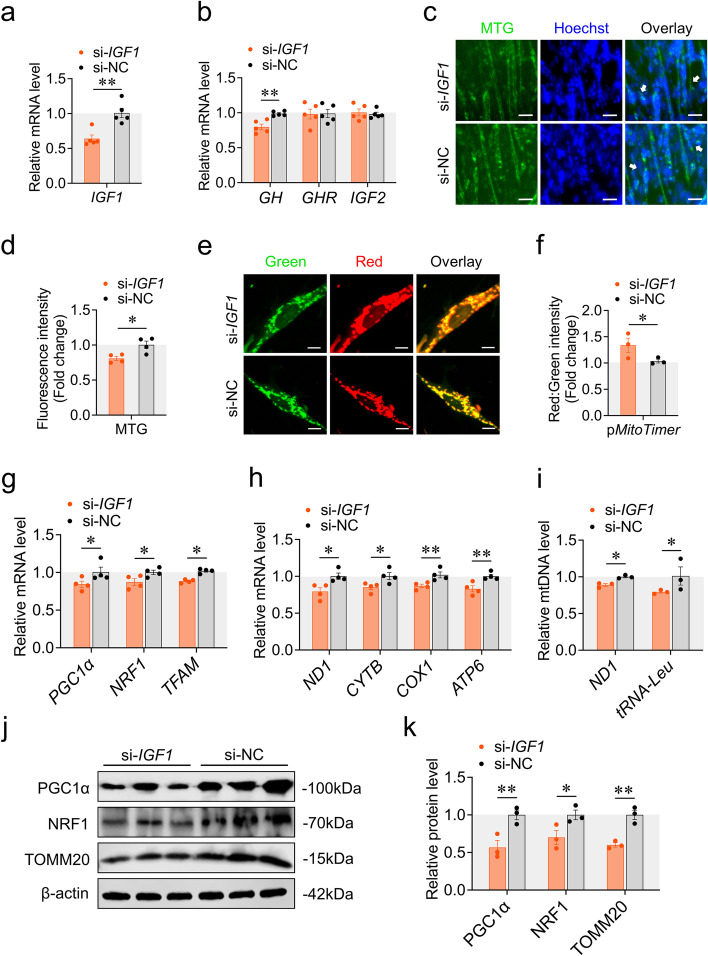
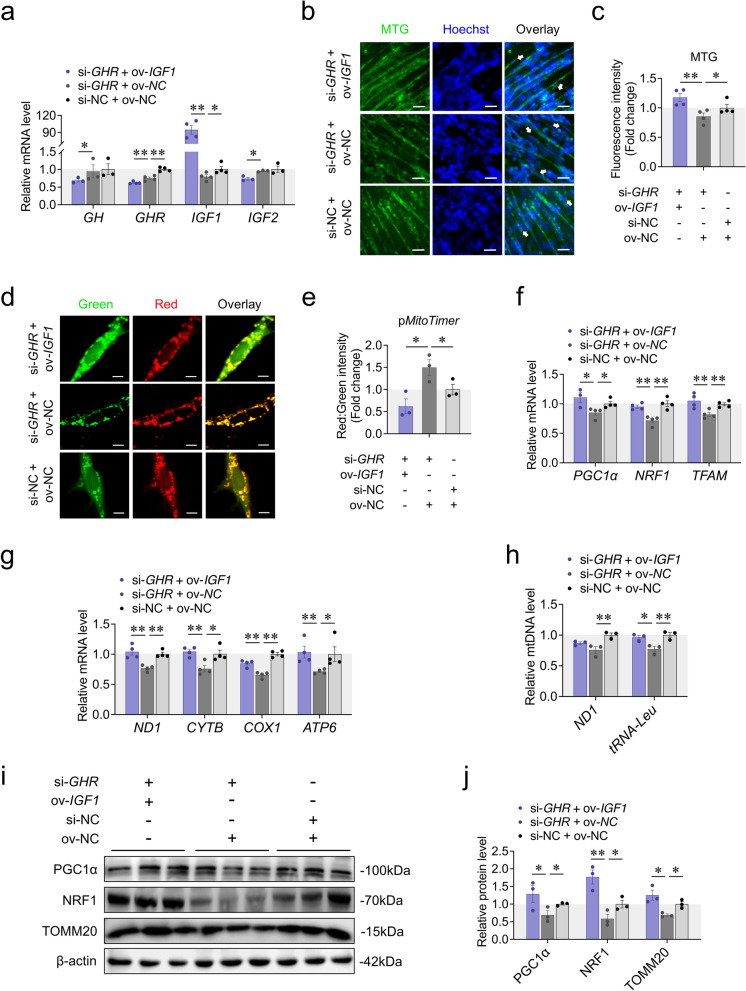
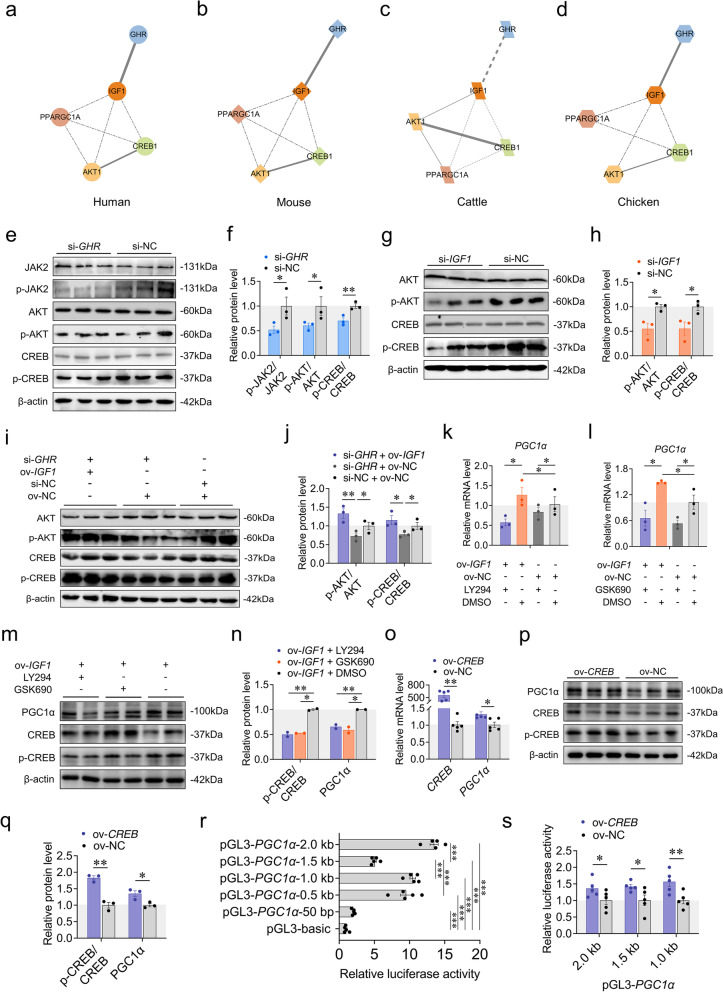
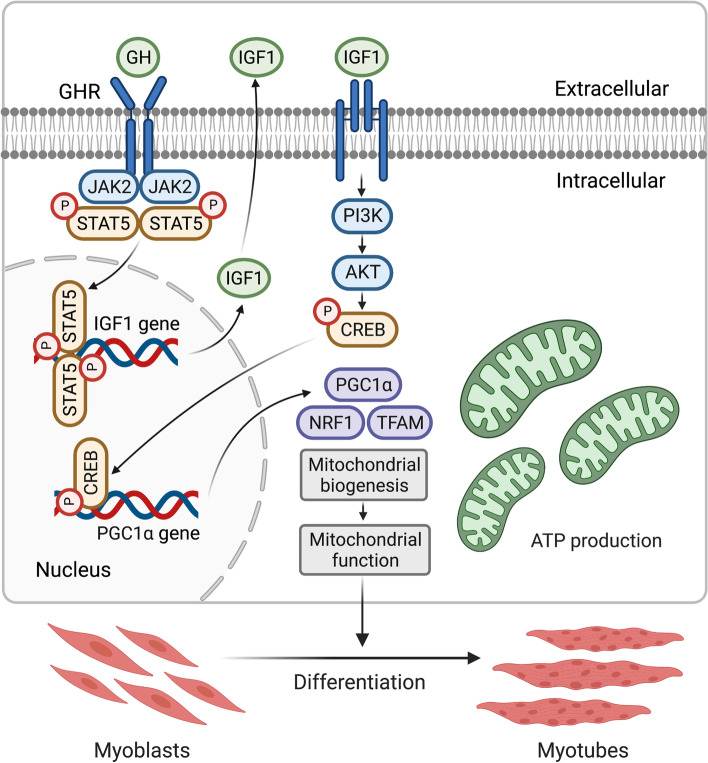
Results: We reported that GHR is induced during myoblast differentiation. Local GHR promoted mitochondrial biogenesis during myoblast differentiation, as determined by the fluorescence intensity of Mito-Tracker Green staining and MitoTimer reporter system, the expression of mitochondrial biogenesis markers (PGC1α, NRF1, TFAM) and mtDNA encoded gene (ND1, CYTB, COX1, ATP6), as well as mtDNA content. Consistently, local GHR enhanced mitochondrial function during myoblast differentiation, as determined by the oxygen consumption rate, mitochondrial membrane potential, ATP level and ROS production. We next revealed that the regulation of mitochondrial biogenesis and function by GHR depends on IGF1. In terms of the underlying mechanism, we demonstrated that IGF1 regulates mitochondrial biogenesis via PI3K/AKT/CREB pathway. Additionally, GHR knockdown repressed myoblast differentiation.

Conclusions: In conclusion, our data corroborate that local GHR acts as a control valve to enhance mitochondrial function by promoting mitochondrial biogenesis via IGF1-PI3K/AKT/CREB pathway during myoblast differentiation. Video Abstract.

Keywords: GHR; IGF1; Mitochondrial biogenesis; Mitochondrial function; Myoblast differentiation.


Conflict of interest statement

The authors declare that they have no competing interests.

Figures

Fig. 1
Fig. 1
GHR knockdown inhibits mitochondrial biogenesis. a Knockdown efficiency was measured by RT-qPCR at 48 h after transfection with si-GHR and si-NC. b The expression of genes involved in the GH-GHR-IGFs signaling pathway was measured by RT-qPCR at 48 h after transfection with si-GHR and si-NC. c and d MTG staining of CPM was measured at 48 h after transfection with si-GHR and si-NC. White arrow labeled elongated myoblasts. Scaler bar, 25 μm. e and f Confocal images were observed at 48 h after co-transfection with pMitoTimer + si-GHR and pMitoTimer + si-NC. Scaler bar, 10 μm. Green represents newly synthesized mitochondria, red represents mature mitochondria. Images were analyzed by Leica LAS X life science software. g The expression of genes involved in PGC1α-NRF1-TFAM signaling pathway was measured by RT-qPCR at 48 h after transfection with si-GHR and si-NC. h The expression of mtDNA encoded genes was measured by RT-qPCR at 48 h after transfection with si-GHR and si-NC. i The relative mtDNA content was measured by RT-qPCR at 48 h after transfection with si-GHR and si-NC. j-l Western blots with anti-GHR, anti-PGC1α, anti-NRF1 and anti-β-actin at 48 h after transfection with si-GHR and si-NC. Data are shown as mean ± SEM, *p < 0.05, **p < 0.01
Fig. 2
Fig. 2
IGF1 knockdown inhibits mitochondrial biogenesis. a Knockdown efficiency was measured by RT-qPCR at 48 h after transfection with si-IGF1 and si-NC. b The expression of genes involved in the GH-GHR-IGFs signaling pathway was measured by RT-qPCR at 48 h after transfection with si-IGF1 and si-NC. c and d MTG staining of CPM was measured at 48 h after transfection with si-IGF1 and si-NC. White arrow labeled elongated myoblasts. Scaler bar, 25 μm. e and f Confocal images were observed at 48 h after co-transfection with pMitoTimer + si-IGF1 and pMitoTimer + si-NC. Scaler bar, 10 μm. Green represents newly synthesized mitochondria, red represents mature mitochondria. Images were analyzed by Leica LAS X life science software. g The expression of genes involved in PGC1α-NRF1-TFAM signaling pathway was measured by RT-qPCR at 48 h after transfection with si-IGF1 and si-NC. h The expression of mtDNA encoded genes was measured by RT-qPCR at 48 h after transfection with si-IGF1 and si-NC. i The relative mtDNA content was measured by RT-qPCR at 48 h after transfection with si-IGF1 and si-NC. j and k Western blots with anti-PGC1α, anti-NRF1 and anti-β-actin at 48 h after transfection with si-IGF1 and si-NC. Data are shown as mean ± SEM, *p < 0.05, **p < 0.01
Fig. 3
Fig. 3
Regulation of mitochondrial biogenesis by GHR depends on IGF1. a The expression of genes involved in the GH-GHR-IGFs signaling pathway was measured by RT-qPCR at 48 h after co-transfection with si-GHR + pcDNA3.1-IGF1, si-GHR + pcDNA3.1 and si-NC + pcDNA3.1. b and c MTG staining of CPM was measured at 48 h after transfection with co-transfection with si-GHR + pcDNA3.1-IGF1, si-GHR + pcDNA3.1 and si-NC + pcDNA3.1. White arrow labeled elongated myoblasts. Scaler bar, 25 μm. d and e Confocal images were observed at 48 h after co-transfection with pMitoTimer + si-GHR + pcDNA3.1-IGF1, + si-GHR + pcDNA3.1 and + si-NC + pcDNA3.1. Scaler bar, 10 μm. Green represents newly synthesized mitochondria, red represents mature mitochondria. Images were analyzed by Leica LAS X life science software. f The expression of genes involved in PGC1α-NRF1-TFAM signaling pathway was measured by RT-qPCR at 48 h after co-transfection with si-GHR + pcDNA3.1-IGF1, si-GHR + pcDNA3.1 and si-NC + pcDNA3.1. g The expression of mtDNA encoded genes was measured by RT-qPCR at 48 h after co-transfection with si-GHR + pcDNA3.1-IGF1, si-GHR + pcDNA3.1 and si-NC + pcDNA3.1. h The relative mtDNA content was measured by RT-qPCR at 48 h after co-transfection with si-GHR + pcDNA3.1-IGF1, si-GHR + pcDNA3.1 and si-NC + pcDNA3.1. i and j Western blots with anti-PGC1α, anti-NRF1 and anti-β-actin at 48 h after co-transfection with si-GHR + pcDNA3.1-IGF1, si-GHR + pcDNA3.1 and si-NC + pcDNA3.1. Data are shown as mean ± SEM, *p < 0.05, **p < 0.01
Fig. 4
Fig. 4
Local GHR regulates mitochondrial biogenesis via IGF1-PI3K/AKT/CREB pathway. a The PPI network of human GHR, IGF1, AKT, CREB and PGC1α. b The PPI network of mouse GHR, IGF1, AKT, CREB and PGC1α. c The PPI network of pig GHR, IGF1, AKT, CREB and PGC1α. d The PPI network of chicken GHR, IGF1, AKT, CREB and PGC1α. Protein–protein interaction was performed by the String database and visualized by Cytoscape (version 3.4.0). e and f Western blots with anti-JAK2, anti-p-JAK2, anti-AKT1, anti-p-AKT1, anti-CREB1, anti-p-CREB1 and anti-β-actin at 48 h after transfection with si-GHR and si-NC. g and h Western blots with anti-AKT1, anti-p-AKT1, anti-CREB1, anti-p-CREB1 and anti-β-actin at 48 h after transfection with si-IGF1 and si-NC. i and j Western blots with anti-AKT1, anti-p-AKT1, anti-CREB1, anti-p-CREB1 and anti-β-actin at 48 h after co-transfection with si-GHR + pcDNA3.1-IGF1, si-GHR + pcDNA3.1 and si-NC + pcDNA3.1. k LY294002 (PI3K inhibitor) was added at 24 h before measuring the expression of PGC1α by RT-qPCR at 48 h after transfection of pcDNA3.1-IGF1 and pcDNA3.1. l GSK690693 (AKT inhibitor) was added at 24 h before measuring the expression of PGC1α by RT-qPCR at 48 h after transfection of pcDNA3.1-IGF1 and pcDNA3.1. m and n LY294002 or GSK690693 was added at 24 h before measuring the protein levels with anti-PGC1α, anti-CREB1, anti-p-CREB1 and anti-β-actin at 48 h after transfection of pcDNA3.1-IGF1 and pcDNA3.1. o The expression of CREB and PGC1α was measured by RT-qPCR at 48 h after transfection with pcDNA3.1-CREB and pcDNA3.1. p and q Western blots with anti-PGC1α, anti-CREB1, anti-p-CREB1 and anti-β-actin at 48 h after transfection with pcDNA3.1-CREB and pcDNA3.1. r Dual-Luciferase report assays transfected with reporter vectors containing different length of 5′ upstream region of PGC1α. s Dual-Luciferase report assays of CREB overexpression co-transfected with reporter vectors containing different length of 5′ upstream region of PGC1α. Data are shown as mean ± SEM, *p < 0.05, **p < 0.01
Fig. 5
Fig. 5
Local GHR enhances mitochondrial function through IGF1. a ΔΨm were measured by the fluorescence of JC-1 at 48 h after transfection with si-GHR and si-NC. b ΔΨm were measured by the fluorescence of JC-1 at 48 h after transfection with si-IGF1 and si-NC. c ATP level was measured at 48 h after transfection with si-GHR and si-NC. d Reactive oxygen species production was measured by the fluorescence of DCF at 48 h after transfection with si-GHR and si-NC. e ATP level was measured at 48 h after transfection with si-IGF1 and si-NC. f Reactive oxygen species production was measured by the fluorescence of DCF at 48 h after transfection with si-IGF1 and si-NC (shared control group with si-GHR). g Oxygen consumption rate (OCR) was measured in CPM utilizing Seahorse Extracellular Flux Analyzer after transfection with pcDNA3.1-GHR, pcDNA3.1-IGF1 and pcDNA3.1. Dotted lines indicate when mitochondrial inhibitors were added. h Basal respiration and i Maximal respiration were determined following mitochondrial uncoupling by FCCP. j ATP-production was assessed after inhibition of ATP synthase by oligomycin. k Proton leakage was determined after inhibiting complex I and III by rotenone (rot) and antimycin-A (AA). l ΔΨm was measured by the fluorescence of JC-1 at 48 h after co-transfection with si-GHR + pcDNA3.1-IGF1, si-GHR + pcDNA3.1 and si-NC + pcDNA3.1. m ATP level was measured at 48 h after co-transfection with si-GHR + pcDNA3.1-IGF1, si-GHR + pcDNA3.1 and si-NC + pcDNA3.1. n Reactive oxygen species production was measured by the fluorescence of DCF at 48 h co-transfection with si-GHR + pcDNA3.1-IGF1, si-GHR + pcDNA3.1 and si-NC + pcDNA3.1. o OCR was measured in CPM utilizing Seahorse Extracellular Flux Analyzer after co-transfection with si-GHR + pcDNA3.1-IGF1, si-GHR + pcDNA3.1 and si-NC + pcDNA3.1. p-s Measured and calculated parameters of mitochondrial respiration. Data are shown as mean ± SEM, *p < 0.05, **p < 0.01
Fig. 6
Fig. 6
GHR knockdown represses myoblast differentiation. a CCK-8 assays were performed after transfection with si-GHR and si-NC. b and c EdU proliferation assays were performed after transfection with si-GHR and si-NC. d Cell cycle analysis were performed after transfection with si-GHR and si-NC. e The expression of cell proliferation marker genes was measured by RT-qPCR at 48 h after transfection with si-GHR and si-NC. f–h MyHC staining, myotube area and myoblast fusion index were measured at 48 h after transfection with si-GHR and si-NC. i The expression of myoblast differentiation marker genes was measured by RT-qPCR at 48 h after transfection with si-GHR and si-NC. Data are shown as mean ± SEM, *p < 0.05, **p < 0.01
Fig. 7
Fig. 7
Schematic diagram for the mechanistic model of the GHR roles in regulation of mitochondrial function during myoblast differentiation. Local GHR enhances mitochondrial function by promoting mitochondrial biogenesis via IGF1-PI3K/AKT/CREB pathway during myoblast differentiation. This graphical abstract was created with Biorender.com

Similar articles

Cited by

References

    1. de Vos AM, Ultsch M, Kossiakoff AA. Human growth hormone and extracellular domain of its receptor: crystal structure of the complex. Science. 1992;255:306–312. doi: 10.1126/science.1549776. - DOI - PubMed
    1. Kopchick JJ, Andry JM. Growth hormone (GH), GH receptor, and signal transduction. Mol Genet Metab. 2000;71:293–314. doi: 10.1006/mgme.2000.3068. - DOI - PubMed
    1. Brooks AJ, Wooh JW, Tunny KA, Waters MJ. Growth hormone receptor; mechanism of action. Int J Biochem Cell B. 2008;40:1984–1989. doi: 10.1016/j.biocel.2007.07.008. - DOI - PubMed
    1. Vanderkuur JA, Butch ER, Waters SB, Pessin JE, Guan KL, Carter-Su C. Signaling molecules involved in coupling growth hormone receptor to mitogen-activated protein kinase activation. Endocrinology. 1997;138:4301–4307. doi: 10.1210/endo.138.10.5453. - DOI - PubMed
    1. Hayashi AA, Proud CG. The rapid activation of protein synthesis by growth hormone requires signaling through mTOR. Am J Physiol-Endoc M. 2007;292:E1647–E1655. - PubMed

Publication types

MeSH terms

Substances