

Genome-wide association mapping of resistance to the foliar diseases septoria nodorum blotch and tan spot in a global winter wheat collection
- PMID: 37337566
- PMCID: PMC10276793
- DOI: 10.1007/s11032-023-01400-5
Genome-wide association mapping of resistance to the foliar diseases septoria nodorum blotch and tan spot in a global winter wheat collection
Abstract
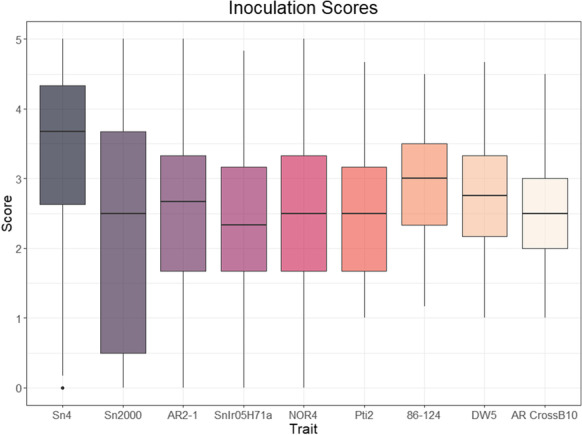
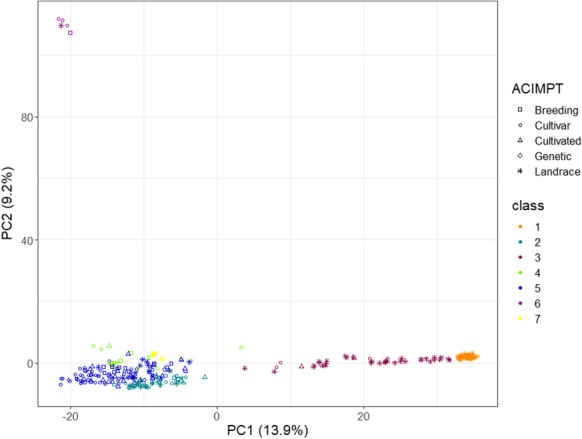
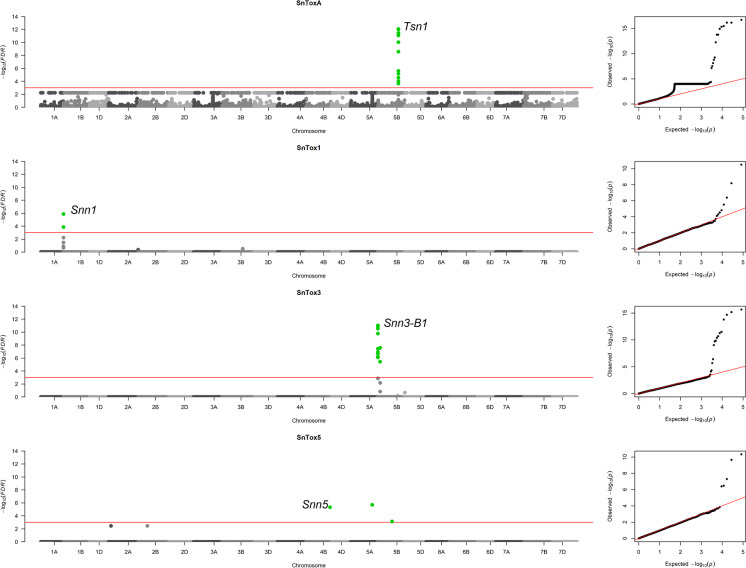
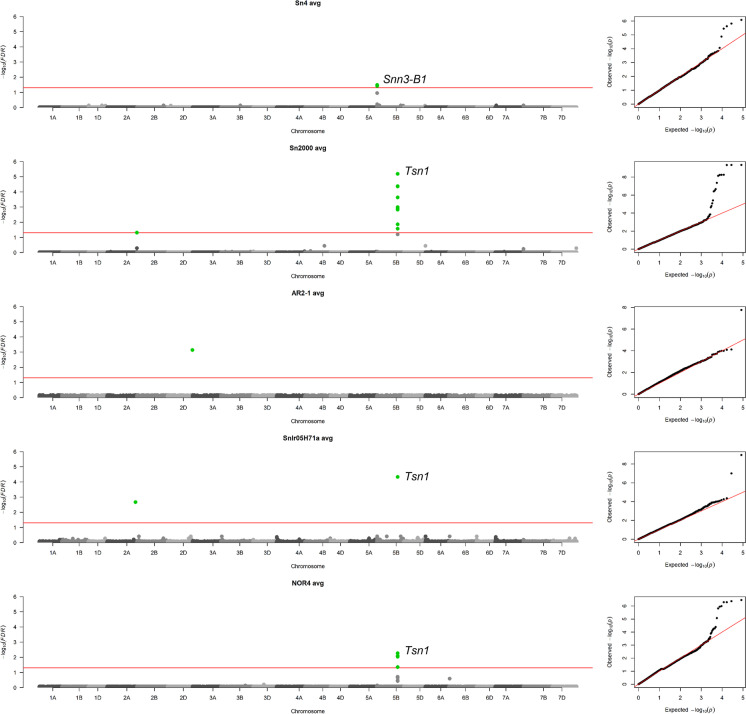
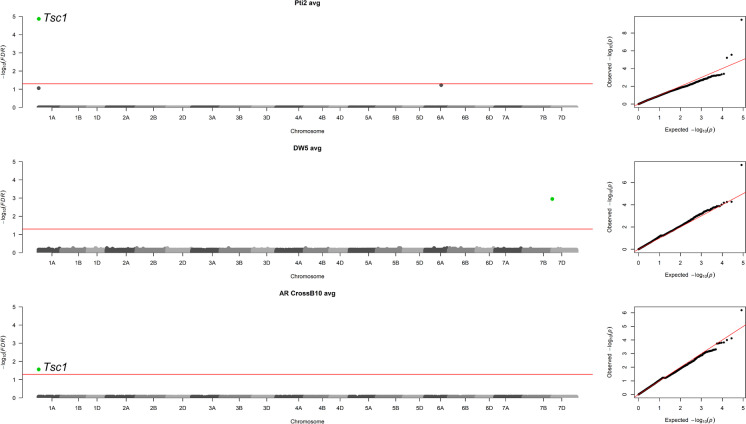
Septoria nodorum blotch (SNB) and tan spot, caused by the necrotrophic fungal pathogens Parastagonospora nodorum and Pyrenophora tritici-repentis, respectively, often occur together as a leaf spotting disease complex on wheat (Triticum aestivum L.). Both pathogens produce necrotrophic effectors (NEs) that contribute to the development of disease. Here, genome-wide association analysis of a diverse panel of 264 winter wheat lines revealed novel loci on chromosomes 5A and 5B associated with sensitivity to the NEs SnTox3 and SnTox5 in addition to the known sensitivity genes for NEs Ptr/SnToxA, SnTox1, SnTox3, and SnTox5. Sensitivity loci for SnTox267 and Ptr ToxB were not detected. Evaluation of the panel with five P. nodorum isolates for SNB development indicated the Snn3-SnTox3 and Tsn1-SnToxA interactions played significant roles in disease development along with additional QTL on chromosomes 2A and 2D, which may correspond to the Snn7-SnTox267 interaction. For tan spot, the Tsc1-Ptr ToxC interaction was associated with disease caused by two isolates, and a novel QTL on chromosome 7D was associated with a third isolate. The Tsn1-ToxA interaction was associated with SNB but not tan spot. Therefore some, but not all, of the previously characterized host gene-NE interactions in these pathosystems play significant roles in disease development in winter wheat. Based on these results, breeders should prioritize the selection of resistance alleles at the Tsc1, Tsn1, Snn3, and Snn7 loci as well as the 2A and 7D QTL to obtain good levels of resistance to SNB and tan spot in winter wheat.
Supplementary information: The online version contains supplementary material available at 10.1007/s11032-023-01400-5.
Keywords: Association mapping; Disease resistance; Necrotrophic effector; Septoria nodorum blotch; Tan spot; Wheat.
© This is a U.S. Government work and not under copyright protection in the US; foreign copyright protection may apply 2023.
Conflict of interest statement
Competing interestsThe authors declare no competing interests.
Figures
References
-
- Adhikari TB, Jackson EW, Gurung S, Hansen JM, Bonman JM. Association mapping of quantitative resistance to Phaeosphaeria nodorum in spring wheat landraces from the USDA National Small Grains Collection. Phytopathology. 2011;101:1301–1310. - PubMed
-
- Ali S, Francl LJ, De Wolf ED. First report of Pyrenophora tritici-repentis Race 5 from North America. Plant Dis. 1999;83:591. - PubMed
-
- Ali S, Gurung S, Adhikari TB. Identification and characterization of novel isolates of Pyrenophora tritici-repentis from Arkansas. Plant Dis. 2010;94:229–235. - PubMed
-
- Ballini E, Tavaud M, Ducasse A, Sanchez D, Paux E, Kitt J, Charmet G, Audigeos D, Roumet P, David J, Morel J. Genome wide association mapping for resistance to multiple fungal pathogens in a panel issued from a broad composite cross-population of tetraploid wheat Triticum turgidum. Euphytica. 2020;216:92.
LinkOut - more resources
Full Text Sources
