Review
. 2023 Jul 17;52(14):4525-4548.
doi: 10.1039/d2cs00464j.

Brightness of fluorescent organic nanomaterials

Affiliations
Review

Brightness of fluorescent organic nanomaterials

Anila Hoskere Ashoka et al. Chem Soc Rev. .

Abstract

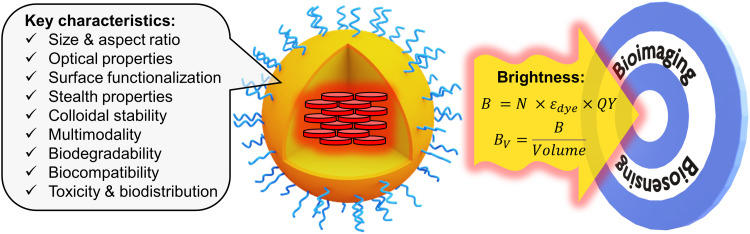
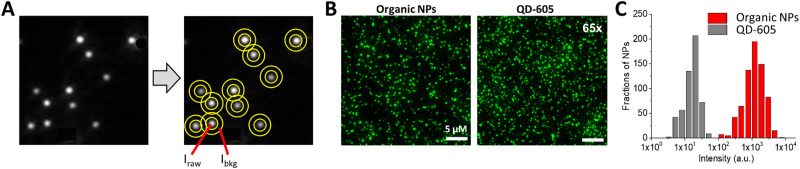
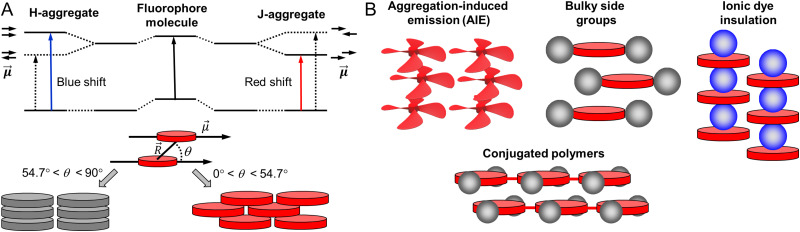
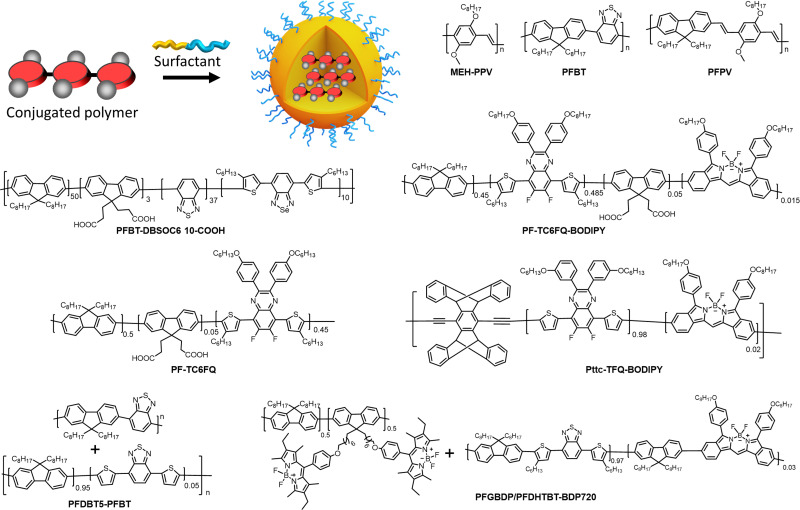
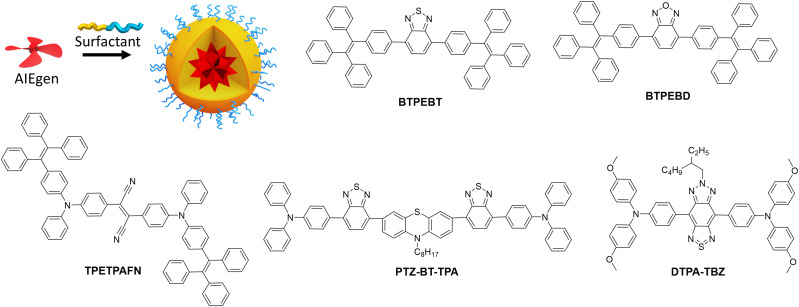
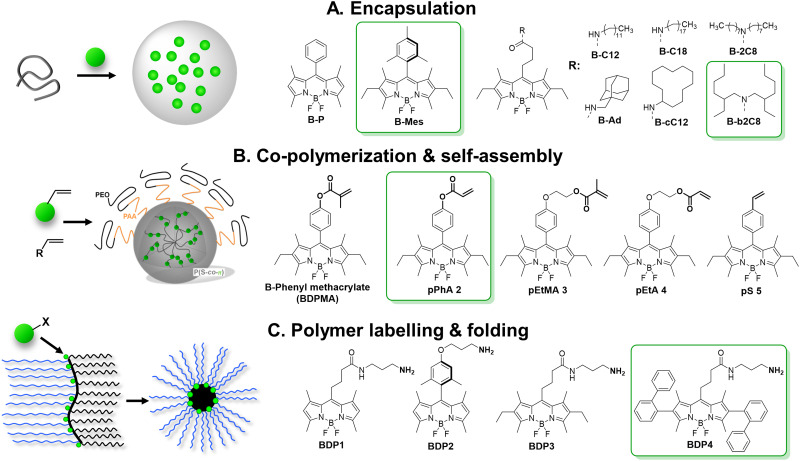
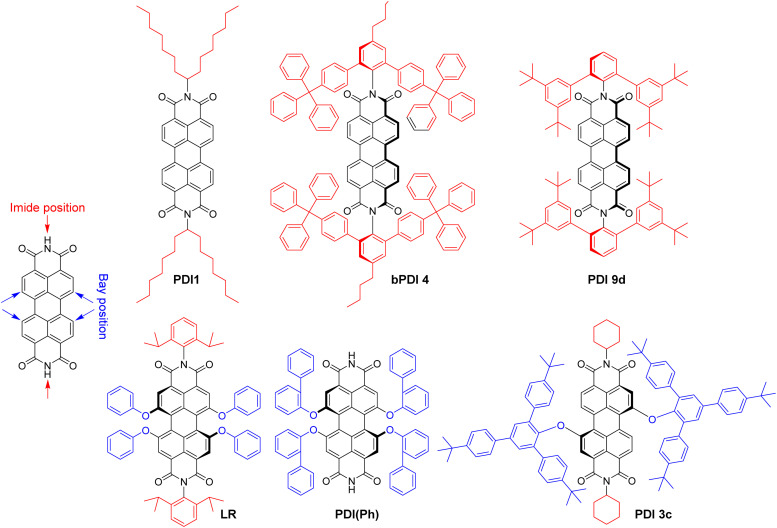
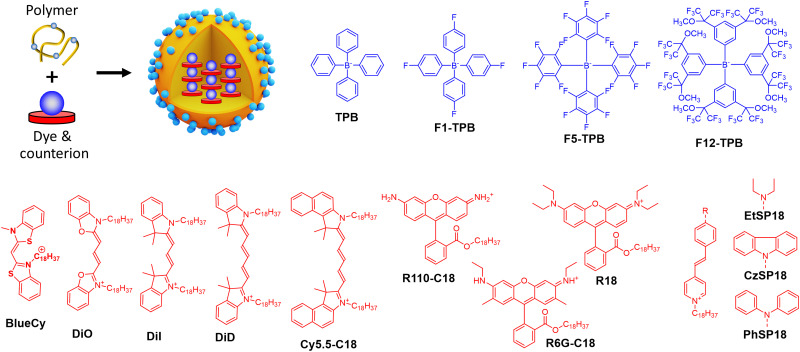
Brightness is a fundamental property of fluorescent nanomaterials reflecting their capacity to absorb and emit light. In sensing materials, brightness is crucial for high-sensitivity (bio)molecular detection, while in optical bioimaging it ensures high spatial and temporal resolution. Fluorescent organic nanoparticles (NPs) are particularly attractive because of their superior brightness compared to organic dyes. With the ever-growing diversity of organic nanomaterials, it is important to establish universal principles for measuring and estimating their brightness. This tutorial review provides definitions of brightness and describes the major approaches to its analysis based on ensemble and single-particle techniques. We present the current chemical approaches to fight Aggregation-Caused Quenching (ACQ) of fluorophores, which is a major challenge in the design of bright organic nanomaterials. The main classes of fluorescent organic NPs are described, including conjugated polymer NPs, aggregation-induced emission NPs, and NPs based on neutral and ionic dyes. Their brightness and other properties are systematically compared. Some brightest examples of bulk solid-state emissive organic materials are also mentioned. Finally, we analyse the importance of brightness and other particle properties in biological applications, such as bioimaging and biosensing. This tutorial will provide guidelines for chemists on the design of fluorescent organic NPs with improved performance and help them to estimate and compare the brightness of new nanomaterials with literature reports. Moreover, it will help biologists to select appropriate materials for sensing and imaging applications.


Conflict of interest statement

A. R. and A. S. K. are co-inventors of a filed patent applications on fluorescent polymeric nanoparticles and cofounders of BrightSens Diagnostics SAS. Other co-authors have no conflict of interest to disclose.

Figures

Fig. 1
Fig. 1. Fluorescent organic NPs, their key characteristics with focus on brightness.
Fig. 2
Fig. 2. Single-particle brightness analysis. (A) Simplified analysis workflow that includes: detection of local maxima, defining and measuring the intensity at regions of interest around maxima (raw signal: Iraw) and around central regions (background: Ibkg). The signal is then obtained by subtraction of the background from the raw signal. (B,C) Example of single-particle imaging by wide-field microscopy (B) and intensity analysis (C) for 20 nm DNA-modified dye-loaded polymeric NPs (organic NPs) vs. reference particles QD-605. In case of QD-605, the source irradiance was increased 65-fold to achieve comparable intensity with organic NPs. Other experimental settings were identical. Excitation wavelength was 550 nm. Panels B and C reproduced with permission from ref. . Copyright American Chemical Society.
Fig. 3
Fig. 3. Principles of dye aggregation based on Kasha's exciton theory (A) and the most established methods to prevent ACQ in fluorescent organic nanomaterials (B).
Fig. 4
Fig. 4. Fluorescent NPs based on conjugated polymers: preparation and their chemical structures.
Fig. 5
Fig. 5. Scheme of preparation of AIE NPs and chemical structure of AIEgens.
Fig. 6
Fig. 6. Schemes of preparation of fluorescent NPs based on BODIPY derivatives. Reproduced with permission from ref. and . Copyright American Chemical Society.
Fig. 7
Fig. 7. Molecular structure of perylene diimides (PDI) with bulky substituents.
Fig. 8
Fig. 8. Dye-loaded polymeric NPs and examples of bulky counterions paired with cationic dyes for the NPs preparation.
Fig. 9
Fig. 9. (A) Visual representation of SMILES concept and cyanostar microcyte and (B) fluorescent dyes insulated with anion-2-cyanostar complex. Panel A reproduced with permission from ref. . Copyright American Chemical Society.
Fig. 10
Fig. 10. Application of bright organic NPs for bioimaging. (A) Tracking 15 nm PFBT Pdots in macrophage-like J774 cells. Left: Transmission image of a fixed cell. The colour marks indicate the locations of NPs: particle bound to the membrane (blue), outside the cell (green), and in the cell interior (red). Right: The trajectories for the three particles. Reproduced with permission from ref. . Copyright American Chemical Society (B) epi-fluorescence and phase-contrast images of HeLa cell microinjected with 32 and 17 nm dye-loaded PMMA-based NPs. Injection points are indicated by arrows. Scale bars, 10 μm. Insets show distributions of particle sizes obtained by TEM. NPs were loaded with 10 wt% of R18/F5-TPB and coated with Tween 80. Reproduced with permission from ref. . Copyright John Wiley and Sons. (C) Tracking transplanted neurons in vivo. D16 hESC-derived neurons were labelled with 30 nm TPETPAFN AIE-NPs for 24 h prior to transplantation into mouse brain striatum. Brain tissues were collected 24 h, 2 weeks, and 1 month post-transplantation. Scale bar: 100 μm, enlarged panel scale bar: 50 μm. Reproduced with permission from ref. . Copyright Elsevier. (D) Principle of cell barcoding by 40 nm dye-loaded polymeric NPs of three different colours: blue, green and red loaded with DiO/F12-TPB, DiI/F12-TPB and DiD/F12-TPB, respectively. (E) Tracking multiple RGB barcoded cell populations. The large micrograph shows a confocal image six cell types (HeLa, KB, 293T, U87, RBL, and CHO) mixed and co-cultured for 24 h. Each cell type was labelled with an RGB barcode (orange, cyan, green, red, magenta, and blue, respectively), also shown separately in the smaller images. Images are superpositions of the three NP channels with identical settings and of the membrane channel in grey. Scale bar is 100 μm. (F) Tracking RGB barcoded cancer cells in zebrafish embryo: six batches of D2A1 cells were labelled with fluorescent NPs generating RGB barcodes (green, red, blue, yellow, magenta, and cyan) and imaged 3 h post-injection. (9 D–F) – Reproduced with permission from ref. . Copyright John Wiley and Sons. (G) Top: Standard TIRF image of immobilized 40 nm dye-loaded NPs (PLGA, 5 wt% R18/F5-TPB); bottom: the same field after applying a super-localization procedure, showing capacity to resolve two particles (scale bar, 200 nm). Reproduced with permission from ref. . Copyright Springer Nature. (H) Dual-color superresolution (SOFI) imaging of subcellular structures labelled with small (10 and 13 nm) photoblinking Pdots. Left: Wide field imaging of clathrin coated pits labeled with PFO (green) Pdots and microtubule labelled with PFTBT5 (red) Pdots. Top right: Magnified region show in white box in left panel. Bottom right: SOFI image generated by analysing 500 frames of raw data from the wide-field image. Reproduced with permission from ref. . Copyright American Chemical Society. (I) STED imaging of the microtubule structures labeled using the AIE NPs (14–16 nm): confocal (left) and super-resolution STED (right) images of the microtubules. Reproduced with permission from ref. . Copyright John Wiley and Sons.
Fig. 11
Fig. 11. Applications of bright NPs for biosensing. (A) Top: FRET based molecular probe showing that the applications are limited to distances around the Förster radius. Bottom: FRET based nanoprobe where large number of donors are coupled due to excitation energy transfer (small yellow arrows) in order to ensure efficient transfer to a single acceptor. (B) Schematic Illustration of Pdot from donor–acceptor conjugated polymer. (C) Photographs of PFOBT36SeTBT5 Pdots with the addition of ClO taken under normal laboratory lighting and illumination with a UV light at 365 nm. (B and C) – Reproduced with permission from ref. . Copyright American Chemical Society. (D) DNA-functionalized dye-loaded polymeric nanoparticle (NP-Probe) for FRET-based detection of nucleic acids by stand displacement principle. R18 and its bulky counterion F5-TPB are also shown. (E) Fluorescence spectral response of NP-probe to the growing concentrations of the nucleic acid target. (F) Colour response of surface-immobilized NP-probe to the nucleic acid target (100 pM) at the single-particle level. (D–F) – Reproduced with permission from ref. . Copyright American Chemical Society.
None
Anila Hoskere Ashoka
None
Ilya O. Aparin
None
Andreas Reisch
None
Andrey S. Klymchenko

References

    1. Grimm J. B. Lavis L. D. Nat. Methods. 2022;19:149–158. doi: 10.1038/s41592-021-01338-6. - DOI - PubMed
    1. Giepmans B. N. G. Adams S. R. Ellisman M. H. Tsien R. Y. Science. 2006;312:217–224. doi: 10.1126/science.1124618. - DOI - PubMed
    1. Lavis L. D. Raines R. T. ACS Chem. Biol. 2008;3:142–155. doi: 10.1021/cb700248m. - DOI - PMC - PubMed
    1. Algar W. R. Massey M. Rees K. Higgins R. Krause K. D. Darwish G. H. Peveler W. J. Xiao Z. Tsai H.-Y. Gupta R. Lix K. Tran M. V. Kim H. Chem. Rev. 2021;121:9243–9358. doi: 10.1021/acs.chemrev.0c01176. - DOI - PubMed
    1. Reisch A. Klymchenko A. S. Small. 2016;12:1968–1992. doi: 10.1002/smll.201503396. - DOI - PMC - PubMed

LinkOut - more resources