Inhibition of MEG3 ameliorates cardiomyocyte apoptosis and autophagy by regulating the expression of miRNA-129-5p in a mouse model of heart failure
- PMID: 37338021
- PMCID: PMC10286679
- DOI: 10.1080/13510002.2023.2224607
Inhibition of MEG3 ameliorates cardiomyocyte apoptosis and autophagy by regulating the expression of miRNA-129-5p in a mouse model of heart failure
Abstract
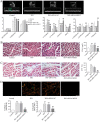
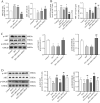
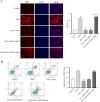
The long non-coding RNA, maternally expressed gene 3 (MEG3), are involved in myocardial fibrosis and compensatory hypertrophy, but its role on cardiomyocyte apoptosis and autophagy in heart failure (HF) remains unclear. The aim of this study was to investigate the effect of MEG3 on cardiomyocyte apoptosis and autophagy and the underlying mechanism. A mouse model of HF was established by subcutaneous injection of isoproterenol (ISO) for 14 days, and an in vitro oxidative stress injury model was replicated with H2O2 for 6 h. SiRNA-MEG3 was administered in mice and in vitro cardiomyocytes to knock down MEG3 expression. Our results showed that cardiac silencing of MEG3 can significantly ameliorate ISO-induced cardiac dysfunction, hypertrophy, oxidative stress, apoptosis, excessive autophagy and fibrosis induced by ISO. In addition, inhibition of MEG3 attenuated H2O2-induced cardiomyocyte oxidative stress, apoptosis and autophagy in vitro. Downregulation of MEG3 significantly inhibited excessive cardiomyocyte apoptosis and autophagy induced by ISO and H2O2 through miRNA-129-5p/ATG14/Akt signaling pathways, and reduced H2O2-induced cardiomyocyte apoptosis by inhibiting autophagy. In conclusion, inhibition of MEG3 ameliorates the maladaptive cardiac remodeling induced by ISO, probably by targeting the miRNA-129-5p/ATG14/Akt signaling pathway and may provide a tool for pharmaceutical intervention.
Keywords: ATG14; Heart failure; ISO; MEG3; apoptosis; autophagy; miRNA-129-5p; oxidative stress.
Conflict of interest statement
No potential conflict of interest was reported by the author(s).
Figures


Similar articles
-
ETS2 promotes cardiomyocyte apoptosis and autophagy in heart failure by regulating lncRNA TUG1/miR-129-5p/ATG7 axis.FASEB J. 2023 Jun;37(6):e22937. doi: 10.1096/fj.202202148RR. FASEB J. 2023. PMID: 37171262
-
MiR-129-5p inhibits autophagy and apoptosis of H9c2 cells induced by hydrogen peroxide via the PI3K/AKT/mTOR signaling pathway by targeting ATG14.Biochem Biophys Res Commun. 2018 Nov 17;506(1):272-277. doi: 10.1016/j.bbrc.2018.10.085. Epub 2018 Oct 19. Biochem Biophys Res Commun. 2018. PMID: 30348524
-
Adiponectin modulates oxidative stress-induced autophagy in cardiomyocytes.PLoS One. 2013 Jul 19;8(7):e68697. doi: 10.1371/journal.pone.0068697. Print 2013. PLoS One. 2013. PMID: 23894332 Free PMC article.
-
Role of noncoding RNAs in regulation of cardiac cell death and cardiovascular diseases.Cell Mol Life Sci. 2018 Jan;75(2):291-300. doi: 10.1007/s00018-017-2640-8. Epub 2017 Sep 14. Cell Mol Life Sci. 2018. PMID: 28913665 Free PMC article. Review.
-
LncRNA MEG3: Potential stock for precision treatment of cardiovascular diseases.Front Pharmacol. 2022 Nov 29;13:1045501. doi: 10.3389/fphar.2022.1045501. eCollection 2022. Front Pharmacol. 2022. PMID: 36523500 Free PMC article. Review.
Cited by
-
Multimodal Learning for Mapping the Genotype-Phenotype Dynamics.Res Sq [Preprint]. 2024 May 16:rs.3.rs-4355413. doi: 10.21203/rs.3.rs-4355413/v1. Res Sq. 2024. Update in: Nat Comput Sci. 2025 Apr;5(4):333-344. doi: 10.1038/s43588-024-00765-7. PMID: 38798675 Free PMC article. Updated. Preprint.
-
Research progress of cPLA2 in cardiovascular diseases (Review).Mol Med Rep. 2025 Apr;31(4):103. doi: 10.3892/mmr.2025.13468. Epub 2025 Feb 21. Mol Med Rep. 2025. PMID: 39981923 Free PMC article. Review.
-
Cardiovascular diseases in the elderly: possibilities for modulating autophagy using non-coding RNAs.Front Cell Dev Biol. 2025 Jul 31;13:1520850. doi: 10.3389/fcell.2025.1520850. eCollection 2025. Front Cell Dev Biol. 2025. PMID: 40823532 Free PMC article. Review.
-
Cardiomyocyte Autophagy: A Novel Therapeutic Target by LncRNA PART1.Korean Circ J. 2024 May;54(5):253-255. doi: 10.4070/kcj.2024.0114. Korean Circ J. 2024. PMID: 38767338 Free PMC article. No abstract available.
-
The function of miRNAs in the immune system's inflammatory reaction to heart failure.Front Cardiovasc Med. 2024 Dec 2;11:1506836. doi: 10.3389/fcvm.2024.1506836. eCollection 2024. Front Cardiovasc Med. 2024. PMID: 39687084 Free PMC article. Review.
References
-
- Zhou XM, Liu J, Wang Y, et al. . Silencing of long noncoding RNA MEG3 enhances cerebral protection of dexmedetomidine against hypoxic-ischemic brain damage in neonatal mice by binding to miR-129-5p. J Cell Biochem. 2018. - PubMed
MeSH terms
Substances
LinkOut - more resources
Full Text Sources
Medical
Research Materials
Miscellaneous
