. 2023 Aug 17;11(4):e0366422.
doi: 10.1128/spectrum.03664-22. Epub 2023 Jun 20.

Mechanisms of Qingyi Decoction in Severe Acute Pancreatitis-Associated Acute Lung Injury via Gut Microbiota: Targeting the Short-Chain Fatty Acids-Mediated AMPK/NF-κB/NLRP3 Pathway

Affiliations

Mechanisms of Qingyi Decoction in Severe Acute Pancreatitis-Associated Acute Lung Injury via Gut Microbiota: Targeting the Short-Chain Fatty Acids-Mediated AMPK/NF-κB/NLRP3 Pathway

Zhengjian Wang et al. Microbiol Spectr. .

Abstract

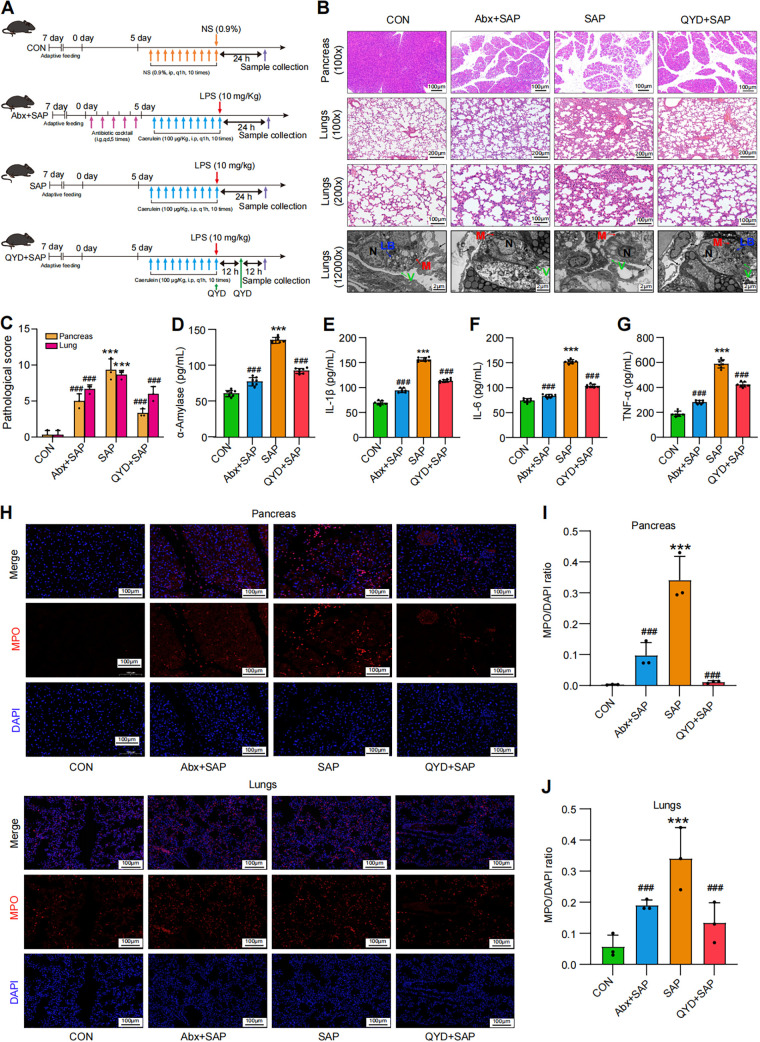
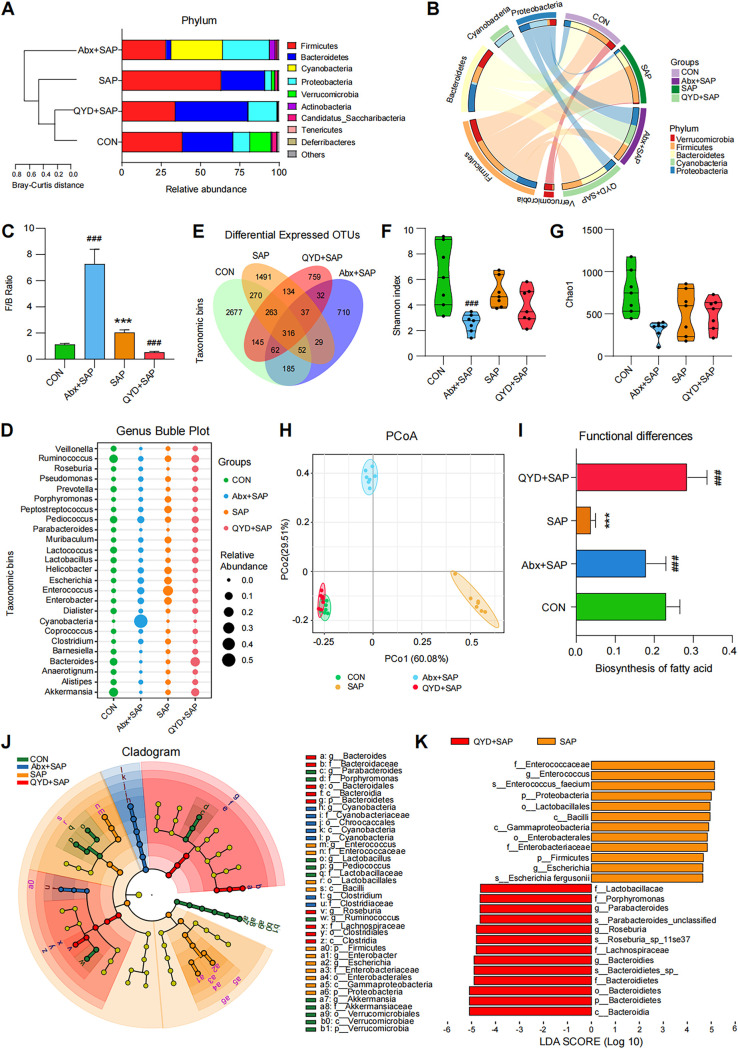
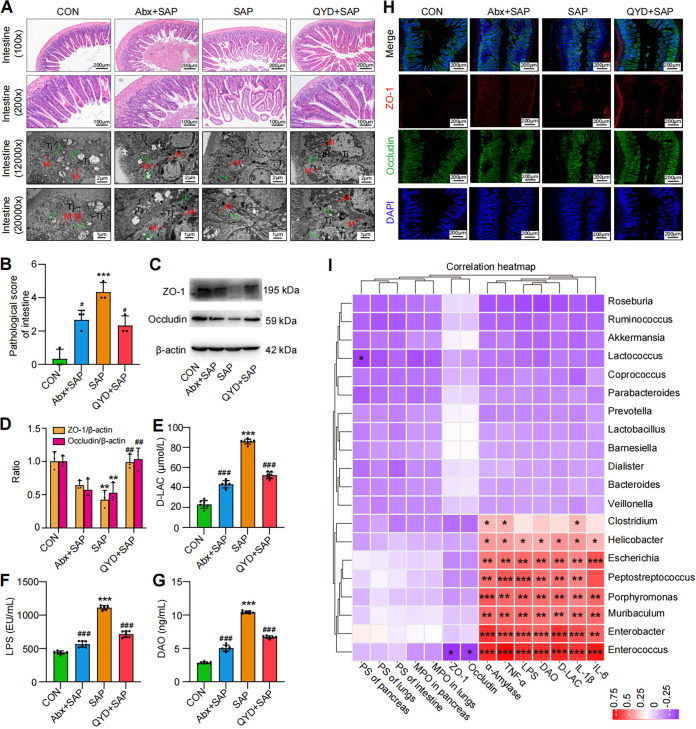
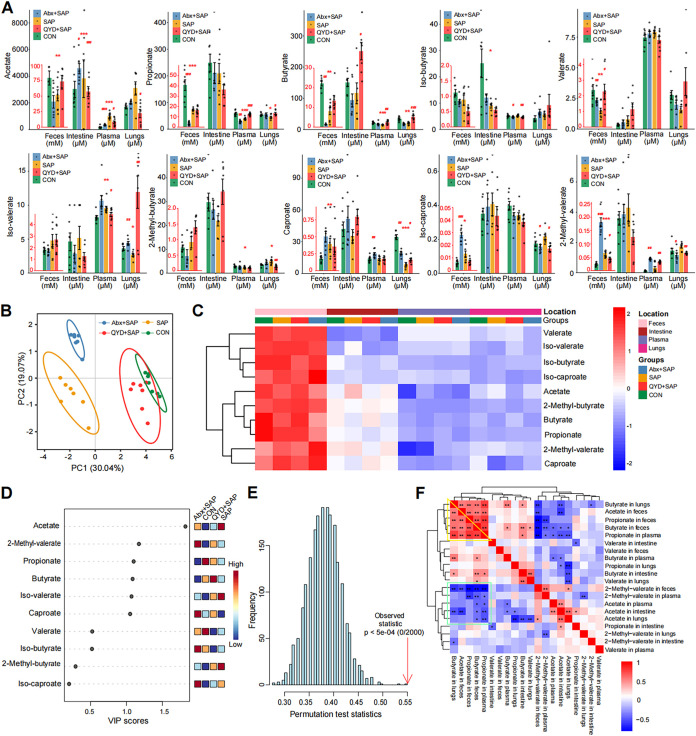
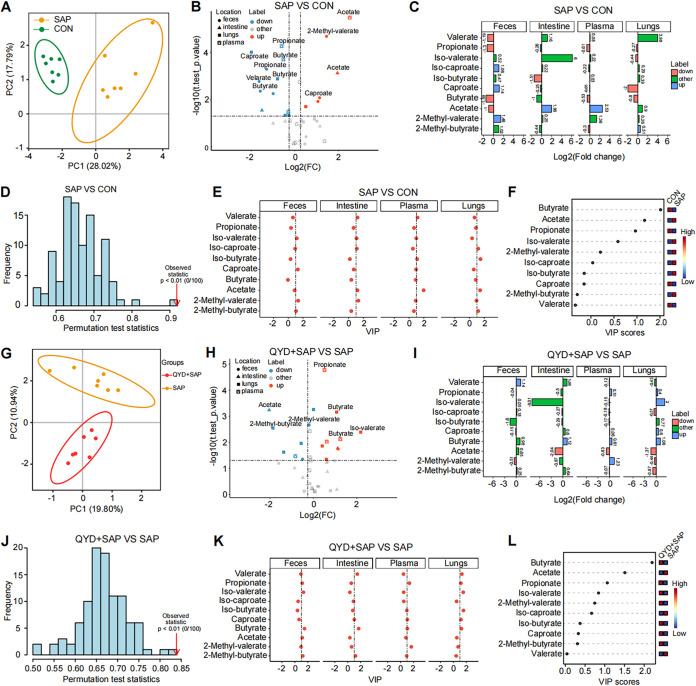
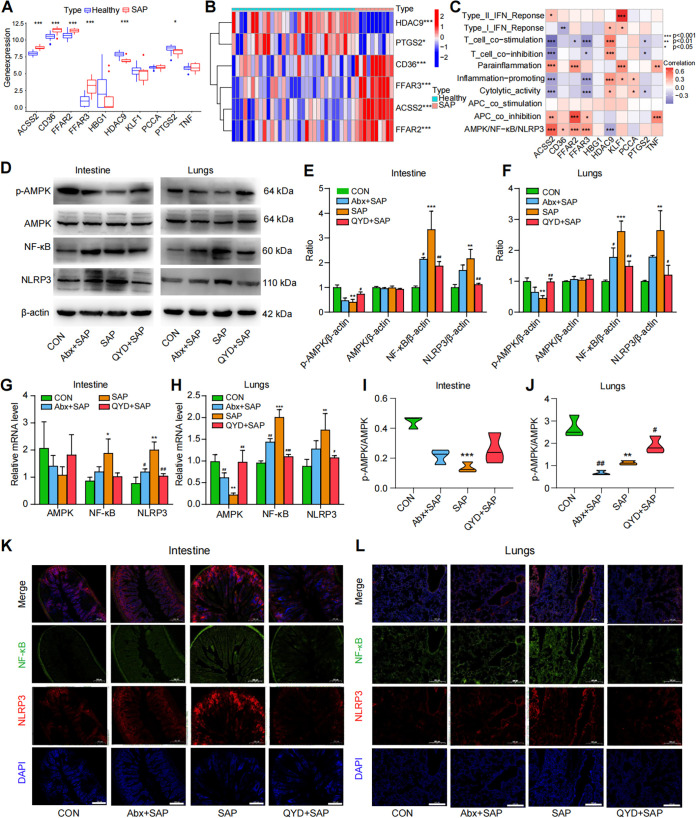
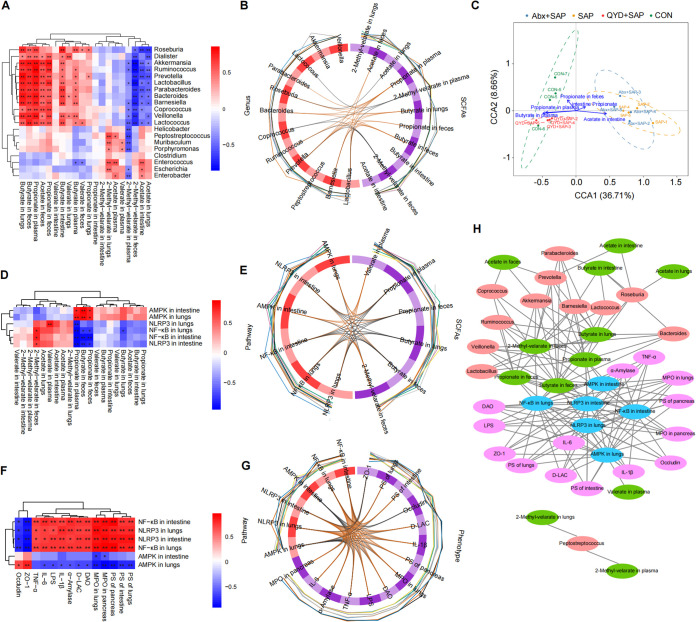
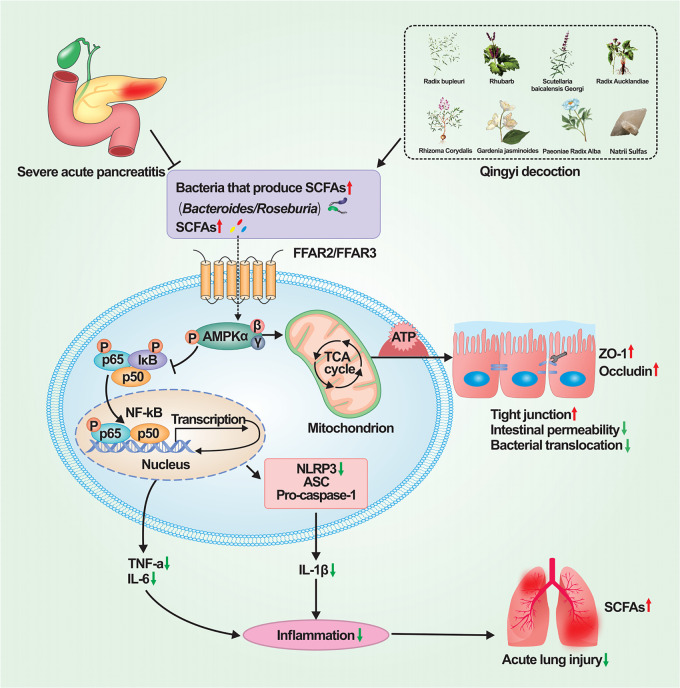
The pivotal roles of gut microbiota in severe acute pancreatitis-associated acute lung injury (SAP-ALI) are increasingly revealed, and recent discoveries in the gut-lung axis have provided potential approaches for treating SAP-ALI. Qingyi decoction (QYD), a traditional Chinese medicine (TCM), is commonly used in clinical to treat SAP-ALI. However, the underlying mechanisms remain to be fully elucidated. Herein, by using a caerulein plus lipopolysaccharide (LPS)-induced SAP-ALI mice model and antibiotics (Abx) cocktail-induced pseudogermfree mice model, we tried to uncover the roles of the gut microbiota by administration of QYD and explored its possible mechanisms. Immunohistochemical results showed that the severity of SAP-ALI and intestinal barrier functions could be affected by the relative depletion of intestinal bacteria. The composition of gut microbiota was partially recovered after QYD treatment with decreased Firmicutes/Bacteroidetes ratio and increased relative abundance in short-chain fatty acids (SCFAs)-producing bacteria. Correspondingly increased levels of SCFAs (especially propionate and butyrate) in feces, gut, serum, and lungs were observed, generally consistent with changes in microbes. Western-blot analysis and RT-qPCR results indicated that the AMPK/NF-κB/NLRP3 signaling pathway was activated after oral administration of QYD, which was found to be possibly related to the regulatory effects on SCFAs in the intestine and lungs. In conclusion, our study provides new insights into treating SAP-ALI through modulating the gut microbiota and has prospective practical value for clinical use in the future. IMPORTANCE Gut microbiota affects the severity of SAP-ALI and intestinal barrier function. During SAP, a significant increase in the relative abundance of gut pathogens (Escherichia, Enterococcus, Enterobacter, Peptostreptococcus, Helicobacter) was observed. At the same time, QYD treatment decreased pathogenic bacteria and increased the relative abundance of SCFAs-producing bacteria (Bacteroides, Roseburia, Parabacteroides, Prevotella, Akkermansia). In addition, The AMPK/NF-κB/NLRP3 pathway mediated by SCFAs along the gut-lung axis may play an essential role in preventing the pathogenesis of SAP-ALI, which allows for reduced systemic inflammation and restoration of the intestinal barrier.

Keywords: AMPK/NF-κB/NLRP3 pathway.; Qingyi decoction; gut microbiota; gut-lung axis; severe acute pancreatitis-associated acute lung injury; short-chain fatty acids.


Conflict of interest statement

The authors declare no conflict of interest.

Figures

FIG 1
FIG 1
Relative depletion of intestinal bacteria influenced the severity of SAP-ALI, while QYD treatment alleviated the pathological damage to pancreatic and lung tissue as well as the systemic inflammatory response in the caerulein combined with the LPS-induced SAP-ALI model in mice. (A) Overall experimental design and grouping. (B) Representative H&E staining of pancreas and lungs. Samples used microscopy (100× and 200× magnification) and transmission electron microscopy (original magnification, 12,000×). LB: lamellar bodies, M: mitochondria, N: nuclear, V: villus; black arrow: air-blood barrier. (C) Pathological damage score of pancreas and lungs. (D to G) Serum expressional levels of α-amylase, IL-1β, IL-6, TNF-α by ELISA. (H) Immunofluorescence staining results for MPO (red), nucleus (DAPI, blue), and merged images in pancreas and lungs. Scale bar: 100 μm. (I to J) Semiquantitative results of MPO in pancreas and lungs. Data are representative images or shown as mean ± SEM for each group of mice (n = 7 per group) with at least three independent experiments and analyzed by unpaired Student's t test with ***, P < 0.001 in comparison with the CON group and ###, P < 0.001 in comparison with the SAP group.
FIG 2
FIG 2
Composition and functional analysis of gut microbiota based on 16S rRNA sequencing. (A) Stacking plot analysis of bacteria at the phylum level using Bray-Curtis distance for clustering aims to show the proportion of the top 10 species in the ranking and the changing trend. (B) Circos diagram of each group at the phylum level (top 5). (C) The ratio of Firmicutes to Bacteroidetes at the phylum level. (D) Bubble plot of bacteria at the genus level in different groups. (E) Venn diagram based on the abundance of OTUs. The numbers represent the values of OTUs that can be detected in all mice in a group. (F and G) Alpha-diversity analysis of intestinal bacteria at the genus level (Shannon index, Chao1). (H) PCoA plot based on weighted Unifrac distance matrix analysis of the top 25 bacteria. (I) Histogram of differences in fatty acid synthesis based on PICRUSt2 functional predictions. (J-K) Cladogram and distribution histograms showing the results of LEfSe analysis. Data are shown as mean ± SEM (n = 7 per group) and analyzed by unpaired Student's t test with ***, P < 0.001 in comparison with the CON group and ###, P < 0.001 in comparison with the SAP group.
FIG 3
FIG 3
Abx intervention affected intestinal barrier function, while QYD treatment increased intestinal barrier protein expression and decreased intestinal permeability. (A) Representative H&E staining of intestine samples via microscope (100× and 200× magnification) and transmission electron microscopy (12,000× and ×20,000 magnification). L: lysosomal, M: mitochondria, Tj: tight junction. (B) The pathological score of the intestine (ileum). (C) Representative Western blotting images of ZO-1 and occludin. (D) Relative expression ratio of ZO-1/β-actin and occluding/β-actin. (E to G) Concentrations of d-LAC, LPS, and DAO in serum. (H) Immunofluorescence staining results for ZO-1 (red), occludin (green), and DAPI (blue), as well as merged images. Scale bar: 100 μm. (I) Heatmap of the correlations between intestinal bacteria (genus level) and pathological indices of SAP-ALI based on Spearman's correlation analysis. PS: pathological score. Data are representative images or shown as mean ± SEM for each group of mice (n = 7 per group) with at least three independent experiments and analyzed by unpaired Student's t test. *, P < 0.05; **, P < 0.01; ***, P < 0.001 in comparison with the CON group and #, P < 0.05; ##, P < 0.01; ###, P < 0.001 in comparison with the SAP group.
FIG 4
FIG 4
Differences in the concentration of SCFAs in sites related to the gut-lung axis among the groups. (A) The histogram of SCFAs concentrations in plasma, feces, lungs, and intestine. (B) PCA analysis of SCFAs was performed and shown in a circle plot according to a 95% confidence interval (CI). (C) Heatmap of SCFAs in different groups under different sample types. (D) The VIP score calculated by MetaboAnalyst (V5.0) with a score higher than 1 indicates that the SCFA is representative of the subgroup. (E) Construction of the PLS-DA model, and a P < 0.05 indicates an ideal model fit. (F) Correlation heatmap of SCFAs under different sample types and groups was drawn according to the Spearman correlation analysis. Data are shown as mean ± SEM for each group of mice (n = 7 per group) and analyzed by unpaired Student's t test. *, P < 0.05; **, P < 0.01; ***, P < 0.001 in comparison with the CON group and #, P < 0.05; ##, P < 0.01; ###, P < 0.001 in comparison with the SAP group.
FIG 5
FIG 5
Pairwise comparison results of SCFAs in different groups. (A, G) PCA analysis of SCFAs in each group. (B, H) Volcano plot of SCFAs in each group. (C, I) Fold change plots of SCFAs in feces, plasma, intestine, and lungs of each group. (D, J) Permutation test charts of SCFAs using the PLS-DA model, and a P < 0.05 indicates an ideal model fit. (E, K) The VIP score of SCFAs in feces, intestine, plasma, and lungs of each group. (F, L) The total VIP scores of SCFAs were calculated in each group.
FIG 6
FIG 6
QYD may alleviate SAP-ALI through the SCFAs-mediated AMPK/NF-κB/NLRP3 pathway. (A) Boxplots of the differences in the relevant genes (GeneCards TOP 10) of SCFAs in SAP patients and control subjects based on the GEO database. (B) Heatmap of differences in genes related to SCFAs between SAP patients and controls based on GEO data set analysis. (C) Heatmap and Spearman’s correlation test of the enrichment scores for different pathways with SCFAs-related genes (GeneCards TOP 10) in SAP patients (by ssGSEA analysis) based on the GEO data set. (D) Representative Western blotting images of p-AMPK, AMPK, NF-κB, and NLRP3 in the intestine and lungs. (E and F) Relative expression ratios of p-AMPK, AMPK, NF-κB, and NLRP3 with β-actin in the intestine and lungs. (G and H) Relative AMPK, NF-κB, and NLRP3 mRNA levels in the intestine and lungs. (I and J) Relative expression ratio of p-AMPK to AMPK in the intestine and lungs. (K and L) Immunofluorescence staining results for NF-κB (green), NLRP3 (red), and DAPI (blue) in intestine and lungs, as well as their merged images. Scale bar: 100 μm. Data are representative images with at least three independent experiments and analyzed by unpaired Student's t test. *, P < 0.05; **, P < 0.01; ***, P < 0.001 in comparison with the CON group and #, P < 0.05; ##, P < 0.01; ###, P < 0.001 in comparison with the SAP group.
FIG 7
FIG 7
Correlation analysis between intestinal bacteria, SCFAs, AMPK/NF-κB/NLRP3 pathway, and SAP-ALI phenotype. (A) Heatmap of the correlation between intestinal bacteria and SCFAs based on Spearman correlation analysis. (B) Chord diagram of the correlations between the gut microbiome and SCFAs based on the block.splsda function analysis, the line in the circle represents the correlation coefficient between the bacteria and SCFAs greater or equal to 0.6. (C) CCA analysis. Arrows indicate SCFAs at different sites, dots indicate different samples, and the length of the arrow indicates the degree of correlation between SCFAs and the microbiota in that subgroup. (D) Heatmap of the correlations between SCFAs and the AMPK/NF-κB/NLRP3 pathway. (E) Chord diagram of the correlations between SCFAs and the AMPK/NF-κB/NLRP3 pathway. (F) Heatmap of the correlations between the AMPK/NF-κB/NLRP3 pathway and disease phenotypes of SAP-ALI. (G) Correlation chord diagram of the AMPK/NF-κB/NLRP3 pathway with disease phenotypes of SAP-ALI. (H) Network diagram showing intestinal bacteria, SCFAs, AMPK/NF-κB/NLRP3 pathways, and SAP-ALI disease phenotypes. Connected lines represent correlations greater than 0.6, with P < 0.05. The asterisks in the heatmaps represent significance level. *, P < 0.05; **, P < 0.01.
FIG 8
FIG 8
Mechanisms of Qingyi decoction in alleviating SAP-ALI via gut microbiota, which is probably associated with short-chain fatty acids-mediated AMPK/NF-κB/NLRP3 pathway. QYD treatment increased the relative abundance of SCFAs-producing bacteria, which would lead to a relative increase in the production of SCFAs. Combining SCFAs with G protein-coupled receptors in intestine and lungs cells can cause phosphorylation of AMPK, thereby inhibiting the expression of downstream target proteins NF-κB and NLRP3, and ultimately reducing histopathological damage and strengthening the intestinal barrier function, inhibiting the systemic sustained proinflammatory response to relieve SAP-ALI. AMPK, AMP (AMP)-activated protein kinase; ASC, apoptosis-associated speck-like protein; ATP, adenosine 5′-triphosphate; FFAR, free fatty acid receptor; IκB, inhibitors of kappaB; NLRP3, NOD-like receptor family pyrin domain containing 3; P, phosphorylation; p50, NF-kappa B1; p65, NF-kappa B RelA; SCFAs: short-chain fatty acids; TCA, tricarboxylic acid cycle; SAP-ALI, severe acute pancreatitis associated acute lung injury; ZO-1, zonula occludens-1.

References

    1. Kiss L, Fűr G, Pisipati S, Rajalingamgari P, Ewald N, Singh V, et al. 2023. Mechanisms linking hypertriglyceridemia to acute pancreatitis. Acta Physiol (Oxf) e13916. doi: 10.1111/apha.13916. - DOI - PubMed
    1. Lou D, Shi K, Li H-P, Zhu Q, Hu L, Luo J, Yang R, Liu F. 2022. Quantitative metabolic analysis of plasma extracellular vesicles for the diagnosis of severe acute pancreatitis. J Nanobiotechnology 20:52. doi: 10.1186/s12951-022-01239-6. - DOI - PMC - PubMed
    1. Wu J, Zhang J, Zhao J, Chen S, Zhou T, Xu J. 2021. Treatment of severe acute pancreatitis and related lung injury by targeting gasdermin D-mediated pyroptosis. Front Cell Dev Biol 9:780142. doi: 10.3389/fcell.2021.780142. - DOI - PMC - PubMed
    1. Jin M, Zhang H, Wu M, Wang Z, Chen X, Guo M, Zhou R, Yang H, Qian J. 2022. Colonic interleukin-22 protects intestinal mucosal barrier and microbiota abundance in severe acute pancreatitis. FASEB J 36:e22174. doi: 10.1096/fj.202101371R. - DOI - PubMed
    1. Ge P, Luo Y, Okoye CS, Chen H, Liu J, Zhang G, Xu C, Chen H. 2020. Intestinal barrier damage, systemic inflammatory response syndrome, and acute lung injury: a troublesome trio for acute pancreatitis. Biomed Pharmacother 132:110770. doi: 10.1016/j.biopha.2020.110770. - DOI - PubMed

Publication types

MeSH terms