. 2023 Jun 27;120(26):e2221744120.
doi: 10.1073/pnas.2221744120. Epub 2023 Jun 20.

Single-cell transcriptomic profiling of the mouse cochlea: An atlas for targeted therapies

Affiliations

Single-cell transcriptomic profiling of the mouse cochlea: An atlas for targeted therapies

Philippe Jean et al. Proc Natl Acad Sci U S A. .

Abstract

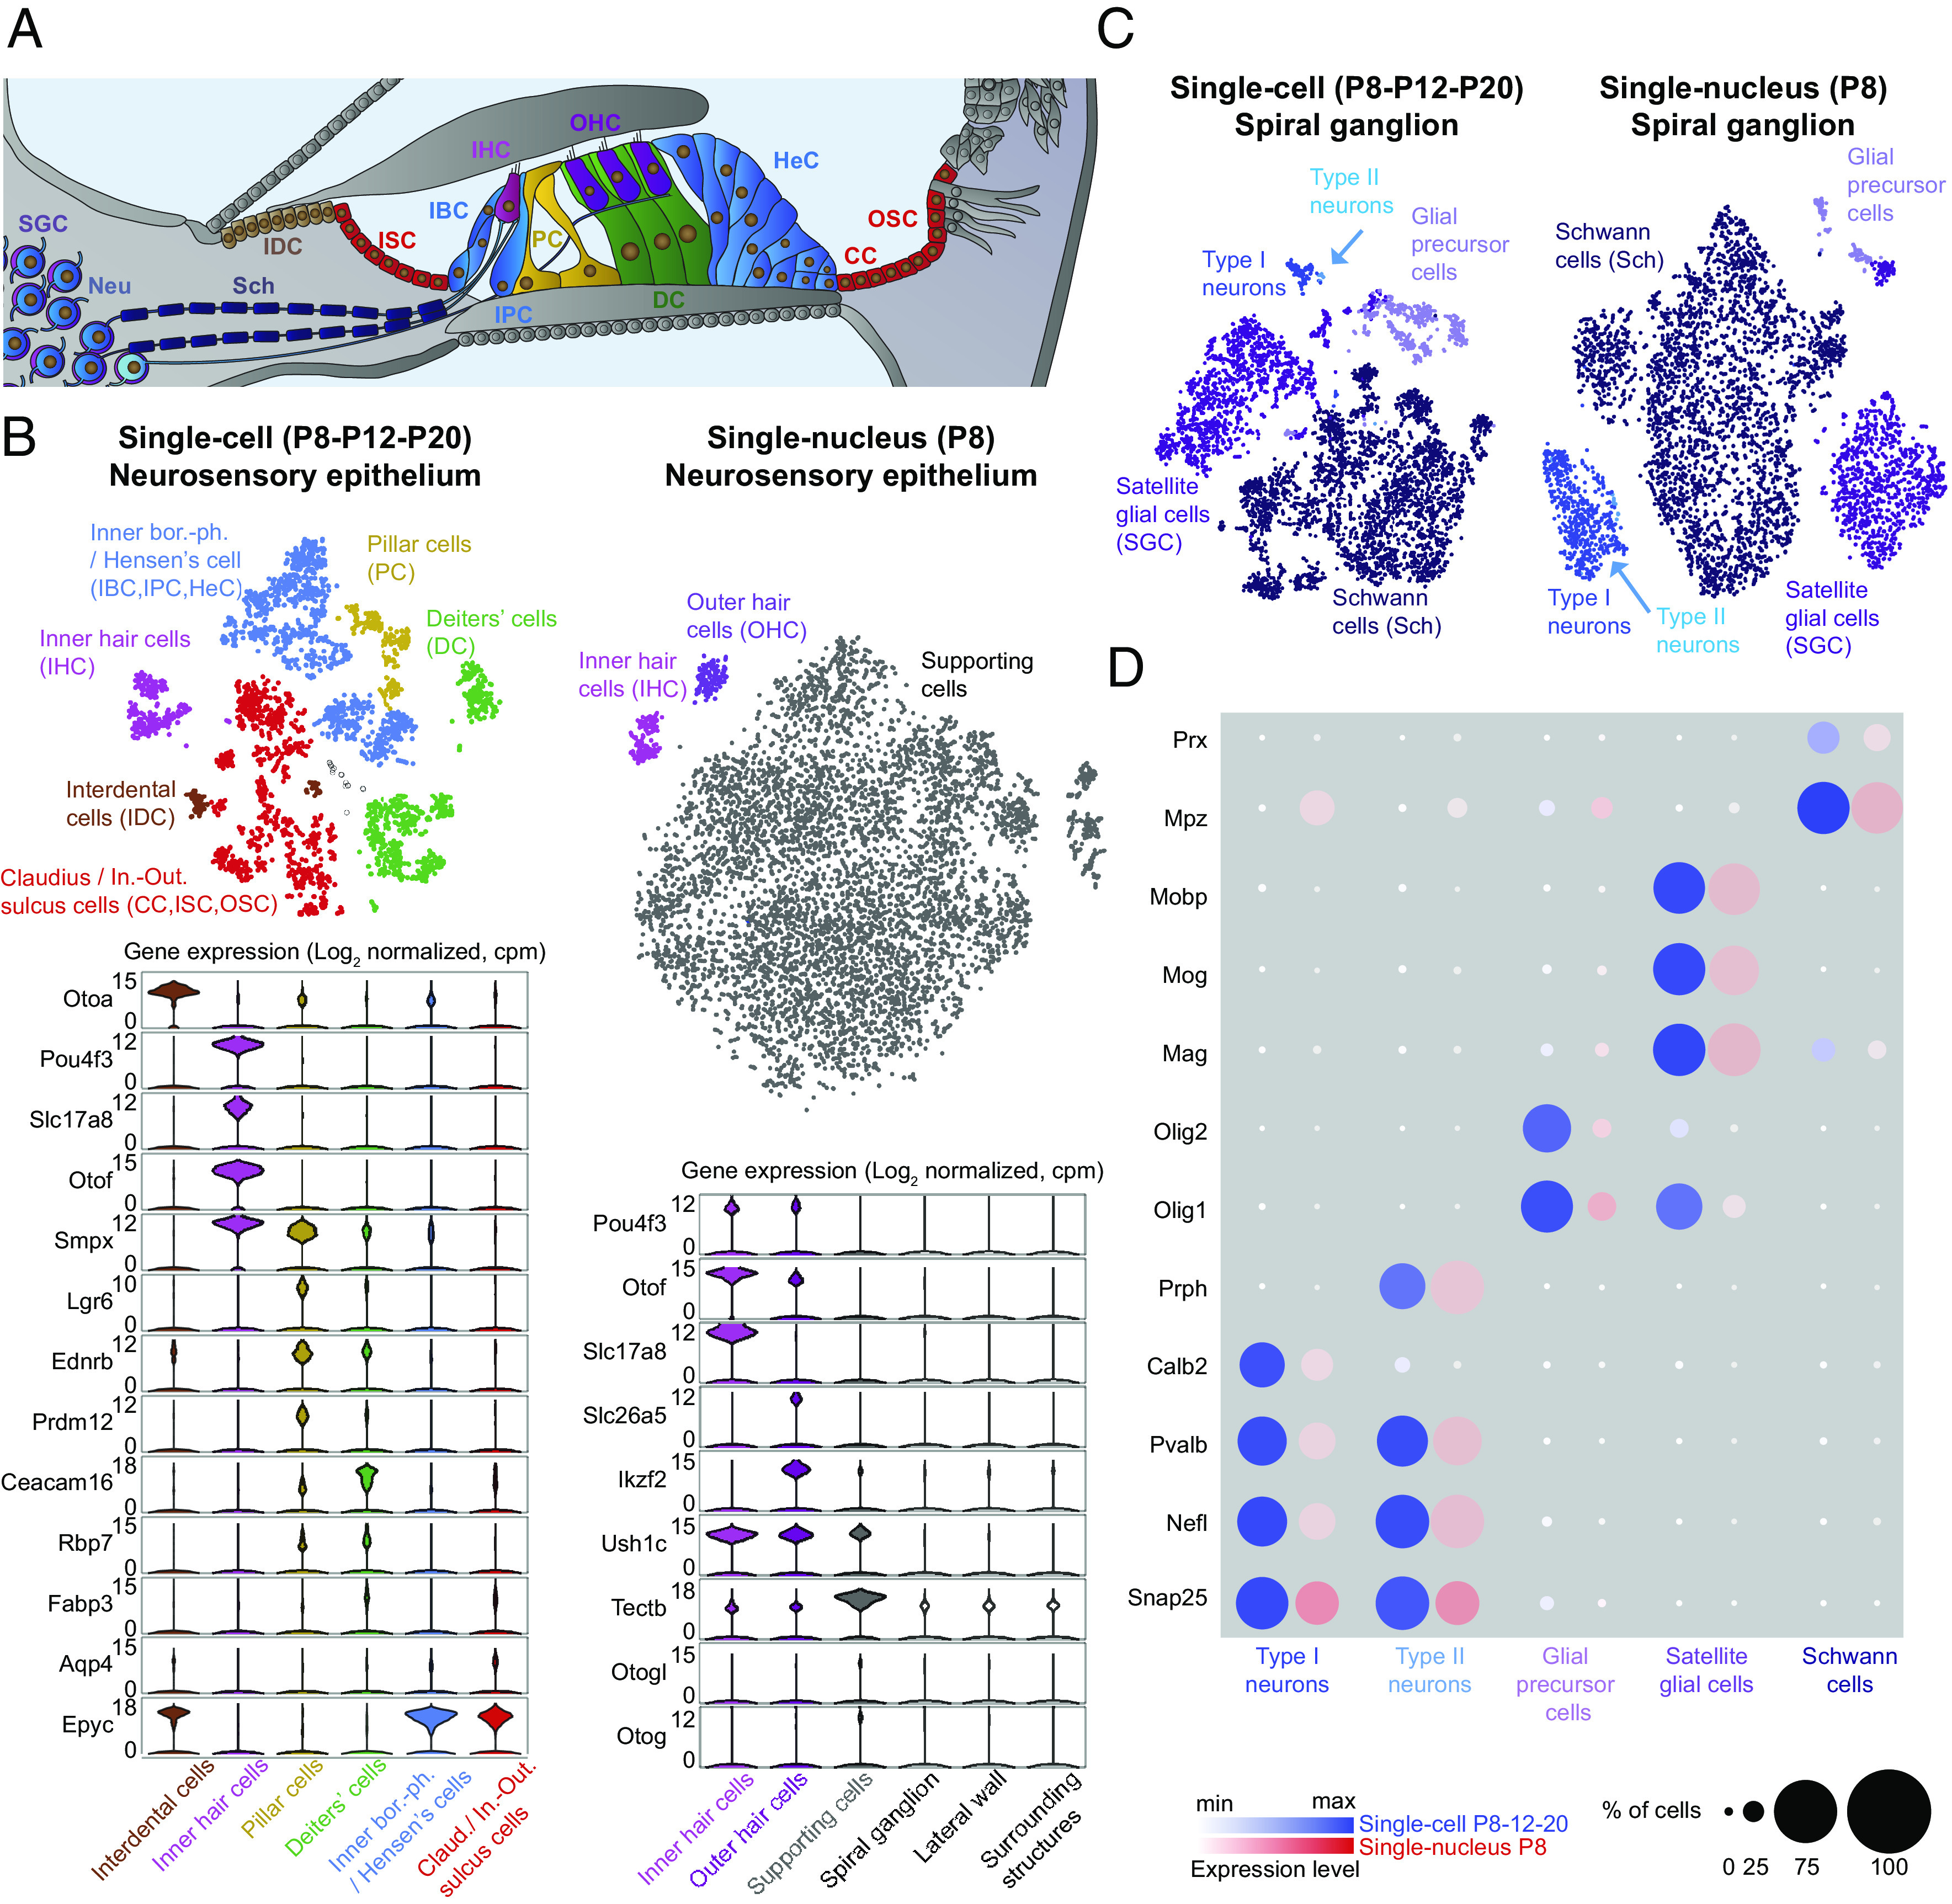
Functional molecular characterization of the cochlea has mainly been driven by the deciphering of the genetic architecture of sensorineural deafness. As a result, the search for curative treatments, which are sorely lacking in the hearing field, has become a potentially achievable objective, particularly via cochlear gene and cell therapies. To this end, a complete inventory of cochlear cell types, with an in-depth characterization of their gene expression profiles right up to their final differentiation, is indispensable. We therefore generated a single-cell transcriptomic atlas of the mouse cochlea based on an analysis of more than 120,000 cells on postnatal day 8 (P8), during the prehearing period, P12, corresponding to hearing onset, and P20, when cochlear maturation is almost complete. By combining whole-cell and nuclear transcript analyses with extensive in situ RNA hybridization assays, we characterized the transcriptomic signatures covering nearly all cochlear cell types and developed cell type-specific markers. Three cell types were discovered; two of them contribute to the modiolus which houses the primary auditory neurons and blood vessels, and the third one consists in cells lining the scala vestibuli. The results also shed light on the molecular basis of the tonotopic gradient of the biophysical characteristics of the basilar membrane that critically underlies cochlear passive sound frequency analysis. Finally, overlooked expression of deafness genes in several cochlear cell types was also unveiled. This atlas paves the way for the deciphering of the gene regulatory networks controlling cochlear cell differentiation and maturation, essential for the development of effective targeted treatments.

Keywords: cochlea; gene therapy; hearing; tonotopy; transcriptomics.


Conflict of interest statement

C.P. is a member of the scientific advisory board of Sensorion. There is no associated honorarium.

Figures

Fig. 1.
Fig. 1.
Transcriptomic characterization of cochlear cell types. (A) Experimental design of the study. (B, Left) T-SNE plots depicting the scRNAseq (P8-P12-P20) and the snRNAseq (P8) datasets. (B, Right) Diagram of the cochlea depicting the main cell-type ensembles characterized. (C) Bubble plot analysis of the most differentially expressed gene for each cochlear cell type, comparing the scRNAseq and snRNAseq datasets on P8. The expression of Otos is highlighted in red. (D) Top window (scale bar, 500 µm): Z-projection of a P8 whole cochlea cryosection stained with DAPI, immunostained for myosin7a, and stained for Otos mRNA with RNAscope. Bottom window (scale bar, 100 µm): Magnification of the inset showing Otos mRNA detection in the spiral limbus (SL) and lateral wall (LW). OC: organ of Corti.
Fig. 2.
Fig. 2.
Characterization of lateral wall cell types and identification of markers. (A, Top) Diagram illustrating the lateral wall of the cochlea. The transcriptomic data identified the root (Rt) and spindle (Sp) cells; fibrocytes (Fb); and the stria vascularis composed of the marginal (Ms), intermediate (Is), and basal stria (Bs) cells. (A, Bottom) t-SNE plot of the scRNAseq (P8-P12-P20) datasets for the lateral wall cells. (B) Violin plots showing expression levels for a subset of the genes used to classify the cell types. (C) Classification of fibrocytes into five subtypes based on the differential expression of several genes.
Fig. 3.
Fig. 3.
Transcriptomic classification of the neurosensory epithelium and spiral ganglion. (A) Diagram of the cochlea, highlighting the neurosensory epithelium and afferent connections from the ganglion. The transcriptomic data identified one group of cells comprising the inner border (IBC), inner phalangeal (IPC), and Hensen’s (HeC) cells; another group of cells comprising the inner–outer sulcus (ISC-OSC) and Claudius cells (CC); and individual cell types, such as the interdental (IDC), pillar (PC), and Deiter’s cells (DC). The type I and II neurons were characterized together with the satellite glial cells (SGCs) and Schwann cells (Sch). (B) ScRNAseq (P8-P12-P20) (Left) and P8 snRNAseq (Right) datasets for the neurosensory epithelium. (Top) Corresponding t-SNE plots. The black circles correspond to nonassigned cells. (Bottom) Corresponding violin plots showing expression levels for a subset of genes used to classify cell types. (C) t-SNE plots for scRNAseq (P8-P12-P20) and snRNAseq (P8) on neuronal/glial cells. (D) Bubble plot analysis comparing the scRNAseq (P8-P12-P20) and snRNAseq (P8) datasets.
Fig. 4.
Fig. 4.
Transcriptomic characterization of the osseous cell types. (A) t-SNE plot of scRNAseq (P8-P12-P20) (Top) and snRNAseq (P8) (Bottom) datasets for the surrounding structures with the preosteoblasts, osteoblasts, osteocytes, and two unknown cell types referred to as surrounding structures 1 (SS1) and 2 (SS2). The black circles correspond to nonassigned cells. (B) t-SNE plots of scRNAseq data (P8-P12-P20) showing the most differentially expressed genes relating to bone function.
Fig. 5.
Fig. 5.
Uncovery of a cochlear cell type. (A) Diagram of the cochlea, highlighting Reissner’s membrane (RM) cells, the scala vestibuli border (SVB) cells, and the bone-related cells. Left t-SNE plot: scRNAseq (P8-P12-P20) data showing the cell types shown in the diagram. The black circles correspond to nonassigned cells. Middle t-SNE plot: scRNAseq (P8-P12-P20) data showing the expression of Slc26a7, a marker of RM cells. Right t-SNE plot: scRNAseq (P8-P12-P20) datasets showing the expression of Fxyd2 and Kcnk2 colocalizing in the SVB cell cluster. (BLeft t-SNE plot: snRNAseq P8 data showing the cell types shown in the diagram. Right t-SNE plot: snRNAseq P8 data showing the expression of Fxyd2 and Kcnk2 colocalizing in the SVB cell cluster. (C) Heat map/hierarchical clustering of the SVB cells, RM cells, SCs, and fibrocytes. Gene expression levels are presented as Z-scores. (D) Z-projections of a P20 cochlea cryosection stained with DAPI, immunostained for myosin7a, and stained for the Kcnk2 mRNA and Fxyd2 mRNA with RNAscope. Magnifications of the area framed in white, with individual channels shown. (Scale bar, 100 µm.) (E) Serial electron microscopy acquisitions of P1, P8, and P20 cochleae. Magnifications of the areas framed in white are shown. Arrows and asterisk indicate the presence and absence of SVB cells, respectively. (Scale bar, 50 µm.) SL: spiral limbus, RM: Reissner’s membrane, LW: lateral wall, OC: organ of Corti.
Fig. 6.
Fig. 6.
Tonotopic developmental dynamics of tympanic border cells. (A, Top) Diagram of the cochlea highlighting the TBCs. (A, Bottom) t-SNE plots of the scRNAseq (P8-P12-P20) datasets for the surrounding structures and TBCs. The black cells correspond to nonassigned cells. (B) Z-projection of P8 whole-cochlea cryosections stained with DAPI; immunostained for myosin7a; and stained for Emilin2, Notum, and Rarres1 mRNA with RNAscope (scale bar, 500 µm). (C) Z-projection of a P8 whole-mount cochlea, immunostained for myosin7a and stained for Emilin2 mRNA with RNAscope (scale bar, 100 µm). (D) Scatter plots of Emilin2 expression on P8, split into four quartiles (Q1 to Q4) assumed to represent four subregions of the cochlea. (E) Violin plots showing the levels of expression of genes differentially expressed in TBCs (ranked among the most differentially expressed genes, indicated in brackets) classified according to the analysis in D. Means are indicated by bars. A: apex; MA: middle apex; MB: middle base; B: base.
Fig. 7.
Fig. 7.
Cochlear cell expression pattern of nonsyndromic deafness genes. Hierarchical clustering of cochlear cell types and 195 detected deafness/key regulatory genes in scRNAseq (P8, P12, P20) and snRNAseq (P8, OHCs only) data. Highlighted genes are indicated by an arrow. In total, 97 of the 195 deafness/key genes are shown for display purposes. The black frames indicate when genes were removed. Vc: vascular cells, Bs + SS: basal stria cells + surrounding structures, Fb + SS: fibrocytes + surrounding structures, GC: glial cells, Is: intermediate stria cells, SC: supporting cells, Rt/Sp: root cells and spindle cells, Ms: marginal stria cells, HC: hair cells, Neu: neurons.

References

    1. Koffler T., Ushakov K., Avraham K. B., Genetics of hearing loss–Syndromic. Otolaryngol. Clin. North. Am. 48, 1041–1061 (2015). - PMC - PubMed
    1. Maldergem L., Camp G., Deltenre P., “Hearing impairment” in Swaiman’s Pediatric Neurology: Principles and Practice: Sixth Edition (Elsevier, 2017), pp. 43–51.
    1. Akil O., et al. , Restoration of hearing in the VGLUT3 knockout mouse using virally mediated gene therapy. Neuron 75, 283–293 (2012). - PMC - PubMed
    1. Akil O., et al. , Dual AAV-mediated gene therapy restores hearing in a DFNB9 mouse model. Proc. Natl. Acad. Sci. U.S.A. 116, 4496–4501 (2019). - PMC - PubMed
    1. Emptoz A., et al. , Local gene therapy durably restores vestibular function in a mouse model of Usher syndrome type 1G. Proc. Natl. Acad. Sci. U.S.A. 114, 9695–9700 (2017). - PMC - PubMed

Publication types