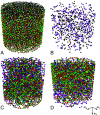
X-ray 3D imaging-based microunderstanding of granular mixtures: Stiffness enhancement by adding small fractions of soft particles
- PMID: 37339218
- PMCID: PMC10293847
- DOI: 10.1073/pnas.2219999120
X-ray 3D imaging-based microunderstanding of granular mixtures: Stiffness enhancement by adding small fractions of soft particles
Abstract
This research focuses on performing ultrasound propagation measurements and micro-X-ray computed tomography (µXRCT) imaging on prestressed granular packings prepared with biphasic mixtures of monodisperse glass and rubber particles at different compositions/fractions. Ultrasound experiments employing piezoelectric transducers, mounted in an oedometric cell (complementing earlier triaxial cell experiments), are used to excite and detect longitudinal ultrasound waves through randomly prepared mixtures of monodisperse stiff/soft particles. While the fraction of the soft particles is increasing linearly from zero, the effective macroscopic stiffness of the granular packings transits nonlinearly and nonmonotonically toward the soft limit, remarkably via an interesting stiffer regime for small rubber fractions between 0.1 ≲ ν ≲ 0.2. The contact network of dense packings, as accessed from µXRCT, plays a key role in understanding this phenomenon, considering the structure of the network, the chain length, the grain contacts, and the particle coordination. While the maximum stiffness is due to surprisingly shortened chains, the sudden drop in elastic stiffness of the mixture packings, at ν ≈ 0.4, is associated with chains of particles that include both glass and rubber particles (soft chains); for ν ≲ 0.3, the dominant chains include only glass particles (hard chains). At the drop, ν ≈ 0.4, the coordination number of glass and rubber networks is approximately four and three, respectively, i.e., neither of the networks are jammed, and the chains need to include particles from another species to propagate information.
Keywords: X-ray computed tomography; granular materials; particles’ contact network; small-strain stiffness; ultrasound waves.
Conflict of interest statement
The authors declare no competing interest.
Figures


References
-
- Daniels K. E., Hayman N. W., Force chains in seismogenic faults visualized with photoelastic granular shear experiments. J. Geophys. Res.: Solid Earth 113, B11411 (2008).
-
- Papadopoulos L., Porter M. A., Daniels K. E., Bassett D. S., Network analysis of particles and grains. J. Complex Networks 6, 485–565 (2018).
-
- Behringer R., et al. , Statistical properties of granular materials near jamming. J. Stat. Mech.: Theory Exp. 2014, P06004 (2014).
-
- Luding S., Taghizadeh K., Cheng C., Kondic L., Understanding slow compression and decompression of frictionless soft granular matter by network analysis. Soft Matter 18, 1868–1884 (2022). - PubMed
-
- Aki K., Richards P. G., Quantitative Seismology (University Science Books, California, 2002).
Grants and funding
LinkOut - more resources
Full Text Sources
Research Materials

