. 2023 Sep 21;142(12):1056-1070.
doi: 10.1182/blood.2022019047.

Epichaperome inhibition targets TP53-mutant AML and AML stem/progenitor cells

Affiliations

Epichaperome inhibition targets TP53-mutant AML and AML stem/progenitor cells

Bing Z Carter et al. Blood. .

Abstract

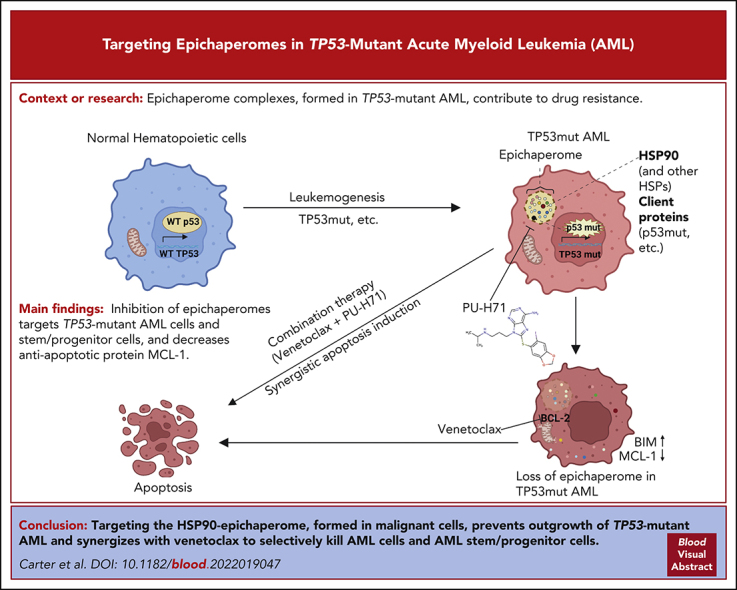
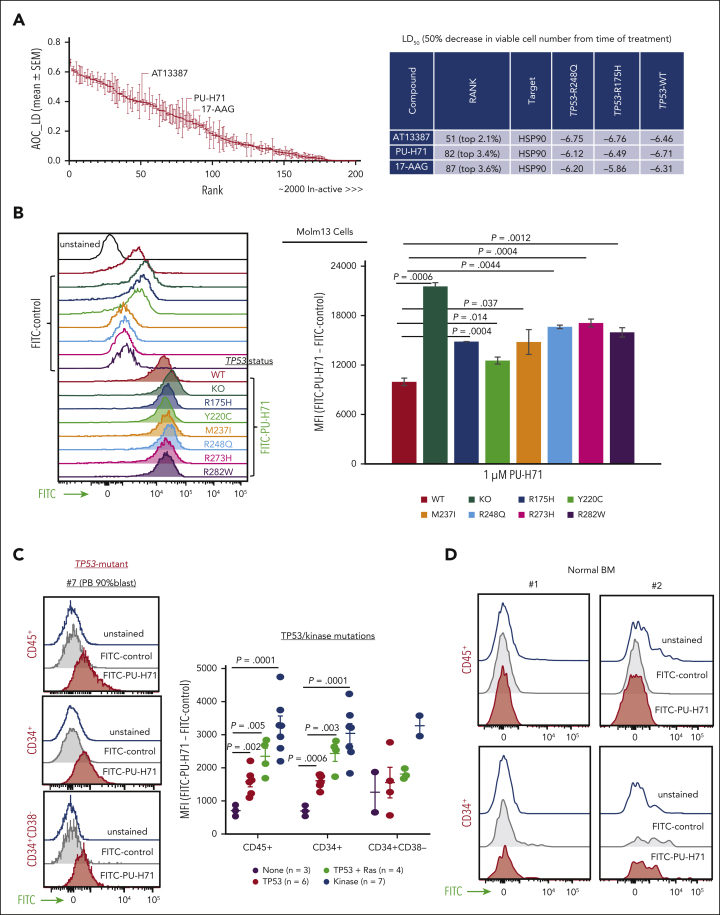
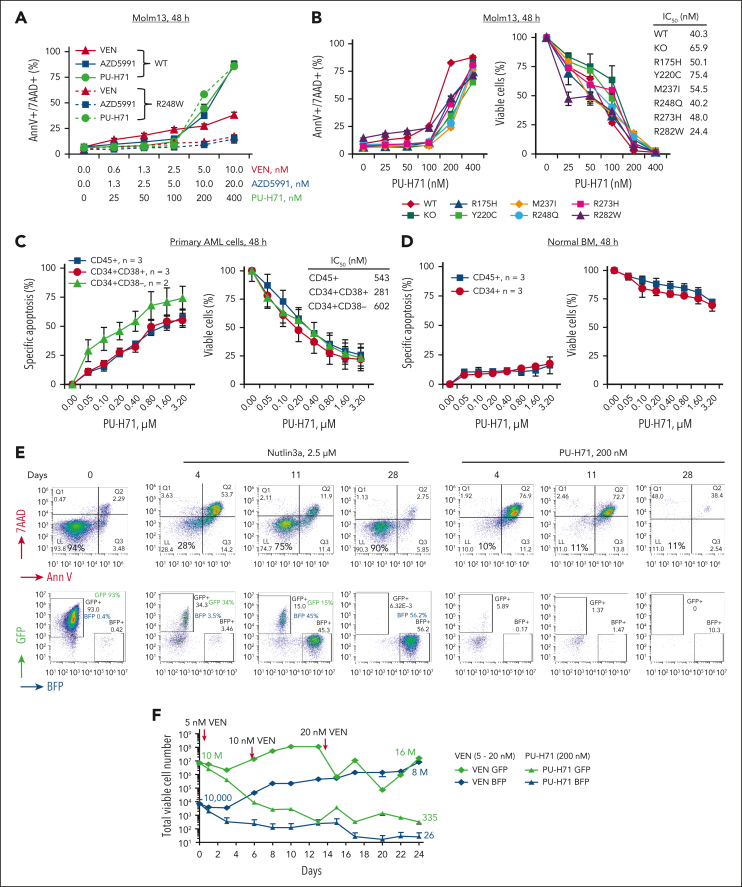
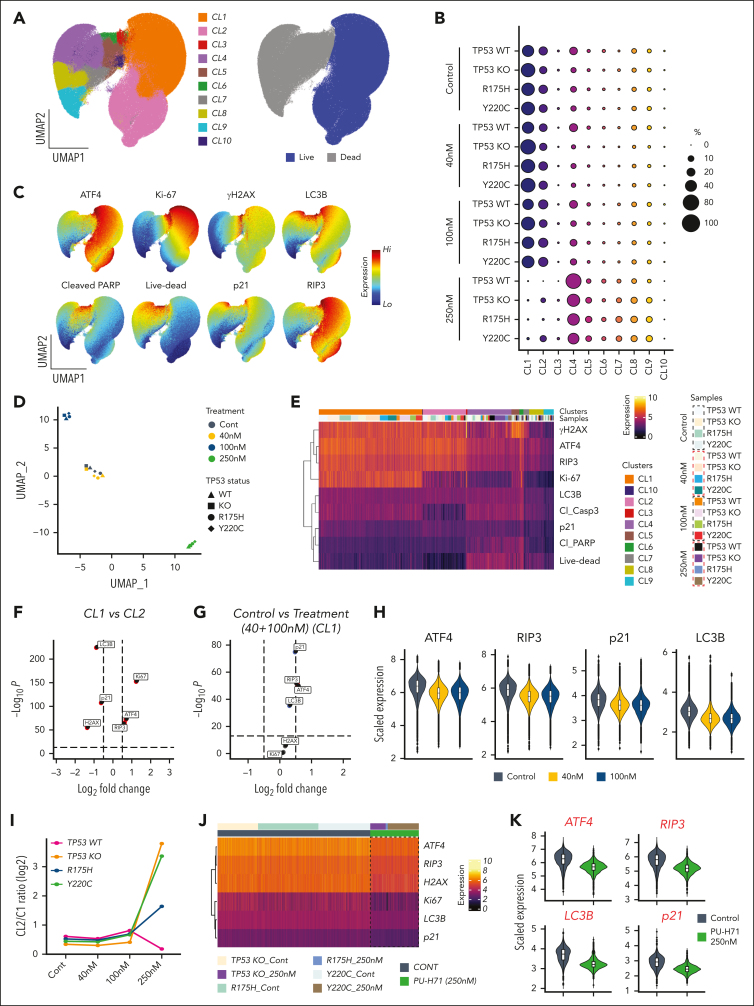
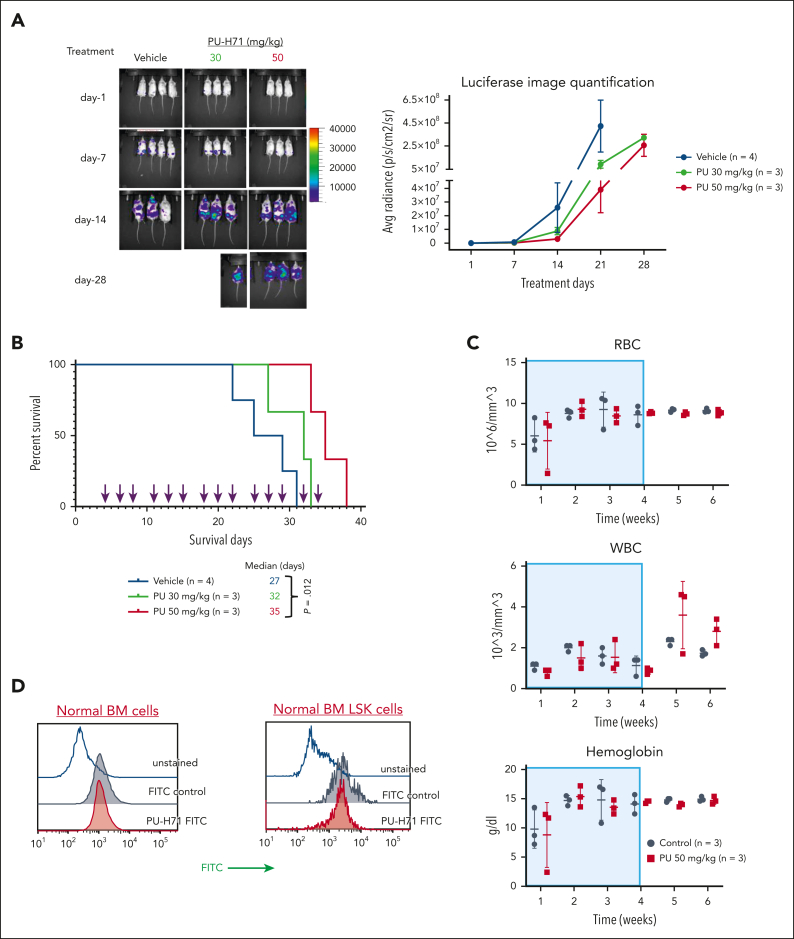
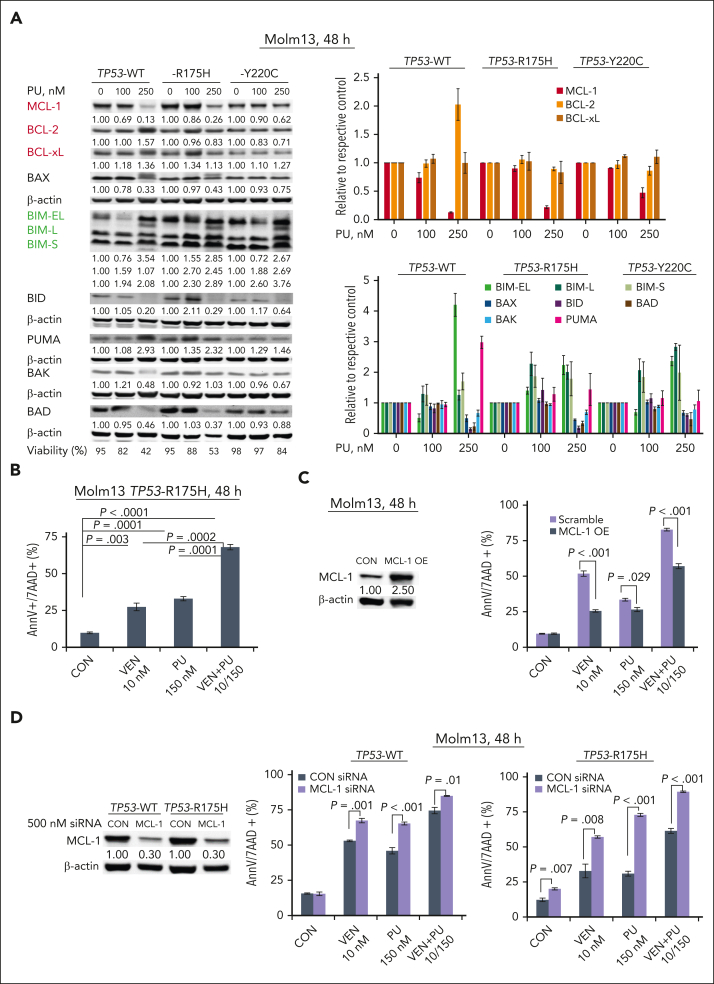
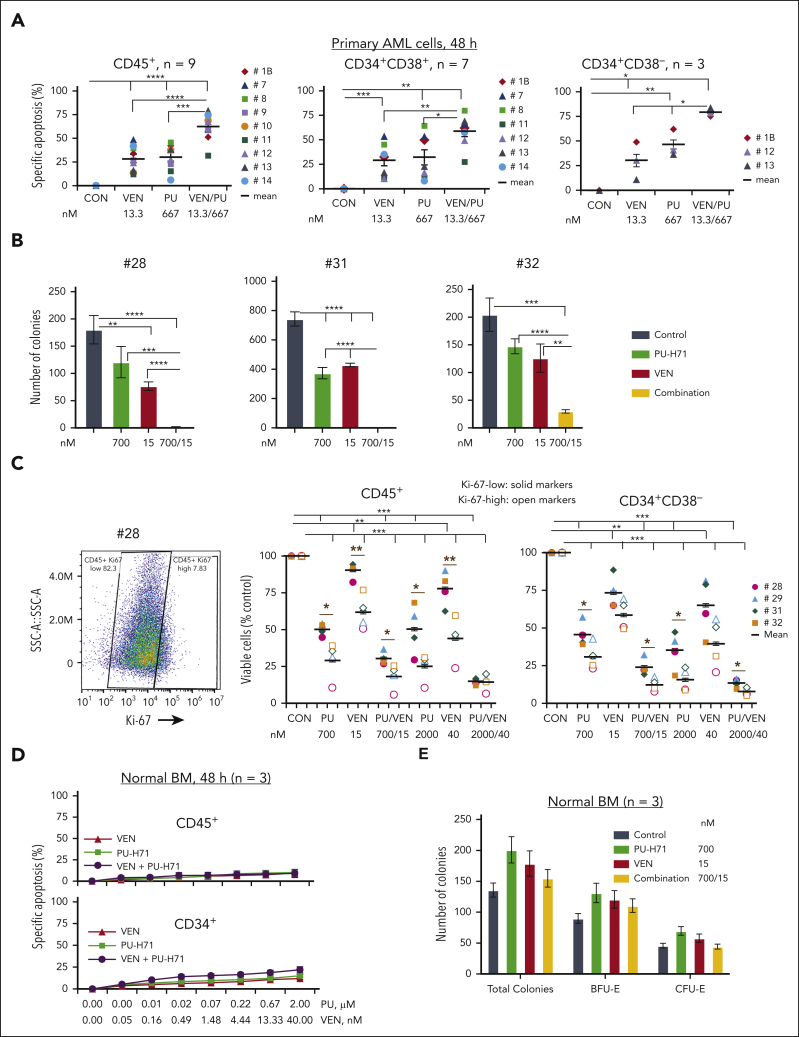
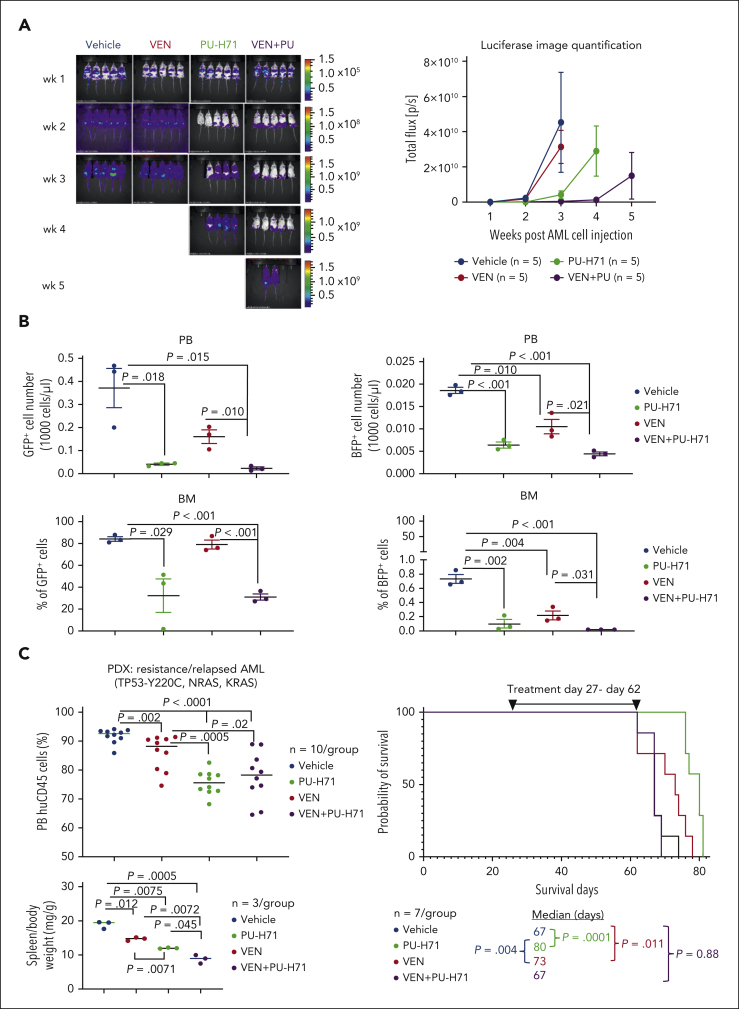
TP 53-mutant acute myeloid leukemia (AML) remains the ultimate therapeutic challenge. Epichaperomes, formed in malignant cells, consist of heat shock protein 90 (HSP90) and associated proteins that support the maturation, activity, and stability of oncogenic kinases and transcription factors including mutant p53. High-throughput drug screening identified HSP90 inhibitors as top hits in isogenic TP53-wild-type (WT) and -mutant AML cells. We detected epichaperomes in AML cells and stem/progenitor cells with TP53 mutations but not in healthy bone marrow (BM) cells. Hence, we investigated the therapeutic potential of specifically targeting epichaperomes with PU-H71 in TP53-mutant AML based on its preferred binding to HSP90 within epichaperomes. PU-H71 effectively suppressed cell intrinsic stress responses and killed AML cells, primarily by inducing apoptosis; targeted TP53-mutant stem/progenitor cells; and prolonged survival of TP53-mutant AML xenograft and patient-derived xenograft models, but it had minimal effects on healthy human BM CD34+ cells or on murine hematopoiesis. PU-H71 decreased MCL-1 and multiple signal proteins, increased proapoptotic Bcl-2-like protein 11 levels, and synergized with BCL-2 inhibitor venetoclax in TP53-mutant AML. Notably, PU-H71 effectively killed TP53-WT and -mutant cells in isogenic TP53-WT/TP53-R248W Molm13 cell mixtures, whereas MDM2 or BCL-2 inhibition only reduced TP53-WT but favored the outgrowth of TP53-mutant cells. Venetoclax enhanced the killing of both TP53-WT and -mutant cells by PU-H71 in a xenograft model. Our data suggest that epichaperome function is essential for TP53-mutant AML growth and survival and that its inhibition targets mutant AML and stem/progenitor cells, enhances venetoclax activity, and prevents the outgrowth of venetoclax-resistant TP53-mutant AML clones. These concepts warrant clinical evaluation.


Conflict of interest statement

Conflict-of-interest disclosure: B.W. and R.A.M. are employees of Samus Therapeutics Inc. B.L.E. has received research funding from Celgene, Deerfield, Novartis, and Calico and consulting fees from GRAIL; he is a member of the scientific advisory board and shareholder for Neomorph Inc, TenSixteen Bio, Skyhawk Therapeutics, and Exo Therapeutics. The remaining authors declare no competing financial interests.

Figures

None
Graphical abstract
Figure 1.
Figure 1.
HSP90 is a therapeutic target independent of TP53 gene mutation status, and the epichaperome is present in TP53-mutant AML cells and AML stem/progenitor cells. (A) High-throughput screening of ∼2400 approved drugs identified ∼200 compounds with activity in TP53-WT, TP53-R248Q, and TP53-R175H Molm13 cells independent of TP53 mutation status (left, red indicates HSP90 inhibitors). The error bars are the SEM of AOC_LD of the 3 cell lines. Three agents targeting HSP90 are top hits (right). Viable cell counts were normalized to the median cell count at the time of drug addition. A value of 1 represents negative control-like growth, values between 0 and 1 represent cyto-suppression, and negative values denote loss of cells from baseline. (B-D) The epichaperome was identified in Molm13 cells with variable TP53 status: (B) (left) a representative experiment and (right) quantification of triplicate experiments in primary AML cells and stem progenitor cells from patients; (C) a representative result from a patient with TP53-mutation (left) and results from TP53-mutant (right), TP53-/RAS-mutant, or kinase-mutant samples and samples without TP53/kinase mutations; and in normal BM controls (D). The epichaperome was identified via flow cytometry using FITC-labeled PU-H71 as probe. AOC_LD, area over the curve lethal dose; MFI, mean fluorescence intensity; SEM, standard error of the mean.
Figure 2.
Figure 2.
PU-H71 effectively induces cell death in TP53-mutant AML cells and stem/progenitor cells and prevents the outgrowth of TP53-mutant AML cells. (A) TP53-WT and TP53-R248W Molm13 cells were treated with PU-H71 or BH3 mimics targeting either BCL-2 (venetoclax [VEN]) or MCL-1 (AZD5991). (B-D) TP53-WT, -KO, and -mutant Molm13 cells (B), TP53-mutant primary AML cells and stem/progenitor cells (C), and healthy BM and BM stem/progenitor cells (D) were treated with PU-H71. After 48 hours of treatment, cell death and cell counts were determined via flow cytometry. Primary cells were cocultured with MSCs. (E-F) A mixture of GFP-labeled TP53-WT and BFP-labeled TP53-R248W Molm13 cells (1000:1 ratio) was treated with nutlin3a or PU-H71 (E) and flow cytometry was used to assess cell death and surviving TP53-WT (GFP) and TP53-R248W (BFP) cells or treated with VEN or PU-H71 (F), and cell viability and cell numbers were assessed via flow cytometry in the presence of counting beads. Fresh drugs and cell culture medium were added 2 or 3 times per week. 7AAD, 7-aminoactinomycin D; AnnV, annexin V; VEN, venetoclax.
Figure 3.
Figure 3.
PU-H71 targets baseline cellular stress responses to induce cell death. (A) Isogenic TP53-WT, -KO, and -mutant (R175H and Y220C) Molm13 cells were untreated or treated with 40, 100, or 250 nM PU-H71; stained with an array of antibodies; and subjected to flow cytometry analysis. Cells from all experiments were subjected to the FlowSOM algorithm to identify clusters. Cells were then subjected to UMAP dimensional reduction and projected on 2-dimensional plots with live (blue) and dead (gray) cells. (B) Bubble plot of the FlowSOM cluster frequencies from panel A across TP53-WT, -KO, and -mutant (R175H and Y220C) Molm13 cells. (C) UMAP plots for the indicated markers. (D) The FlowSOM cluster frequencies shown in panel B were used for UMAP dimension reduction to map similarities and dissimilarities in the response of isogenic TP53-WT, -KO, and -mutant (R175H and Y220C) leukemia cells to PU-H71 treatment. Shapes indicate the cell types and colors indicate the treatment conditions. (E) Single-cell protein expression heatmap showing expression of the indicated markers (rows) across 16 different experimental conditions (TP53-WT, -KO, -R175H, and -Y220C leukemia cells that were untreated or treated with 40, 100, and 250 nM PU-H71) and the 10 FlowSOM clusters identified in panel A. (F) Volcano plot showing differentially expressed markers between CL1 and CL2 live cells. Dashed vertical lines indicate the fold change cutoff ratio of 0.5. (G) Volcano plot showing differentially expressed markers between untreated CL1 cells and CL1 cells treated with 40 or 100 nM PU-H71. Dashed vertical lines indicate the fold change cutoff ratio of 0.5. (H) Violin plots summarize expression of the indicated markers in untreated CL1 cells (bluish gray) and CL1 cells treated with 40 nM (yellow) or 100 nM (blue) PU-H71. (I) Log2-transformed CL2/CL1 ratios in TP53-WT, -KO, and -mutant leukemia cells plotted against 4 different treatment conditions. The FlowSOM CL1 and CL2 frequencies, shown in panel B, of untreated and PU-H71-treated TP53-WT, -KO and -mutant leukemia cells were used to calculate CL2/CL1 ratios. (J) Single-cell protein expression heatmap showing expression of the indicated markers (rows) across control CL2 cells and residual CL2 cells detected after treatment of TP53-KO and -mutant (R175H and Y220C) leukemia cells with 250 nM PU-71. The scale bar indicates scaled marker expression levels. (K) Violin plots summarize expression of the indicated markers in CL2 clusters from untreated TP53-KO, and -R175H and -Y220C mutant leukemia cells (bluish gray) vs residual CL2 in TP53-KO, and -R175H and -Y220C mutant leukemia cells treated with 250 nM PU-H71.
Figure 4.
Figure 4.
PU-H71 has antileukemia activity in NSG mice bearing TP53-mutant AML xenografts with minimal toxicity in normal hematopoiesis. NSG mice bearing TP53-R248W Molm13 cells received 30 or 50 mg/kg PU-H71, and leukemia-free NSG mice received 50 mg/kg PU-H71. (A) Disease progression and treatment responses in NSG mice bearing TP53-R248W Molm13 cells were assessed via in vivo luciferase imaging; (left) imaging of individual mice and (right) quantification of luciferase imaging of all mice per group. (B) Survival of NSG mice bearing TP53-R248W Molm13 cells were either vehicle- or PU-H71–treated. Arrows indicate treatment times. (C) RBC counts, WBC counts, and hemoglobin levels in leukemia-free NSG mice treated with 50 mg/kg PU-H71. Shaded areas indicate the treatment period. (D) Measurement of the epichaperome in healthy BM cells and LinSca1+c-Kit+ BM cells collected from leukemia-free NSG mice. RBC, red blood cell; WBC, white blood cell.
Figure 5.
Figure 5.
PU alters the levels of BCL-2 proteins and synergizes with VEN to induce cell death in AML independent of TP53 mutation status. (A) BCL-2 family protein levels were determined in TP53-WT and -mutant Molm13 cells treated with PU-H71. Results of a representative immunoblotting (left) and quantitative analysis of 3 independent measurements (right). (B-F) TP53-R175H Molm13 cells (B), control and MCL-1 overexpressing Molm13 cells (C), and MCL-1 knockdown (KD) by small interfering RNA TP53-WT or TP53-R175H Molm13 cells (D), (F) were treated with PU, VEN, or both for 48 hours. Cell death was determined via flow cytometry. CON, control; PU, PU-H71.
Figure 6.
Figure 6.
PU and VEN combination synergistically targets AML cells and stem/progenitor cells with TP53 mutations but with limited activities against healthy BM and BM stem/progenitor cells. PB cells from patients with primary AML with TP53 mutations and healthy BM cells were treated with PU, VEN, or both. (A-B) Cell death of AML cells and stem/progenitor cells at 48 hours treatments (A) and clonogenic assay (B) in primary samples from patients. (C) Viable cells in Ki-67–low (solid markers) and –high (open markers) AML cells and stem/progenitor cells from patients with TP53 mutations. (Left) Ki-67 staining of 1 of the samples. (Middle and right) Viable CD45+ cells or CD34+CD38 cells in various treatment groups compared with the untreated control. Patient samples used for various treatments and patient characteristics are shown in supplemental Table 1. (D-E) Cell death at 48-hour treatments (D) and clonogenic assays (E) in healthy BM samples. Primary cells were cocultured with MSCs during treatments. For colony assays, error bars represent mean ± SEM of 3 plating × 2 counting of each sample. ∗P ≤ .05; ∗∗P ≤ .01; ∗∗∗P ≤ .001; ∗∗∗∗P ≤ .0001. BFU-E, burst forming unit-erythroid.
Figure 7.
Figure 7.
PU plus VEN has enhanced antileukemia activity against both TP53-WT and -mutant AML in vivo. NSG mice injected with a mixture of luciferase-/GFP-labeled TP53-WT Molm13 cells and BFP-labeled TP53-R248W Molm13 cells (10:1 ratio) or NSGS mice injected with a PDX TP53-mutant cells (2 × 106 cells per mouse) were treated with PU (50 mg/kg), VEN (50 mg/kg), or both. (A) Luciferase imaging of leukemia burden in NSG mice: (left) images of individual mice and (right) quantification of luciferase imaging of all mice per treatment group). (B) Flow cytometry was used to identify TP53-WT and -R248W Molm13 cells in PB and BM after 3-week treatment. (C) Circulating blasts and spleen weight after 4-week treatment (left) and mouse survival in NSGS mice (right). PDX, patient-derived xenograft.

Comment in

References

    1. Hou HA, Chou WC, Kuo YY, et al. TP53 mutations in de novo acute myeloid leukemia patients: longitudinal follow-ups show the mutation is stable during disease evolution. Blood Cancer J. 2015;5(7):e331. - PMC - PubMed
    1. Stengel A, Kern W, Haferlach T, Meggendorfer M, Fasan A, Haferlach C. The impact of TP53 mutations and TP53 deletions on survival varies between AML, ALL, MDS and CLL: an analysis of 3307 cases. Leukemia. 2017;31(3):705–711. - PubMed
    1. Kadia TM, Jain P, Ravandi F, et al. TP53 mutations in newly diagnosed acute myeloid leukemia: clinicomolecular characteristics, response to therapy, and outcomes. Cancer. 2016;122(22):3484–3491. - PMC - PubMed
    1. Short NJ, Montalban-Bravo G, Hwang H, et al. Prognostic and therapeutic impacts of mutant TP53 variant allelic frequency in newly diagnosed acute myeloid leukemia. Blood Adv. 2020;4(22):5681–5689. - PMC - PubMed
    1. DiNardo CD, Tiong IS, Quaglieri A, et al. Molecular patterns of response and treatment failure after frontline venetoclax combinations in older patients with AML. Blood. 2020;135(11):791–803. - PMC - PubMed

Publication types

MeSH terms