. 2023 Jul 20;186(15):3227-3244.e20.
doi: 10.1016/j.cell.2023.05.035. Epub 2023 Jun 19.

Mechanisms of readthrough mitigation reveal principles of GCN1-mediated translational quality control

Affiliations

Mechanisms of readthrough mitigation reveal principles of GCN1-mediated translational quality control

Martin B D Müller et al. Cell. .

Abstract

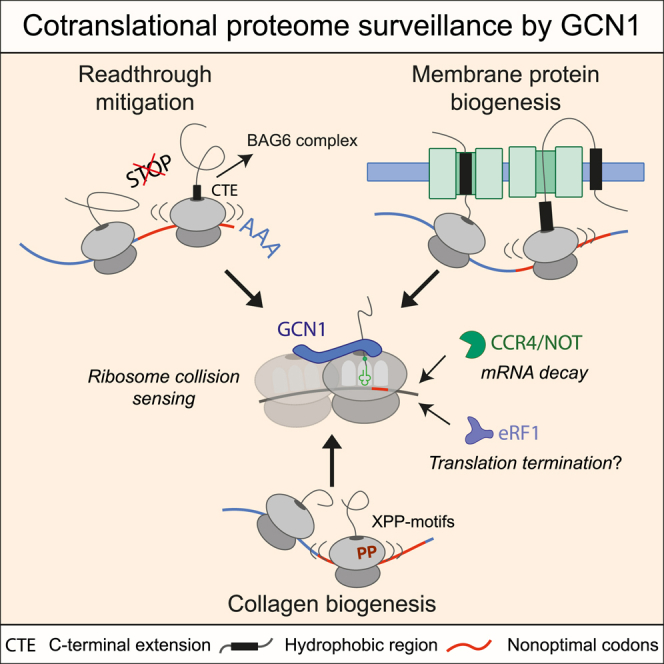
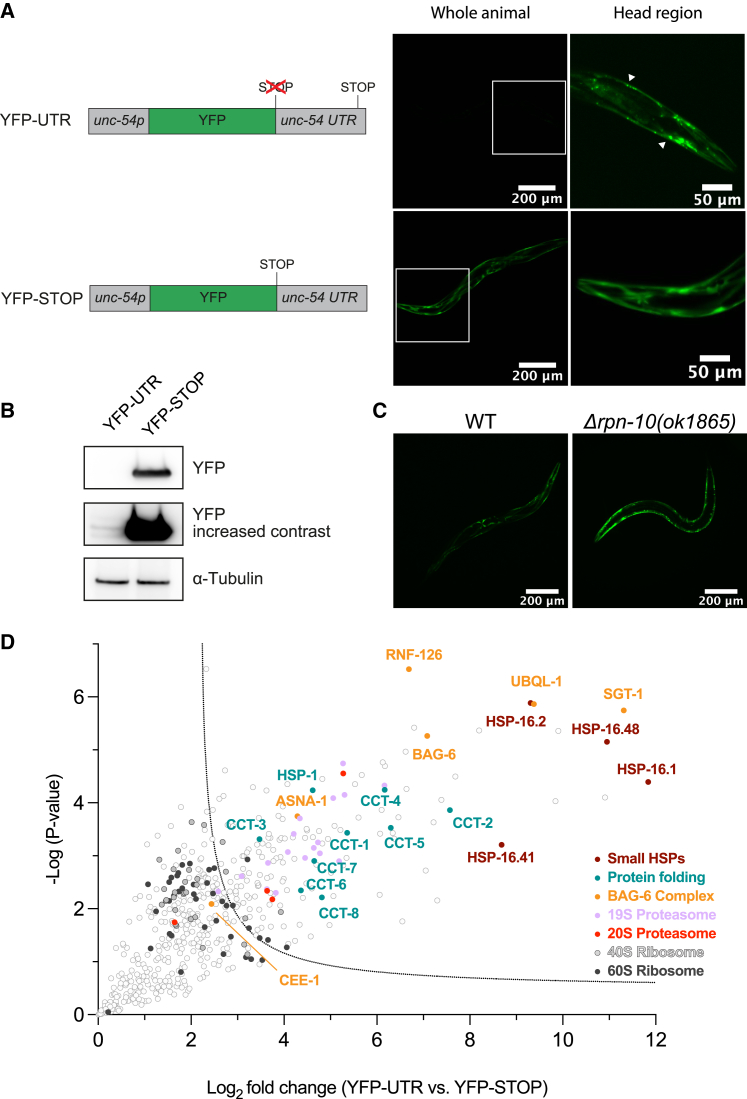
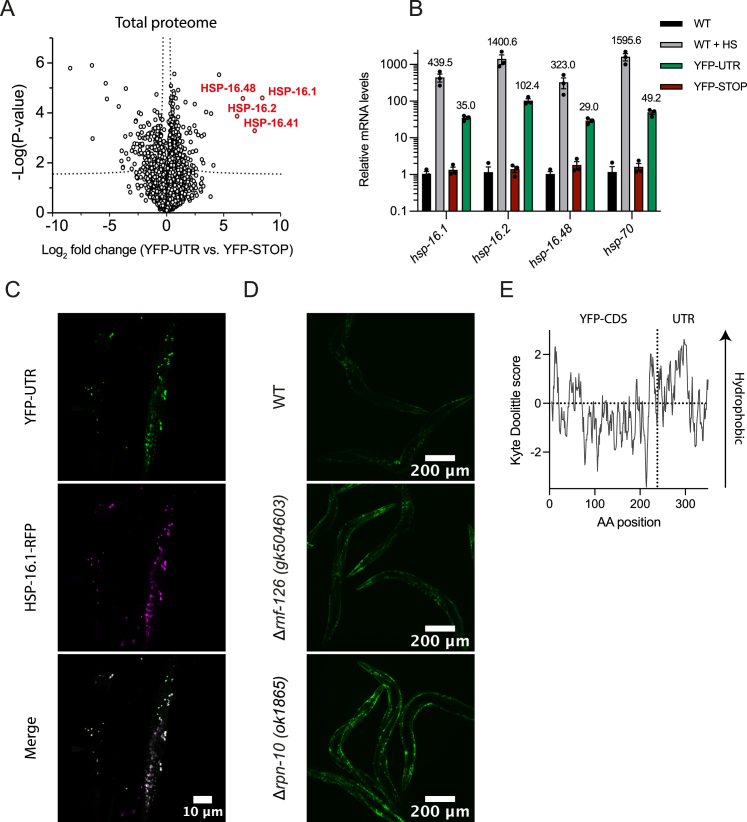
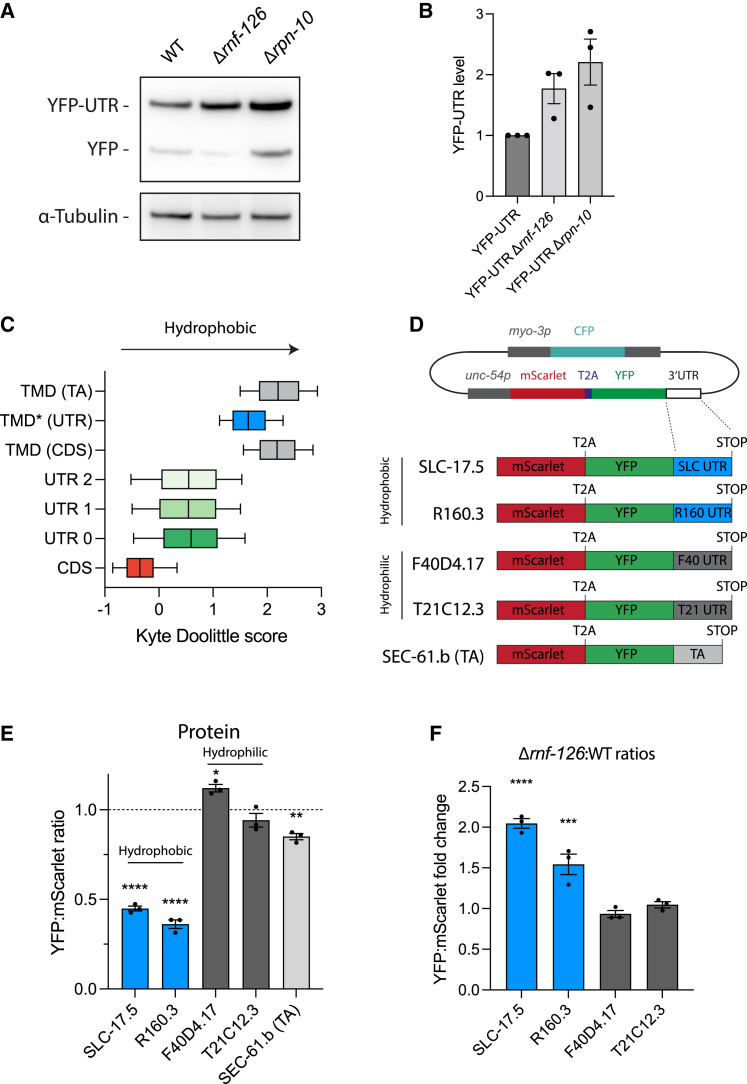
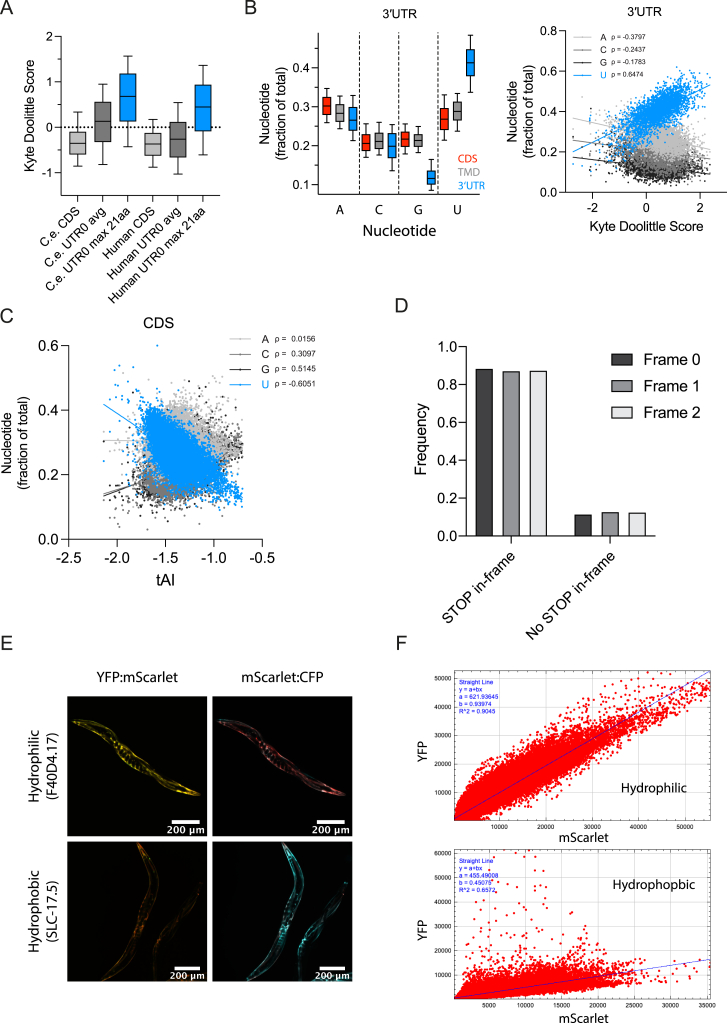
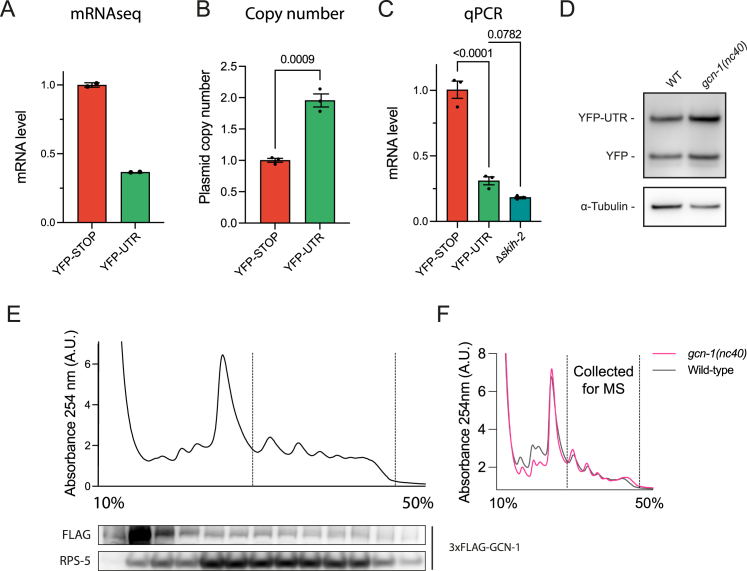
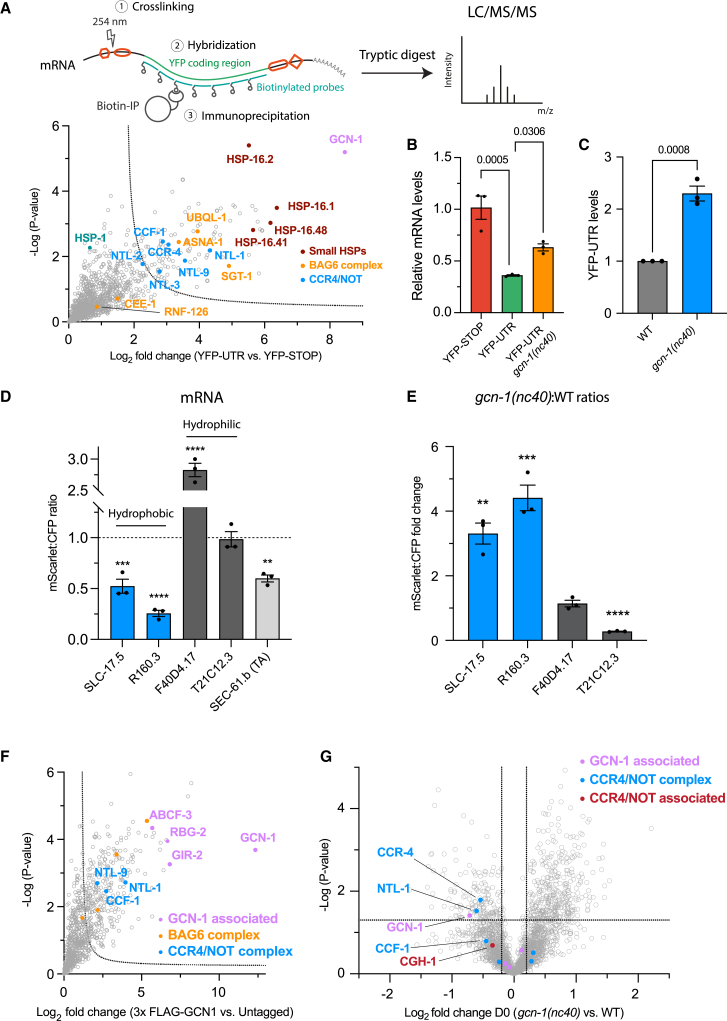
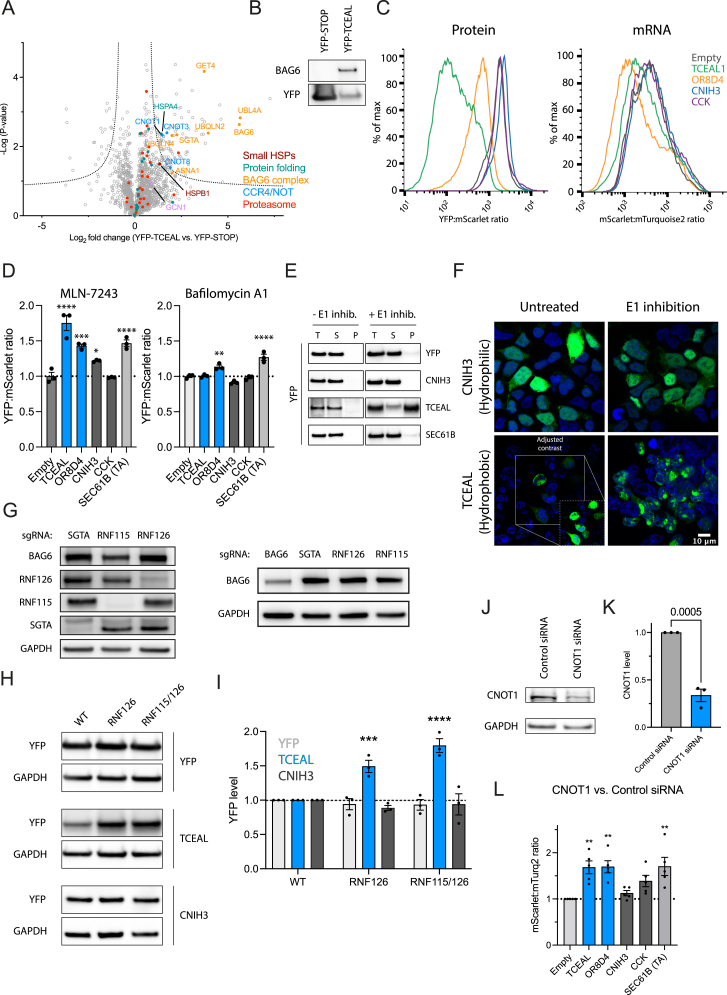
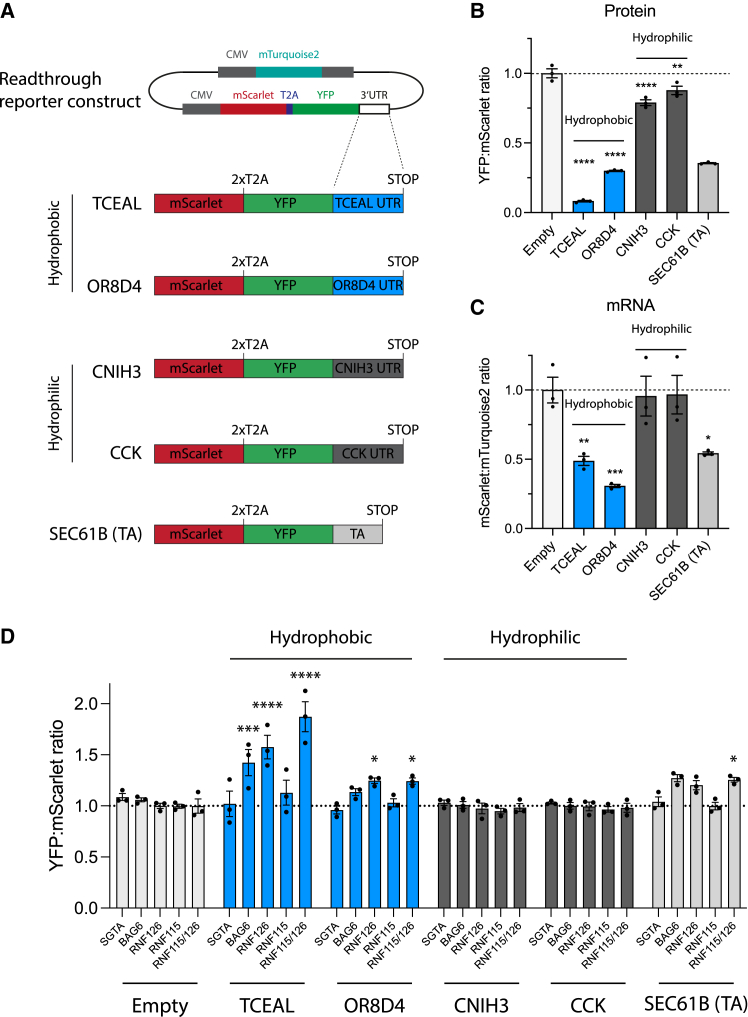
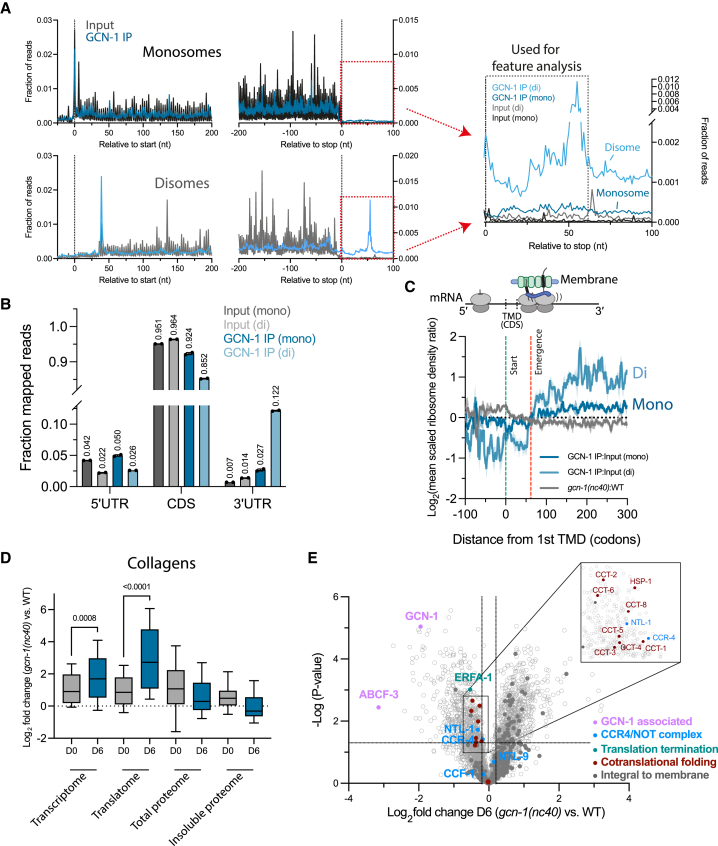
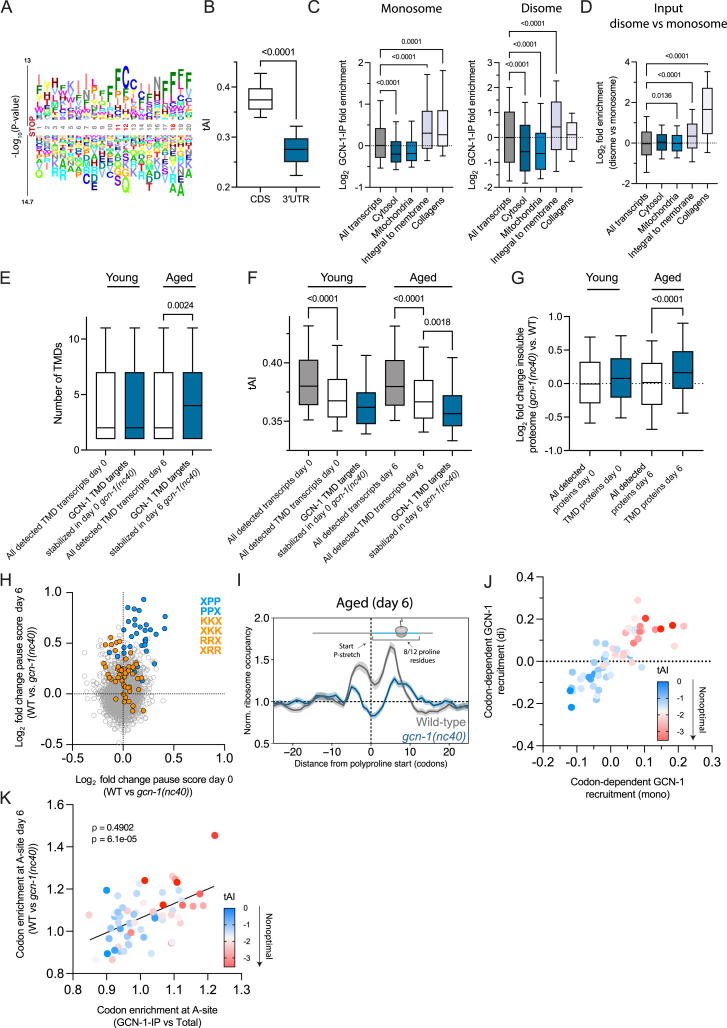
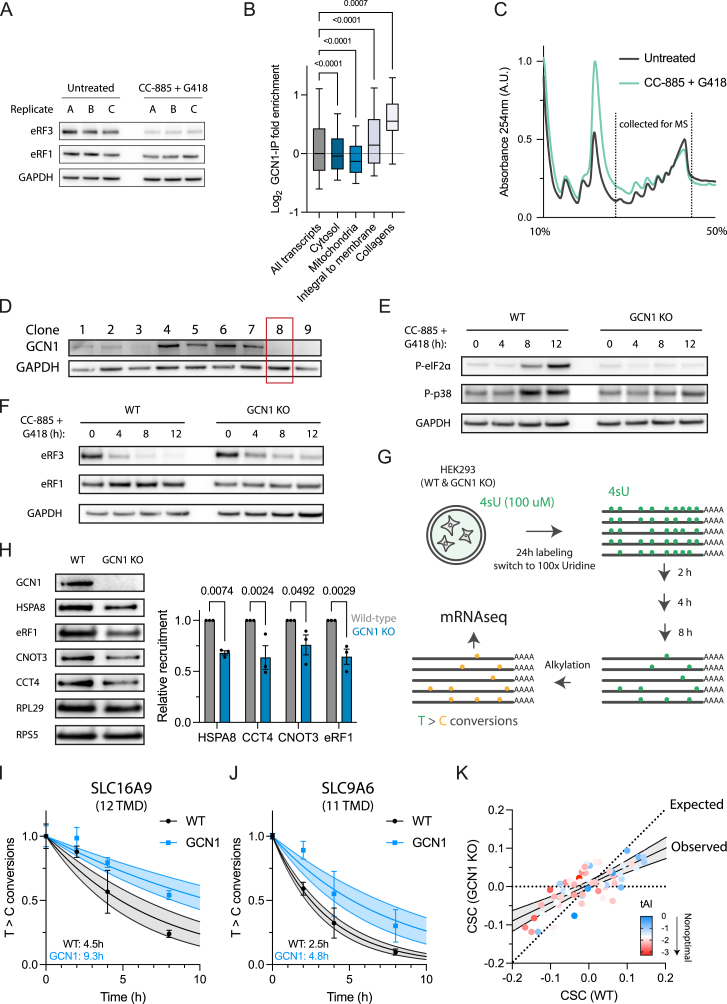
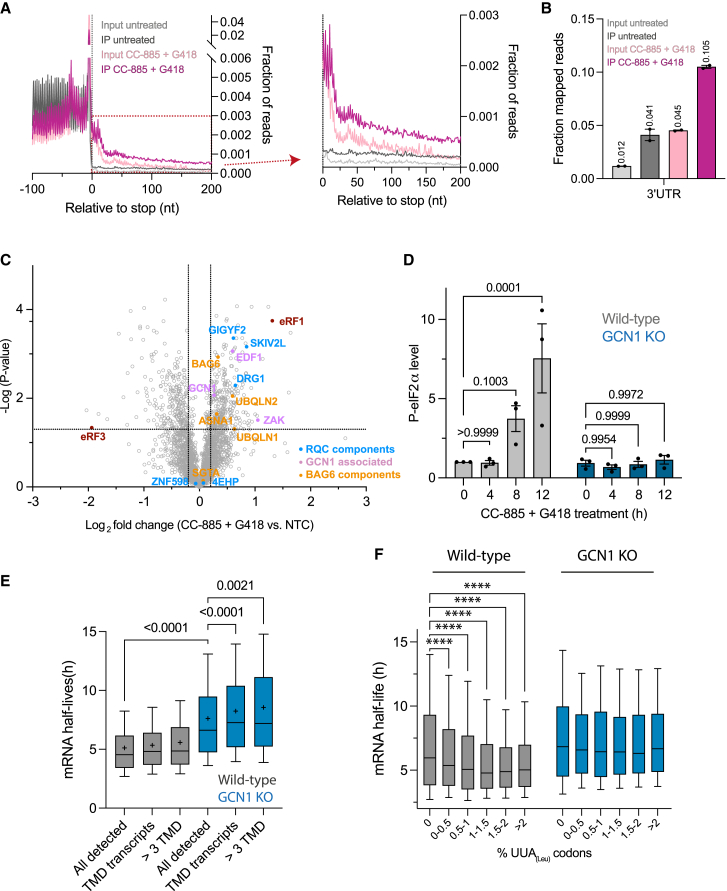
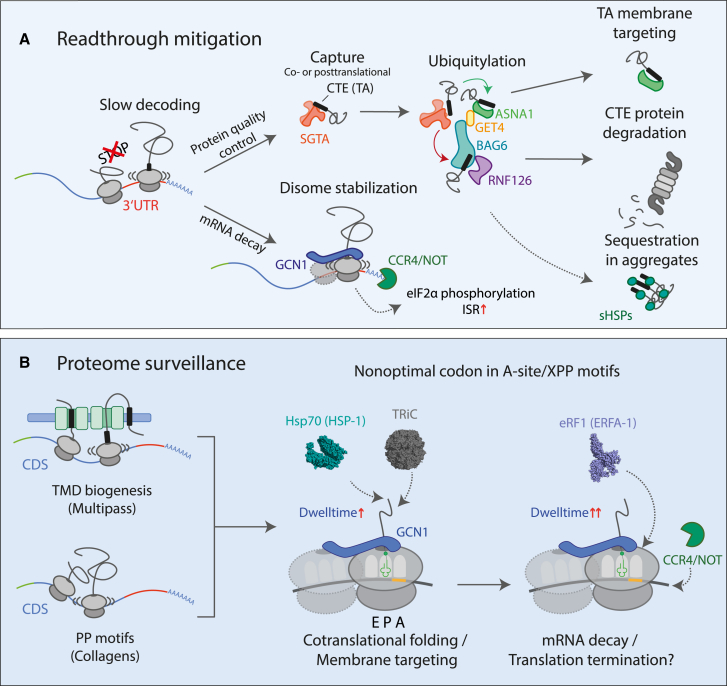
Readthrough into the 3' untranslated region (3' UTR) of the mRNA results in the production of aberrant proteins. Metazoans efficiently clear readthrough proteins, but the underlying mechanisms remain unknown. Here, we show in Caenorhabditis elegans and mammalian cells that readthrough proteins are targeted by a coupled, two-level quality control pathway involving the BAG6 chaperone complex and the ribosome-collision-sensing protein GCN1. Readthrough proteins with hydrophobic C-terminal extensions (CTEs) are recognized by SGTA-BAG6 and ubiquitylated by RNF126 for proteasomal degradation. Additionally, cotranslational mRNA decay initiated by GCN1 and CCR4/NOT limits the accumulation of readthrough products. Unexpectedly, selective ribosome profiling uncovered a general role of GCN1 in regulating translation dynamics when ribosomes collide at nonoptimal codons, enriched in 3' UTRs, transmembrane proteins, and collagens. GCN1 dysfunction increasingly perturbs these protein classes during aging, resulting in mRNA and proteome imbalance. Our results define GCN1 as a key factor acting during translation in maintaining protein homeostasis.

Keywords: BAG6 complex; CCR4/NOT; GCN1; aging; codon optimality; collagens; cotranslational mRNA decay; disomes; readthrough mitigation; transmembrane proteins.


Conflict of interest statement

Declaration of interests The authors declare no competing interests.

Figures

None
Graphical abstract
Figure 1
Figure 1
Stop codon readthrough proteins are unstable and recruit specific protein quality control machinery (A) Expression of readthrough reporter protein in C. elegans muscle cells. Left: reporter constructs YFP-UTR, allowing readthrough into the unc-54 UTR, and YFP-STOP used as control. Right: fluorescence microscopy images of animals expressing these proteins. White boxes indicate head region (magnified and contrast adjusted) (exposure 4ms). Arrow heads point to inclusions of YFP-UTR. (B) Immunoblot analysis of lysates from adult worms expressing YFP-UTR and YFP-STOP using anti-GFP antibody, revealing the destabilization of YFP-UTR. α-Tubulin served as loading control (n = 3). (C) Fluorescence microscopy images of wild-type (WT) and Δrpn-10 worms expressing YFP-UTR (exposure 100 ms). (D) Volcano plot representation of label-free proteome analysis of YFP pull-down fractions from worm lysates as in (B). Components of the BAG6 complex, proteasomes, TRiC/CCT chaperonin, and molecular chaperones, including sHSPs and HSP-1, are significantly enriched on YFP-UTR. Selected proteins are annotated. See also Figure S1 and Table S1A.
Figure S1
Figure S1
Characterization of readthrough quality control machinery, related to Figure 1 (A) Readthrough into 3′ UTR induces expression of sHSPs. Volcano plot representation of label-free proteome analysis of YFP-UTR and YFP-STOP expressing nematodes. sHSPs are highlighted in red. See Table S1K. (B) Relative mRNA levels (qPCR analysis) of hsp-16 family members and hsp-70 (C12C8.1) in animals (day 0) expressing YFP-UTR. Wild-type (WT) nematodes (untreated or exposed to heat stress [HS]) and animals expressing YFP-STOP were analyzed as controls. HS was performed for 60 min at 34°C. Error bars represent mean ± SEM (n = 3). (C) Expression of readthrough reporter protein in C. elegans muscle cells in the presence of a HSP-16.1-RFP reporter. Representative fluorescence microscopy images of animals expressing YFP-UTR are shown. (D) YFP-UTR undergoes proteasomal degradation. Representative fluorescence microscopy images of wild-type, Δrnf-126, and Δrpn-10 worms expressing YFP-UTR. (Exposure 200 ms, 100× magnification.) (E) Hydrophobicity analysis of YFP-UTR using Kyte Doolittle scores (KDSs) as metric. AA, amino acid.
Figure 2
Figure 2
Readthrough reporter proteins with hydrophobic CTEs undergo RNF126-dependent degradation (A) Immunoblot analysis of wild-type, Δrnf-126, and Δrpn-10 worms expressing YFP-UTR using anti-GFP antibody (n = 3). α-Tubulin served as loading control. (B) Densitometric analysis of immunoblots shown in (A). Error bars represent mean ± SEM (n = 3). (C) Hydrophobicity (Kyte Doolittle scores [KDSs]) of transmembrane domains of predicted TA-proteins (TMD [TA]; 338 proteins), predicted TMDs in 3′ UTRs (TMD [UTR] in reading frame 0; 2,323 genes), and predicted TMDs in coding sequences of single-pass membrane proteins (TMD [CDS]; 2,022 proteins) compared with all coding sequences (CDSs) in the C. elegans genome (26,584 proteins). TMDs were predicted using Phobius. (D) Constructs for ratiometric analysis of effects of readthrough into 3′ UTRs encoding hydrophilic F40D4.17 (KDS = −2.29; 36 residues) and T21C12.3 (KDS = −1.91, 34 residues) or hydrophobic SLC-17.5 (KDS = 2.78, 26 residues) and R160.3 (KDS = 2.69, 29 residues) CTE sequences. SEC-61.b was used as an authentic TA-protein, with its tail-anchor region (TA) (29 residues) fused C-terminally to YFP. (E) Relative destabilization of reporter proteins with hydrophobic CTEs. Ratiometric analysis (YFP:mScarlet ratios) from fluorescence microscopy images of worms expressing constructs described in (D). Experiments were performed in triplicates with at least 5 images per replicate. p < 0.05; ∗∗p < 0.01; ∗∗∗p < 0.001; ∗∗∗∗p < 0.0001 by Dunnett’s test. Error bars represent mean ± SEM. Dotted line indicates respective STOP controls. (F) Selective stabilization of proteins with hydrophobic CTEs in Δrnf-126 mutant worms. Fold changes in YFP:mScarlet ratios are indicated. Experiments were performed in triplicates with at least 5 images per replicate. Also see Figure S2. p < 0.05; ∗∗p < 0.01; ∗∗∗p < 0.001; ∗∗∗∗p < 0.0001 by Dunnett’s test. Error bars represent mean ± SEM.
Figure S2
Figure S2
Sequence features of C. elegans 3′ UTRs, related to Figure 2 (A) Boxplots of Kyte Doolittle scores indicating hydrophobicity of CDS regions, 3′ UTRs and maximum hydrophobicity score (max. score) of a 21AA window (average TA length) within 3′ UTRs in C. elegans and human. (B) Relationship of nucleotide composition and sequence properties. Left: nucleotide composition in C. elegans of coding sequences (CDSs), red; TMD transcripts, gray; 3′ UTRs, blue. Right: correlation of 3′ UTR nucleotide composition and hydrophobicity of their translated peptides. U-content positively correlates with hydrophobicity in C. elegans. (C) Correlation analysis of nucleotide composition and tAI score indicates a negative correlation between U-content and codon optimality. (D) Occurrence of in-frame stop codons in 3′ UTRs. 3′ UTRs typically contain at least one stop codon before the poly(A) tail (∼90%) in all three reading frames. (E) Expression of 3-color reporter constructs for either hydrophilic (top) or hydrophobic (bottom) 3′ UTR fusion proteins. Representative fluorescence microscopy images (overlay) of either YFP:mScarlet (left, ratio of YFP to mScarlet) or mScarlet:CFP (right, ratio of mScarlet to CFP) channels are shown. (F) Representative ratiometric analysis of YFP by mScarlet ratios performed on images shown in (D). The mScarlet channel was used to outline the muscle cells expressing the reporter construct. Linear regression analysis was applied to values of each pixel (for the corresponding channel). The resulting slope was used to express the ratios depicted in Figures 2E, 2F, 3D, and 3E.
Figure S3
Figure S3
Effects of 3′ UTR translation on mRNA and protein levels, related to Figure 3 (A) mRNA-seq analysis of C. elegans reporter strains expressing YFP-UTR and YFP-STOP (n = 2). Error bars represent mean ± SEM. (B) qPCR analysis of copy number of YFP-UTR and YFP-STOP in C. elegans reporter strains. Integrated gene copy numbers are on average 1.96 ± 0.11-fold higher in YFP-UTR compared with YFP-STOP. Error bars represent mean ± SEM (n = 3). Data were analyzed using the 2(−ΔΔCt) formula. p values by unpaired t test. (C) qPCR analysis of YFP-STOP and YFP-UTR mRNA levels in wild-type C. elegans and in skih-2 mutant animals. Error bars represent mean ± SEM (n = 3). Data were analyzed using the 2(−ΔΔCt) formula. p values by Fisher’s LSD test. (D) Representative immunoblot analysis of wild-type or gcn-1(nc40) mutant worms expressing YFP-UTR. See Figure 3C for quantification. (E) Representative trace of sucrose density gradient fractionation (A254 nm; top) and immunoblot analysis of 3x-FLAG-tagged GCN-1 in C. elegans. Dotted lines delineate polysome fractions. (F) Representative traces of sucrose gradient density fractionation of wild-type and gcn-1(nc40) mutant animals (A254 nm). Dotted line indicates polysomes collected for subsequent MS/MS analysis shown in Figures 3G and 5E.
Figure 3
Figure 3
Identification of GCN-1 and CCR4/NOT as quality control factors mitigating stop codon readthrough (A) Upper: schematic of mRNA pull-down of YFP-UTR and YFP-STOP. Lower: interactome analysis of YFP-UTR mRNA (vs. YFP-STOP). Volcano plots of label-free proteome analysis of pull-down fractions showing enrichment of GCN-1, BAG6 complex, CCR4/NOT, and sHSPs on YFP-UTR. See also Table S1B. (B) qPCR analysis of YFP-STOP and YFP-UTR mRNA levels in wild-type C. elegans and in gcn-1(nc40) mutant animals (n = 3). Data were analyzed using the 2(−ΔΔCt) formula, and p values were calculated using Fisher’s least significant difference (LSD) test (see STAR Methods). Error bars represent mean ± SEM. (C) YFP-UTR protein levels in wild-type and gcn-1(nc40) mutant worms. Analyses by immunoblotting as in Figure S3D were quantified by densitometry (n = 3). p value calculated from unpaired Student’s t test. Error bars represent mean ± SEM. (D) Ratiometric analysis of mRNA levels (mScarlet:CFP ratios) of the indicated hydrophilic and hydrophobic readthrough constructs (Figure 2D) from fluorescence microscopy images of worms. Experiments were performed in triplicates with at least 5 images per replicate. p < 0.05; ∗∗p < 0.01; ∗∗∗p < 0.001; ∗∗∗∗p < 0.0001 by Dunnett’s test. Error bars represent mean ± SEM. Dotted line indicates STOP controls. (E) Selective stabilization of mRNA levels of hydrophobic readthrough constructs in gcn-1(nc40) mutant animals. Fold change in mRNA levels determined as in (D). Experiments were performed in triplicates with at least 5 images per replicate. p < 0.05; ∗∗p < 0.01; ∗∗∗p < 0.001; ∗∗∗∗p < 0.0001 by Dunnett’s test. Error bars represent mean ± SEM. (F) Interactome analysis of GCN-1. Volcano plot representation of label-free proteome analysis of anti-FLAG pull-down from lysates of worms expressing endogenous 3xFLAG-GCN-1 relative to lysates from untagged animals. Selected proteins are annotated. See also Table S1C. (G) Volcano plot representation of label-free proteome analysis of polysome fractions of young (day 0) gcn-1(nc40) mutant worms relative to polysome fractions of day 0 wild-type animals. Selected proteins are annotated. Dotted lines indicate cutoffs for enrichment at the x axis (log2 ± 0.2, ∼1.15-fold) and at the y axis for p values (0.05, −log > 1.33). See also Figure S3J and Table S1D.
Figure S4
Figure S4
Protein and mRNA clearance upon translational readthrough is conserved in HEK293T cells, related to Figure 4 (A) Volcano plot representation of label-free interactome analysis of YFP-TCEAL from HEK293T cells expressing YFP-TCEAL CTE construct and YFP-STOP as control. Components of the BAG6, proteasomal subunits, heat-shock proteins (e.g., HSPB1 and HSPA4) and CCR4/NOT complexes are identified as interactors of YFP-TCEAL. Selected proteins are highlighted. See also Table S1L. (B) Immunoprecipitation of YFP-STOP or YFP-TCEAL with anti-GFP antibody from HEK293T cells expressing the respective constructs. Fractions were analyzed by immunoblotting for BAG6 and YFP (n = 2). Note that the UTR sequence adds 30 amino acids (mainly hydrophobic) to the C terminus of YFP, resulting in only slightly slower migration of YFP-TCEAL compared with YFP-STOP. (C) Representative histograms of flow cytometry analysis indicating YFP:mScarlet and mScarlet:mTurquoise2 ratios of cells transiently transfected with the indicated reporter plasmids (related to Figures 4B–4D). (D) Ratiometric flow cytometry analysis of cells expressing the indicated reporter plasmids (see Figure 4A) in the presence of the E1 ubiquitin-activating inhibitor MLN-7243 (compared with untreated cells) (n = 3; left) and the lysosomal degradation inhibitor bafilomycin A1 (compared with untreated cells) (n = 3; right). Error bars represent mean ± SEM. p values by Dunnett’s test. p < 0.05; ∗∗p < 0.01; ∗∗∗p < 0.001; ∗∗∗∗p < 0.0001. (E) Representative immunoblot analysis of soluble and pellet fractions from cells expressing the indicated reporter constructs (see Figure 4A). YFP-TCEAL is recovered in the pellet fraction upon E1 inhibition. (F) Representative fluorescence microscopy images of hydrophobic (YFP-TCEAL) or hydrophilic (YFP-CNIH3) readthrough reporter proteins with or without E1 inhibition by MLN-7243. Insert in the lower left image shows cells after contrast adjustment for the low expression level of the YFP-TCEAL readthrough reporter. (G) Representative immunoblot analysis of HEK293T depletion cell lines for components of the BAG6 complex. (H) Representative immunoblot analysis of reporter constructs in different BAG6 mutant backgrounds shown in (F). Related to Figure 4D. (I) Quantification of immunoblot analysis in (G) by densitometry (n = 3). p value by Dunnett’s test. Error bars represent mean ± SEM. ∗∗∗p < 0.001; ∗∗∗∗p < 0.0001. Related to Figure 4D. (J) Representative immunoblot analysis of downregulation efficiency using siRNA against CNOT1 compared with control siRNA. p value by unpaired t test. (K) Quantification of immunoblot analysis in (I) by densitometry. Error bars represent mean ± SEM (n = 3). p value by Dunnett’s test. (L) Effect of downregulation of CNOT1 on mRNA level of 3′ UTR reporter constructs and SEC61B (TA). Ratiometric analysis by flow cytometry of cells treated with siRNA against CNOT1 or control siRNA. Error bars represent mean ± SEM (n = 5). p value by Dunnett’s test. ∗∗∗p < 0.001.
Figure 4
Figure 4
Readthrough mitigation pathways are conserved in mammalian cells (A) Constructs for ratiometric analysis by flow cytometry of effects of readthrough into 3′ UTRs encoding hydrophobic (transcription elongation factor A protein-like 1 [TCEAL1], KDS = 2.07, 32 residues; olfactory receptor 8D4 [OR8D4], KDS = 1.96, 28 residues) or hydrophilic (protein cornichon homolog 3 [CNIH3], KDS = −2.21, 34 residues; cholecystokinin [CCK], KDS = −1.89, 26 residues) CTE sequences in HEK293T cells. The TA sequence of SEC61B was also analyzed. (B and C) Ratiometric analysis in HEK293T cells of protein levels (YFP:mScarlet ratio) (B) and of mRNA levels (mScarlet:mTurquoise2 ratio) (C) of constructs in (A). Data from flow cytometry (see Figure S4C). p < 0.05; ∗∗p < 0.01; ∗∗∗p < 0.001; ∗∗∗∗p < 0.0001 by Dunnett’s test. Error bars represent mean ± SEM (n = 3). Dotted line indicates empty control ratios. (D) Effects of the deletion of genes encoding factors involved in readthrough mitigation on protein levels of hydrophilic and hydrophobic readthrough constructs, determined as in (B). Error bars represent mean ± SEM (n = 3). p < 0.05; ∗∗p < 0.01; ∗∗∗p < 0.001; ∗∗∗∗p < 0.0001 by Dunnett’s test. Dotted line indicates wild-type ratios.
Figure 5
Figure 5
Selective ribosome profiling reveals GCN-1 binding to hydrophobic ribosomes translating 3′ UTRs, TMD proteins, and collagens (A) Metagene plots of GCN-1-bound ribosomes (monosomes and disomes) and total input control are shown (3′ UTR regions magnified in right) (see STAR Methods). (B) Distribution of RPFs of GCN-1-IPed ribosomes and total input control in 5′ UTR, coding sequences (CDSs) and 3′ UTR regions of monosomes and disomes. Mean values are indicated above bars. (C) Metagene analysis of GCN-1 interaction with TMD protein transcripts. RPFs of GCN-1 bound monosomes (odds ratio compared with total input; n = 1,303; blue line ± SEM in light blue), disomes (n = 2,595; light blue line ± SEM shaded) and ribosomes of gcn-1(nc40) mutant animals (odds ratio compared with wild type; n = 1,029; dark gray line ± SEM in light gray) are shown. Each transcript was centered around the onset of the first TMD (position 0, green dotted line) and RPFs were expressed as mean-scaled ribosome densities (normalization window of 300 codons up- and downstream of TMD start, position 0). Full emergence of TMDs from the ribosome exit tunnel is indicated by the red dotted line at codon position 65, assuming an average TMD length of 25 codons and a ribosomal exit tunnel length of 40 codons. (D) Age-dependent effects of GCN-1 dysfunction on the transcriptome (n = 130), translatome (n = 110), total proteome (n = 39), and insoluble proteome (n = 29) of collagens. Young (day 0) and old (day 6) gcn-1(nc40) mutant worms were analyzed relative to young (day 0) and old (day 6) wild-type nematodes, respectively. The horizontal line within boxplots indicates the median; boxes indicate upper and lower quartile and whisker caps 10th–90th percentile, respectively. p values by Holm-Sidak test. See also Tables S1E–S1H, S2A, S2B, S3A, and S3B. (E) Volcano plot representation of label-free proteome analysis of polysome fractions of old (day 6) gcn-1(nc40) mutant worms relative to polysome fractions of day 6 wild-type animals (as in Figure 3G). Selected proteins are annotated. Dotted lines indicate cutoffs for enrichment at the x axis (log2 ± 0.2, ∼1.15-fold) and at the y axis for p values (0.05, −log > 1.33). See also Figure S3F and Table S1I.
Figure S5
Figure S5
GCN-1 is recruited to ribosomes translating hydrophobic 3′ UTRs, TMD proteins, and collagens, related to Figure 5 (A) Logo plots of amino acid enrichment using kplogo analysis (Wu and Bartel124). Sequences (20 aa downstream of annotated stop codon) chosen for analysis were derived from 3′ UTRs bound by GCN-1 (monosomes and disomes; in frame 1) indicated in Figure 5A (right). Numbers indicate the position after the stop codon. The y axis indicates the sum of log p values for each amino acid at a given position. Significantly enriched positions are marked in red. Also see Table S2C. (B) 3′ UTRs are enriched in nonoptimal codons. tRNA adaptation index (tAI) was analyzed for coding sequences (CDSs) (n = 20,190) and 3′ UTRs (n = 14,434) in C. elegans. The horizontal line in the boxplots indicates the median; boxes indicate upper and lower quartile and whisker caps 10th–90th percentile, respectively. p value by unpaired t test. (C) GCN-1 recruitment (log2 enrichment) across transcripts of proteins from different cellular compartments based on monosomes (left) (all transcripts, n = 12,894; cytosol, n = 432; mitochondria, n = 301; integral to membrane n = 2,158; collagens, n = 115) or disomes (right) (all transcripts, n = 16,294; cytosol, n = 590; mitochondria, n = 478; integral to membrane n = 3,838; collagens, n = 129). The horizontal line in the boxplots indicates the median; boxes indicate upper and lower quartile and whisker caps 10th–90th percentile, respectively. p values by Dunnett’s test. See Tables S2D and S2E. (D) Disome enrichment (log2 enrichment) across transcripts of proteins from different cellular compartments (all transcripts, n = 15,036; cytosol, n = 584; mitochondria, n = 479; integral to membrane n = 5,733; collagens, n = 154). (E) GCN-1 dysfunction preferentially stabilizes mRNA levels of integral membrane proteins with multiple TMDs in aged animals. This analysis depicts the number of TMDs that are encoded by GCN-1 target transcripts. These transcripts were defined as meeting two criteria: (1) having 2-fold enrichment by selective ribosome profiling and (2) displaying ∼1.15-fold (log2 0.2) stabilization in the gcn-1(nc40) mutant animals compared with wild type. The distribution of the TMD number in these GCN-1 target transcripts (blue) were compared with the TMD number in all transcripts (white) detected in our experiments in day-0 and day-6 animals. The horizontal line in the boxplots indicates the median; boxes indicate upper and lower quartile and whisker caps 10th–90th percentile, respectively. p value by Holm-Sidak’s test. Also see Table S3C. (F) TMD transcripts are enriched in nonoptimal codons. tAI analysis of all TMD transcripts (white), TMD transcripts stabilized in gcn-1(nc40) mutant nematodes (blue) in comparison with all coding sequences (CDSs, gray). Only transcripts that were detected in both mRNA-seq and GCN-1 selective ribosome profiling were considered for analysis matching the same criteria as in (E) for day-0 and day-6 animals (also see Table S3C). The horizontal line in the boxplots indicates the median; boxes indicate upper and lower quartile and whisker caps 10th–90th percentile, respectively. p value by Holm-Sidak’s test. See Table S3C. (G) Age-dependent effect on TMD protein insolubility in GCN-1-deficient (gcn-1(nc40)) nematodes. TMD proteins identified by mass spectrometry in the insoluble fraction of lysates from young (day 0) and aged (day 6) worms were analyzed. The log2 fold increase in insolubility from day 0 to day 6 is shown. The horizontal line in the boxplots indicates the median; boxes indicate upper and lower quartile and whisker caps 10th–90th percentile, respectively. p value by Dunnett’s test. See also Tables S1E–S1H. (H) Age-dependent effect of GCN-1 dysfunction on translational pausing at tripeptide motifs. Translational pause scores were analyzed from ribosome profiling data for tripeptide motifs in young (x axis, day 0) and old (y axis, day 6) gcn-1(nc40) mutant animals compared with age-matched wild-type animals (n = 18,612 motifs). PP containing motifs are highlighted in blue and KK or RR motifs in orange. The pause score is calculated as the sum of normalized ribosome densities on each triplet amino acid motif. Only transcripts with at least 10 reads and a minimum length of 100 nt were considered for the analysis. (I) Normalized ribosome occupancy (mean scaled) centered around onset of polyproline stretch (x = 0; dashed vertical line; with at least 8 out of 12 residues being proline) in aged (n = 192 positions from 142 genes) wild-type (gray) and gcn-1(nc40) (blue) animals. The light gray (wild type) and light blue (gcn-1(nc40)) shaded areas indicate the 95% confidence interval. (J) Codon recruitment coefficients calculated as the Pearson’s correlation coefficient of GCN-1 recruitment (monosomes [x axis] and disomes [y axis]) and codon frequency of transcripts reveal increased GCN-1 recruitment to nonoptimal codons. Codon optimality is represented as a color gradient from blue (optimal) to red (nonoptimal). (K) Dysfunction of GCN-1 (in gcn-1(nc40) mutant) results in an age-dependent decrease of ribosome pausing at nonoptimal codons. Codon enrichment at A-site of GCN-1-IPed ribosomes relative to total input in (H) (x axis) is compared with codon enrichment at A-site of wild-type relative to gcn-1(nc40) mutant nematodes. Codon optimality (tAI) is indicated by color-scale (red, low codon optimality; blue, high codon optimality). Statistics by Spearman’s correlation (ρ = 0.4902, p = 6.1e−5). Line represents linear regression fit.
Figure S6
Figure S6
GCN1 function is conserved in HEK293T cells, related to Figure 6 (A) Immunoblot analysis of eRF3 upon treatment of HEK293T cells with CC-885 (10 nM) and G418 (20 μg/mL) for 4 h to induce readthrough (n = 3). (B) GCN1 recruitment (log2 enrichment) based on selective ribosome profiling in untreated HEK293T cells across transcripts of proteins from different cellular compartments (all transcripts, n = 16,246; cytosol, n = 4,488; mitochondria, n = 1,463; integral to membrane n = 3,301; collagens, n = 60). The horizontal line in the boxplots indicates the median; boxes indicate upper and lower quartile and whisker caps 10th–90th percentile, respectively. p values by Dunnett’s test. See Table S2G. (C) Sucrose density gradient fractionation of HEK293T cells treated with CC-885 and G418 as in (A). The dotted lines delineate fractions collected for proteome analysis shown in Figure 6C. (D) Immunoblot analysis of single-cell-sorted polyclonal GCN1 deletion cells. Clone 8 (red square) was chosen for the experiments in Figures 6D, S6D, and S6E. (E) Representative immunoblot analysis of eIF2α and p38 phosphorylation during eRF3 depletion upon treatment of cells with CC-885 and G418 for the times indicated. Related to Figure 6D. (F) Representative immunoblot analysis of eRF3 depletion upon treatment of wild-type and GCN1 KO cells with CC-885 and G418 for the times indicated. Related to Figure 6D. (G) Schematic overview of SLAM-seq workflow. Preexisting mRNAs are labeled for 24 h with 4-thiouridine (4sU). Then the media is exchanged with 100X uridine-containing media, which marks the onset of the chase. Over time, the 4sU-labeled mRNAs will be degraded. The prelabeled mRNA can be distinguished from newly synthesized mRNA by alkylating the 4sU-labeled sites, leading to T > C conversions upon reverse transcription. The loss of T > C conversions over time allows the calculation of mRNA half-lives. (H) Immunoblot analysis of ribosomes purified by centrifugation through a sucrose cushion with antibodies against GCN1, HSPA8, eRF1, CNOT3, CCT4, RPL29, and RPS5 (left). Blots were quantified by densitometry (right) (n = 3). Error bars represent mean ± SEM. p values by Holm-Sidak’s test. (I and J) (I) Examples of mRNA turnover profiles of two multipass TMD-encoding transcripts. SLC16A9, 12 TMD segments and (J) SLC9A6, 11 TMD segments. Each time point (0, 2, 4, and 8 h) is represented by dots, and error bars indicate SEM. The lines indicate nonlinear fits and the light-colored shaded area the 95% confidence intervals. (K) Loss of GCN1 generally dampens codon dependence of mRNA turnover rates, which correlate with codon optimality, represented by a color gradient from blue (optimal) to red (nonoptimal) based on tAI scores. Dotted line indicates no difference in CSC between wild-type and GCN1 knockout cells. Solid line indicates observed change in CSC with shaded area representing the 95% confidence interval.
Figure 6
Figure 6
GCN1 function is conserved and critical for stress signaling and mRNA turnover in human cells (A) Metagene plots of GCN1-selective ribosome profiling data from HEK293T cells upon pharmacologically induced readthrough. GCN1-IPed ribosomes (monosomes) and total input control are shown. When indicated, cells were treated for 4 h with G418 (20 μg/mL) and CC-885 (10 nM). (B) Distribution of RPFs of GCN1-IPed ribosomes and total input control in 3′ UTR regions in treated (CC-885 + G418; purple) and untreated cells (gray). Mean values are indicated above bars. (C) Volcano plot representation of label-free proteome analysis of polysome fractions from HEK293T cells treated with G418 and CC-885 as in (A) to induce readthrough relative to polysome fractions of untreated cells. Dotted lines indicate cutoffs for enrichment at the y axis (log2 ± 0.2, ∼1.15-fold) and at the y axis for p values (0.05, −log > 1.33). See also Figure S6B and Table S1J. (D) Integrated stress response activation upon induced readthrough. Wild-type and GCN1-deleted HEK293T cells were treated with CC-885/G418 as in (A) for the times indicated. Phospho (P)-eIF2α and P-p38 were detected by immunoblotting of cell lysates and quantified by densitometry. Error bars represent mean ± SEM (n = 3). p values by Holm-Sidak test. (E) mRNA half-life analysis using SLAM-seq in wild-type and GCN1-deleted cells (n = 5,455), all TMD-encoding transcripts (n = 698) and TMD-encoding transcripts with >3 TMD segments (n =168). The horizontal line within boxplots indicates the median; (+) the mean; boxes indicate upper and lower quartile and whisker caps 10th–90th percentile, respectively. p values were calculated by Holm-Sidak test. (F) Effect of GCN1 deletion on codon-dependent mRNA decay. Relationship between frequency of UUA(Leu) codons on mRNA half-life. All mRNAs satisfying the goodness of fit (nonlinear regression) criterion of R2 > 0.6 for decay curves (based on T > C conversion rates) were included in the analysis (wild type: n = 8,571; GCN1 knockout [KO]: n = 5,896). The horizontal line within boxplots indicates the median; boxes indicate upper and lower quartile and whisker caps 10th–90th percentile, respectively. ∗∗∗∗p < 0.0001 calculated by Holm-Sidak test.
Figure 7
Figure 7
Working model of BAG6 complex and GCN1-CCR4/NOT in readthrough mitigation and proteome surveillance (A) Model of readthrough mitigation. Readthrough proteins with hydrophobic CTEs resemble TA-proteins and are recognized (co- or posttransationally) by SGTA, which may be recruited to ribosomes before hydrophobic CTEs emerge. Normal TA-proteins are transferred to the membrane targeting module comprising GET4 and ASNA1 (GET3), while, aberrant CTE proteins are captured by the BAG6 complex for RNF126-mediated ubiquitylation and proteasomal degradation. CTE proteins escaping BAG6 surveillance are sequestered by sHSPs into inclusions. Ribosomes translating into hydrophobic 3′ UTRs slow at nonoptimal codons. Colliding ribosomes are recognized by GCN1, which recruits CCR4/NOT to initiate mRNA decay. (B) Model of general translational surveillance by GCN1. Nonoptimal codons, enriched in TMD protein and collagen transcripts, cause ribosome slowdown and (transient) collisions. GCN1 engages these ribosomes and stabilizes disomes, thereby increasing time available for membrane protein assembly and/or association of chaperones for cotranslational folding. Prolonged ribosome (disome) dwell times, due to biogenesis problems that remain unresolved, may recruit CCR4/NOT to initiate mRNA degradation, thereby limiting aberrant protein production. Recruitment of release factor eRF1 may induce premature chain termination.

References

    1. Schuller A.P., Green R. Roadblocks and resolutions in eukaryotic translation. Nat. Rev. Mol. Cell Biol. 2018;19:526–541. doi: 10.1038/s41580-018-0011-4. - DOI - PMC - PubMed
    1. Wolin S.L., Maquat L.E. Cellular RNA surveillance in health and disease. Science. 2019;366:822–827. doi: 10.1126/science.aax2957. - DOI - PMC - PubMed
    1. López-Otín C., Blasco M.A., Partridge L., Serrano M., Kroemer G. The hallmarks of aging. Cell. 2013;153:1194–1217. doi: 10.1016/j.cell.2013.05.039. - DOI - PMC - PubMed
    1. Steffen K.K., Dillin A. A ribosomal perspective on proteostasis and aging. Cell Metab. 2016;23:1004–1012. doi: 10.1016/j.cmet.2016.05.013. - DOI - PubMed
    1. Stein K.C., Morales-Polanco F., van der Lienden J., Rainbolt T.K., Frydman J. Ageing exacerbates ribosome pausing to disrupt cotranslational proteostasis. Nature. 2022;601:637–642. doi: 10.1038/s41586-021-04295-4. - DOI - PMC - PubMed

Publication types