. 2023 Jul 6;30(7):973-986.e11.
doi: 10.1016/j.stem.2023.05.015. Epub 2023 Jun 19.

Advanced human iPSC-based preclinical model for Parkinson's disease with optogenetic alpha-synuclein aggregation

Affiliations

Advanced human iPSC-based preclinical model for Parkinson's disease with optogenetic alpha-synuclein aggregation

Min Seong Kim et al. Cell Stem Cell. .

Abstract

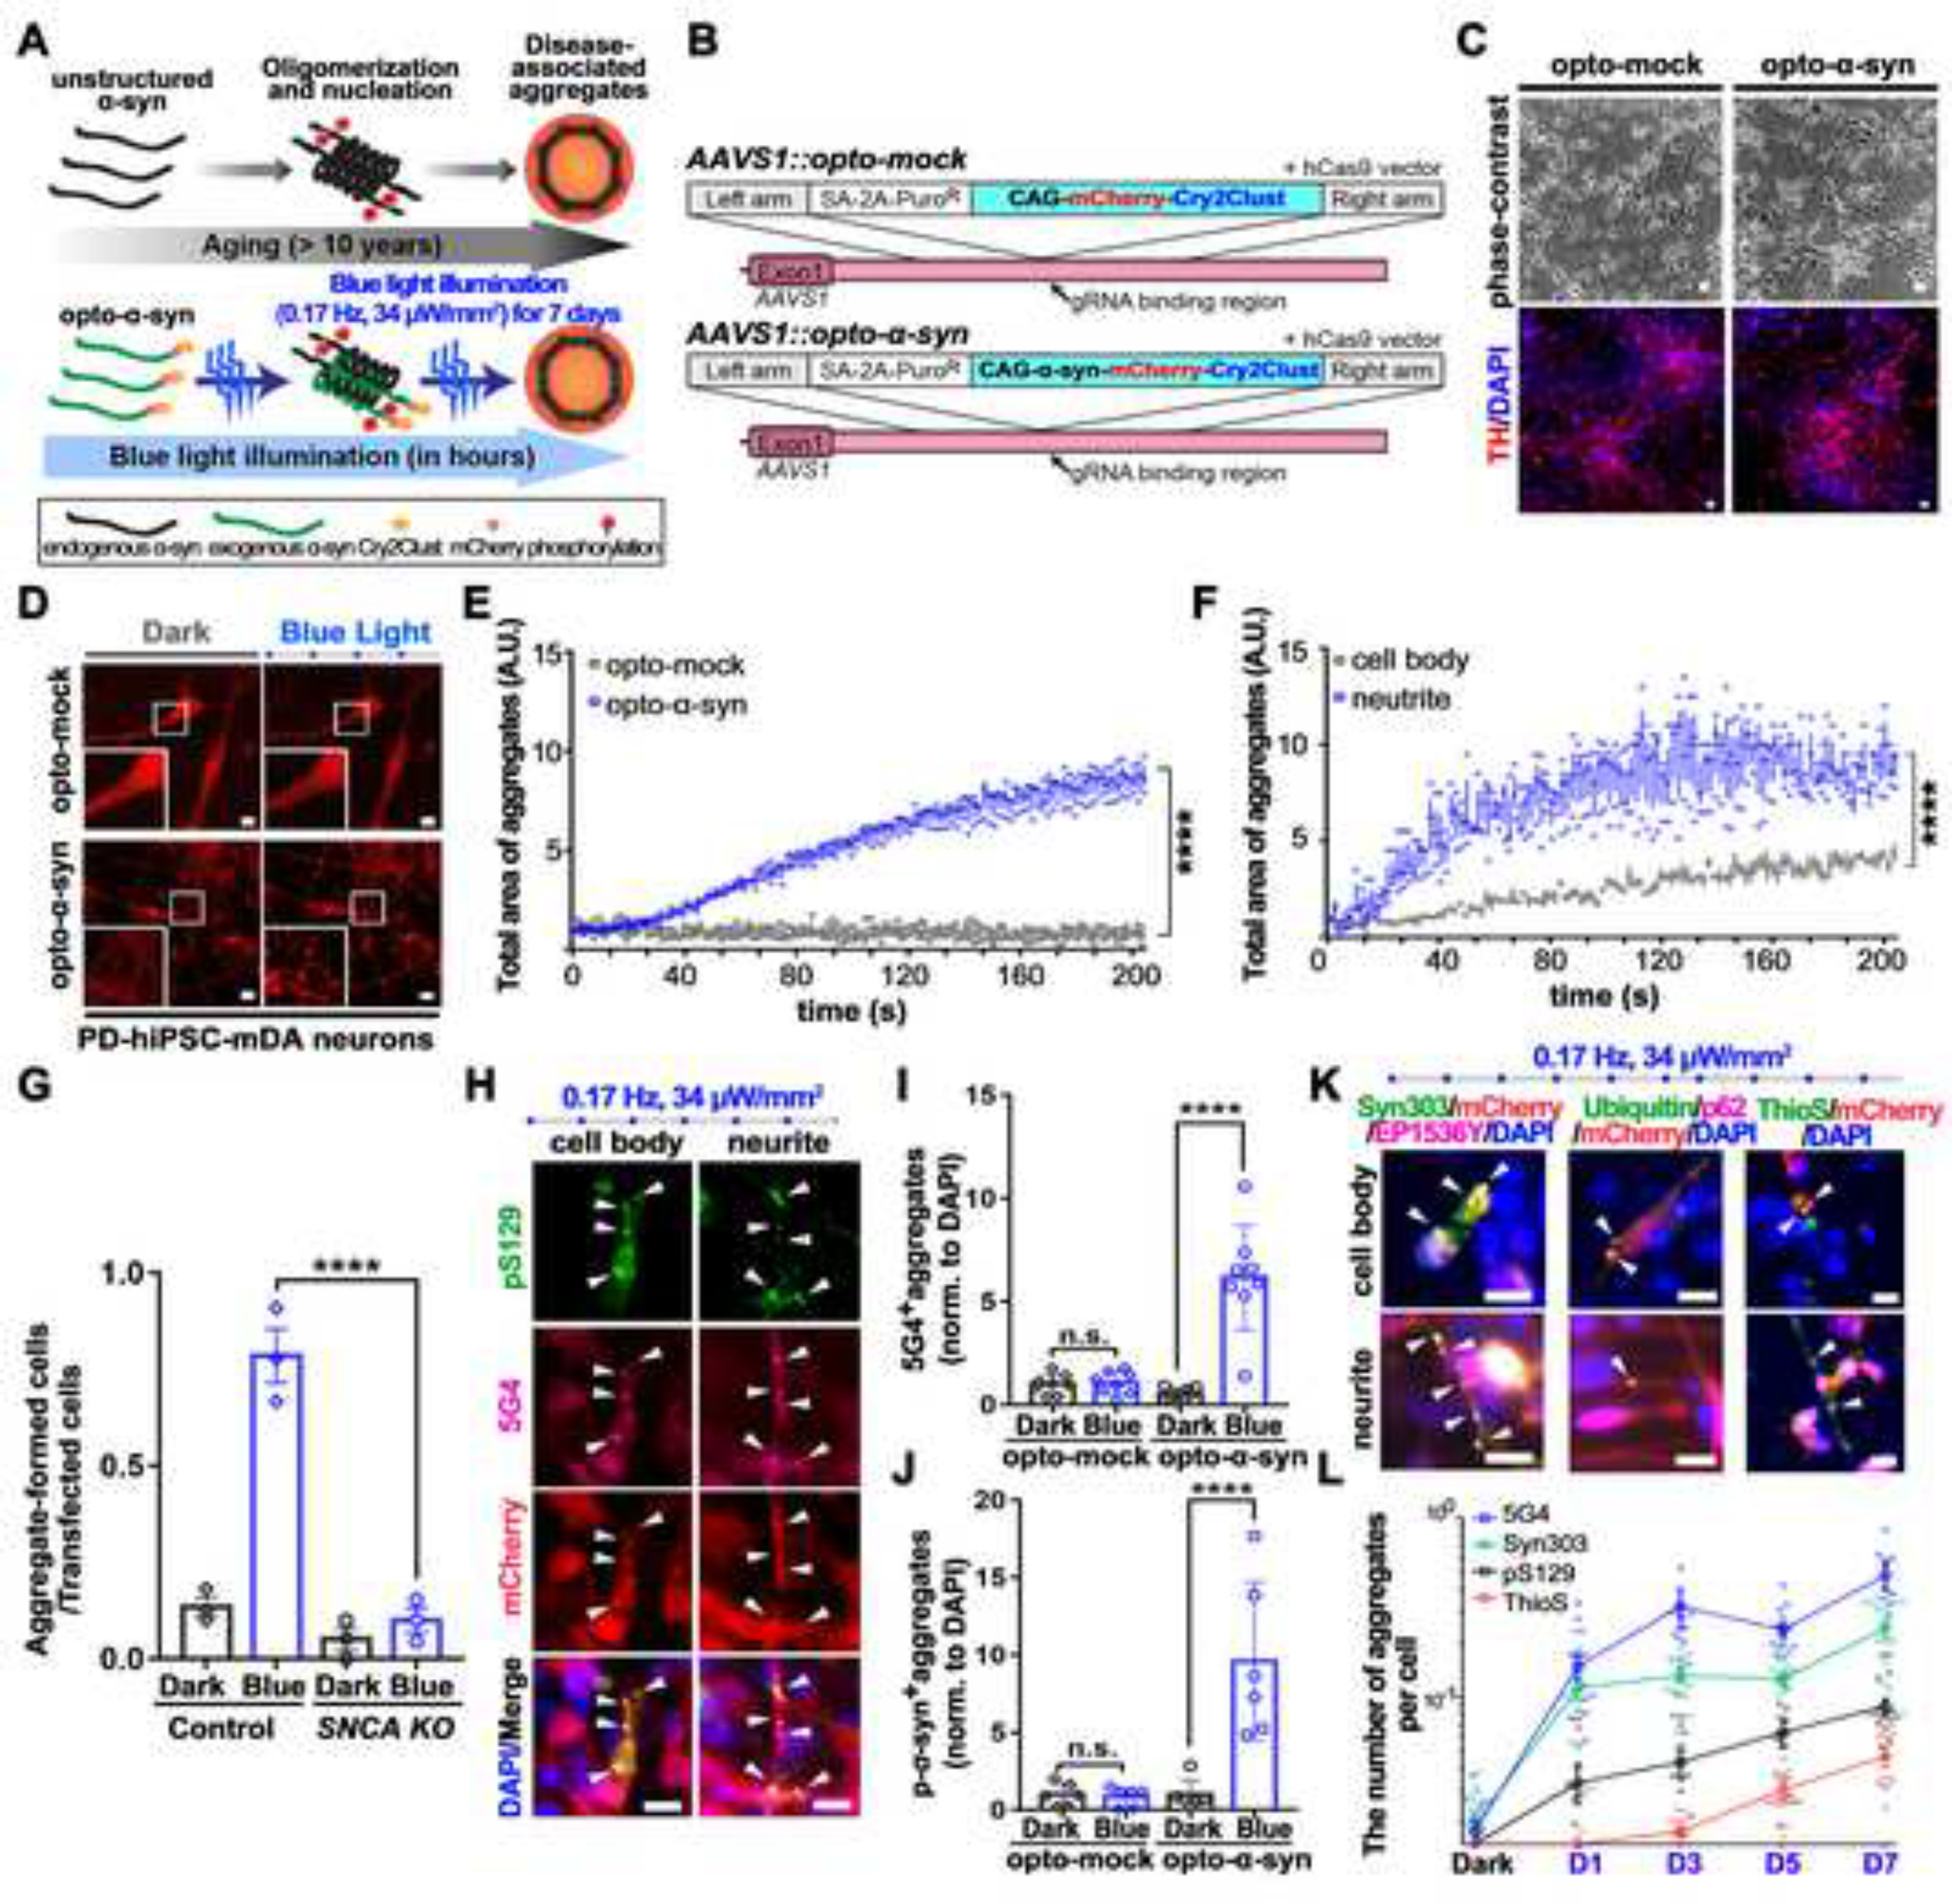
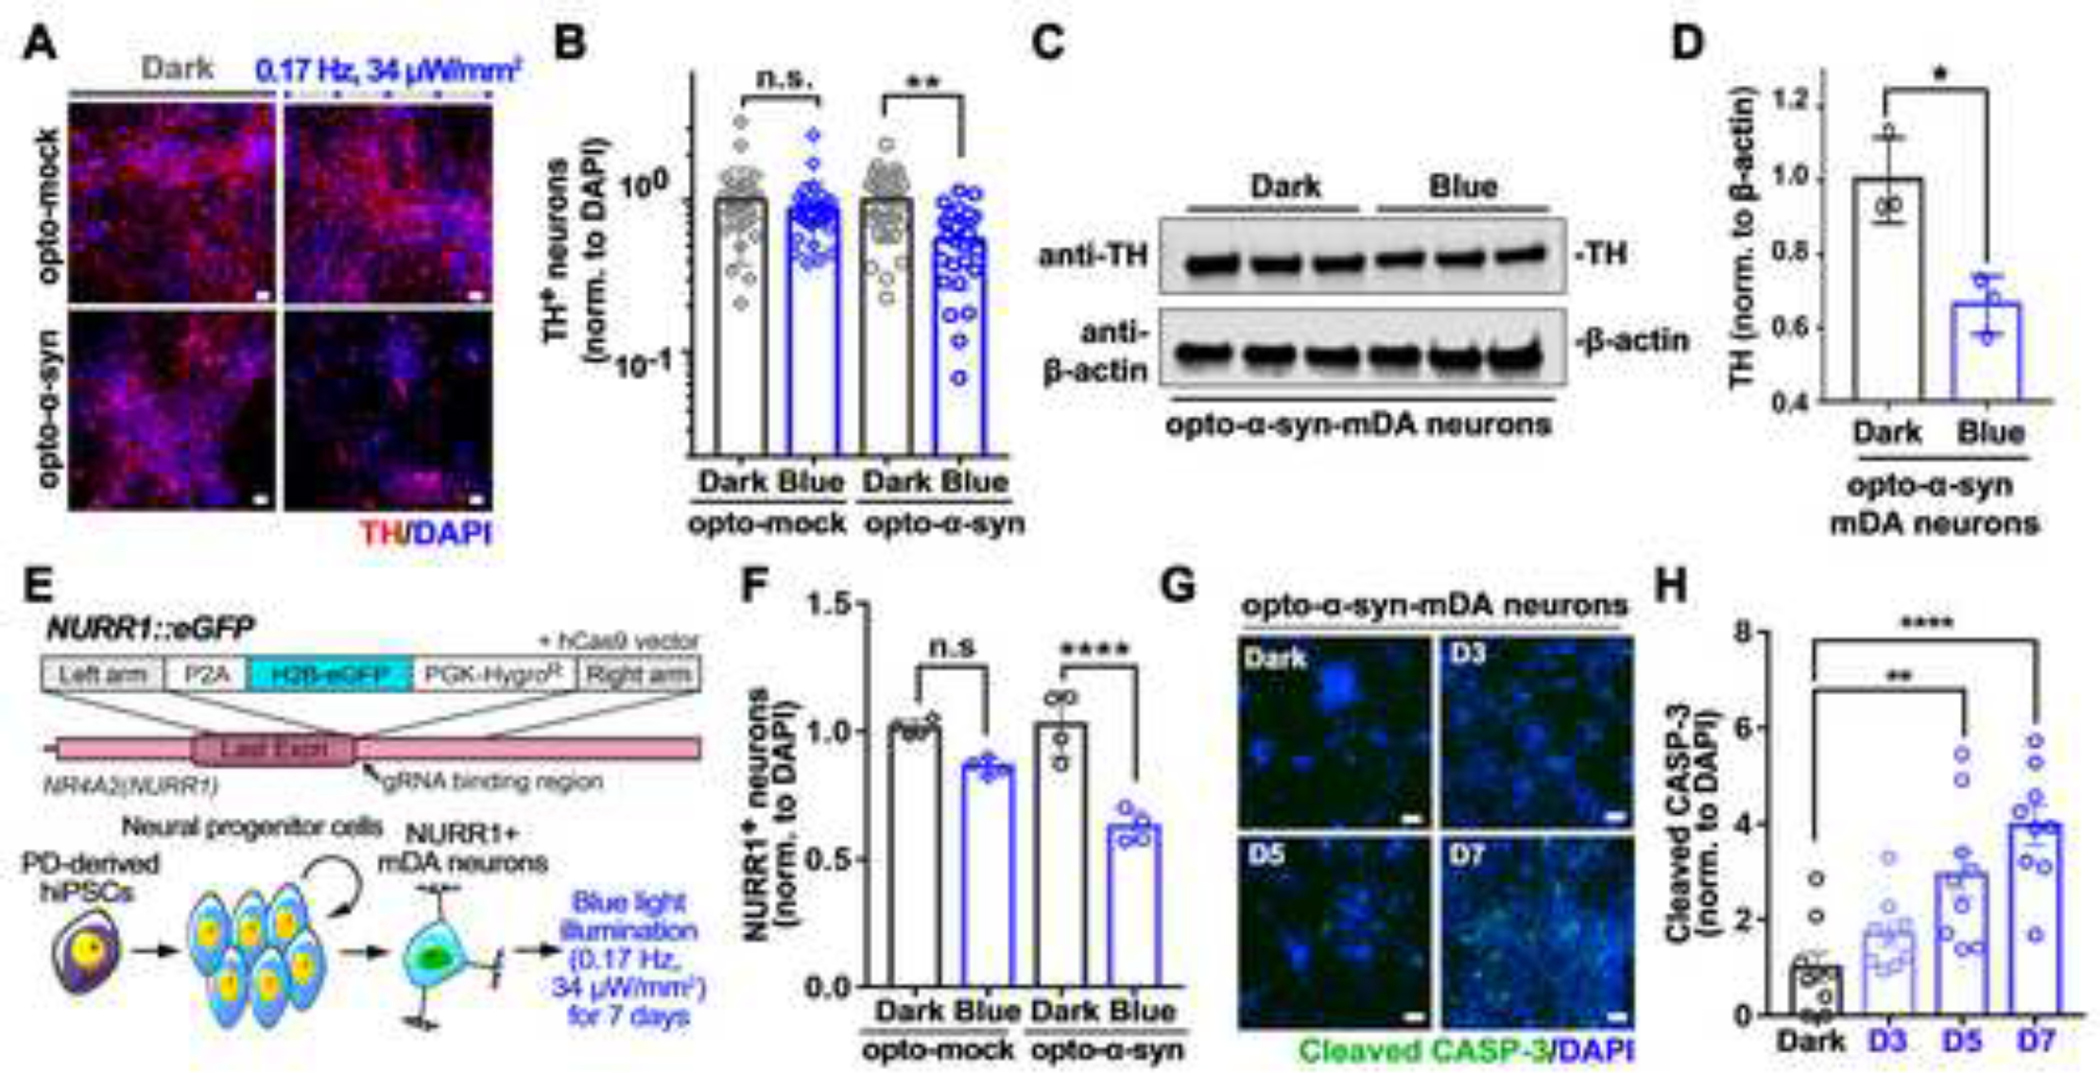
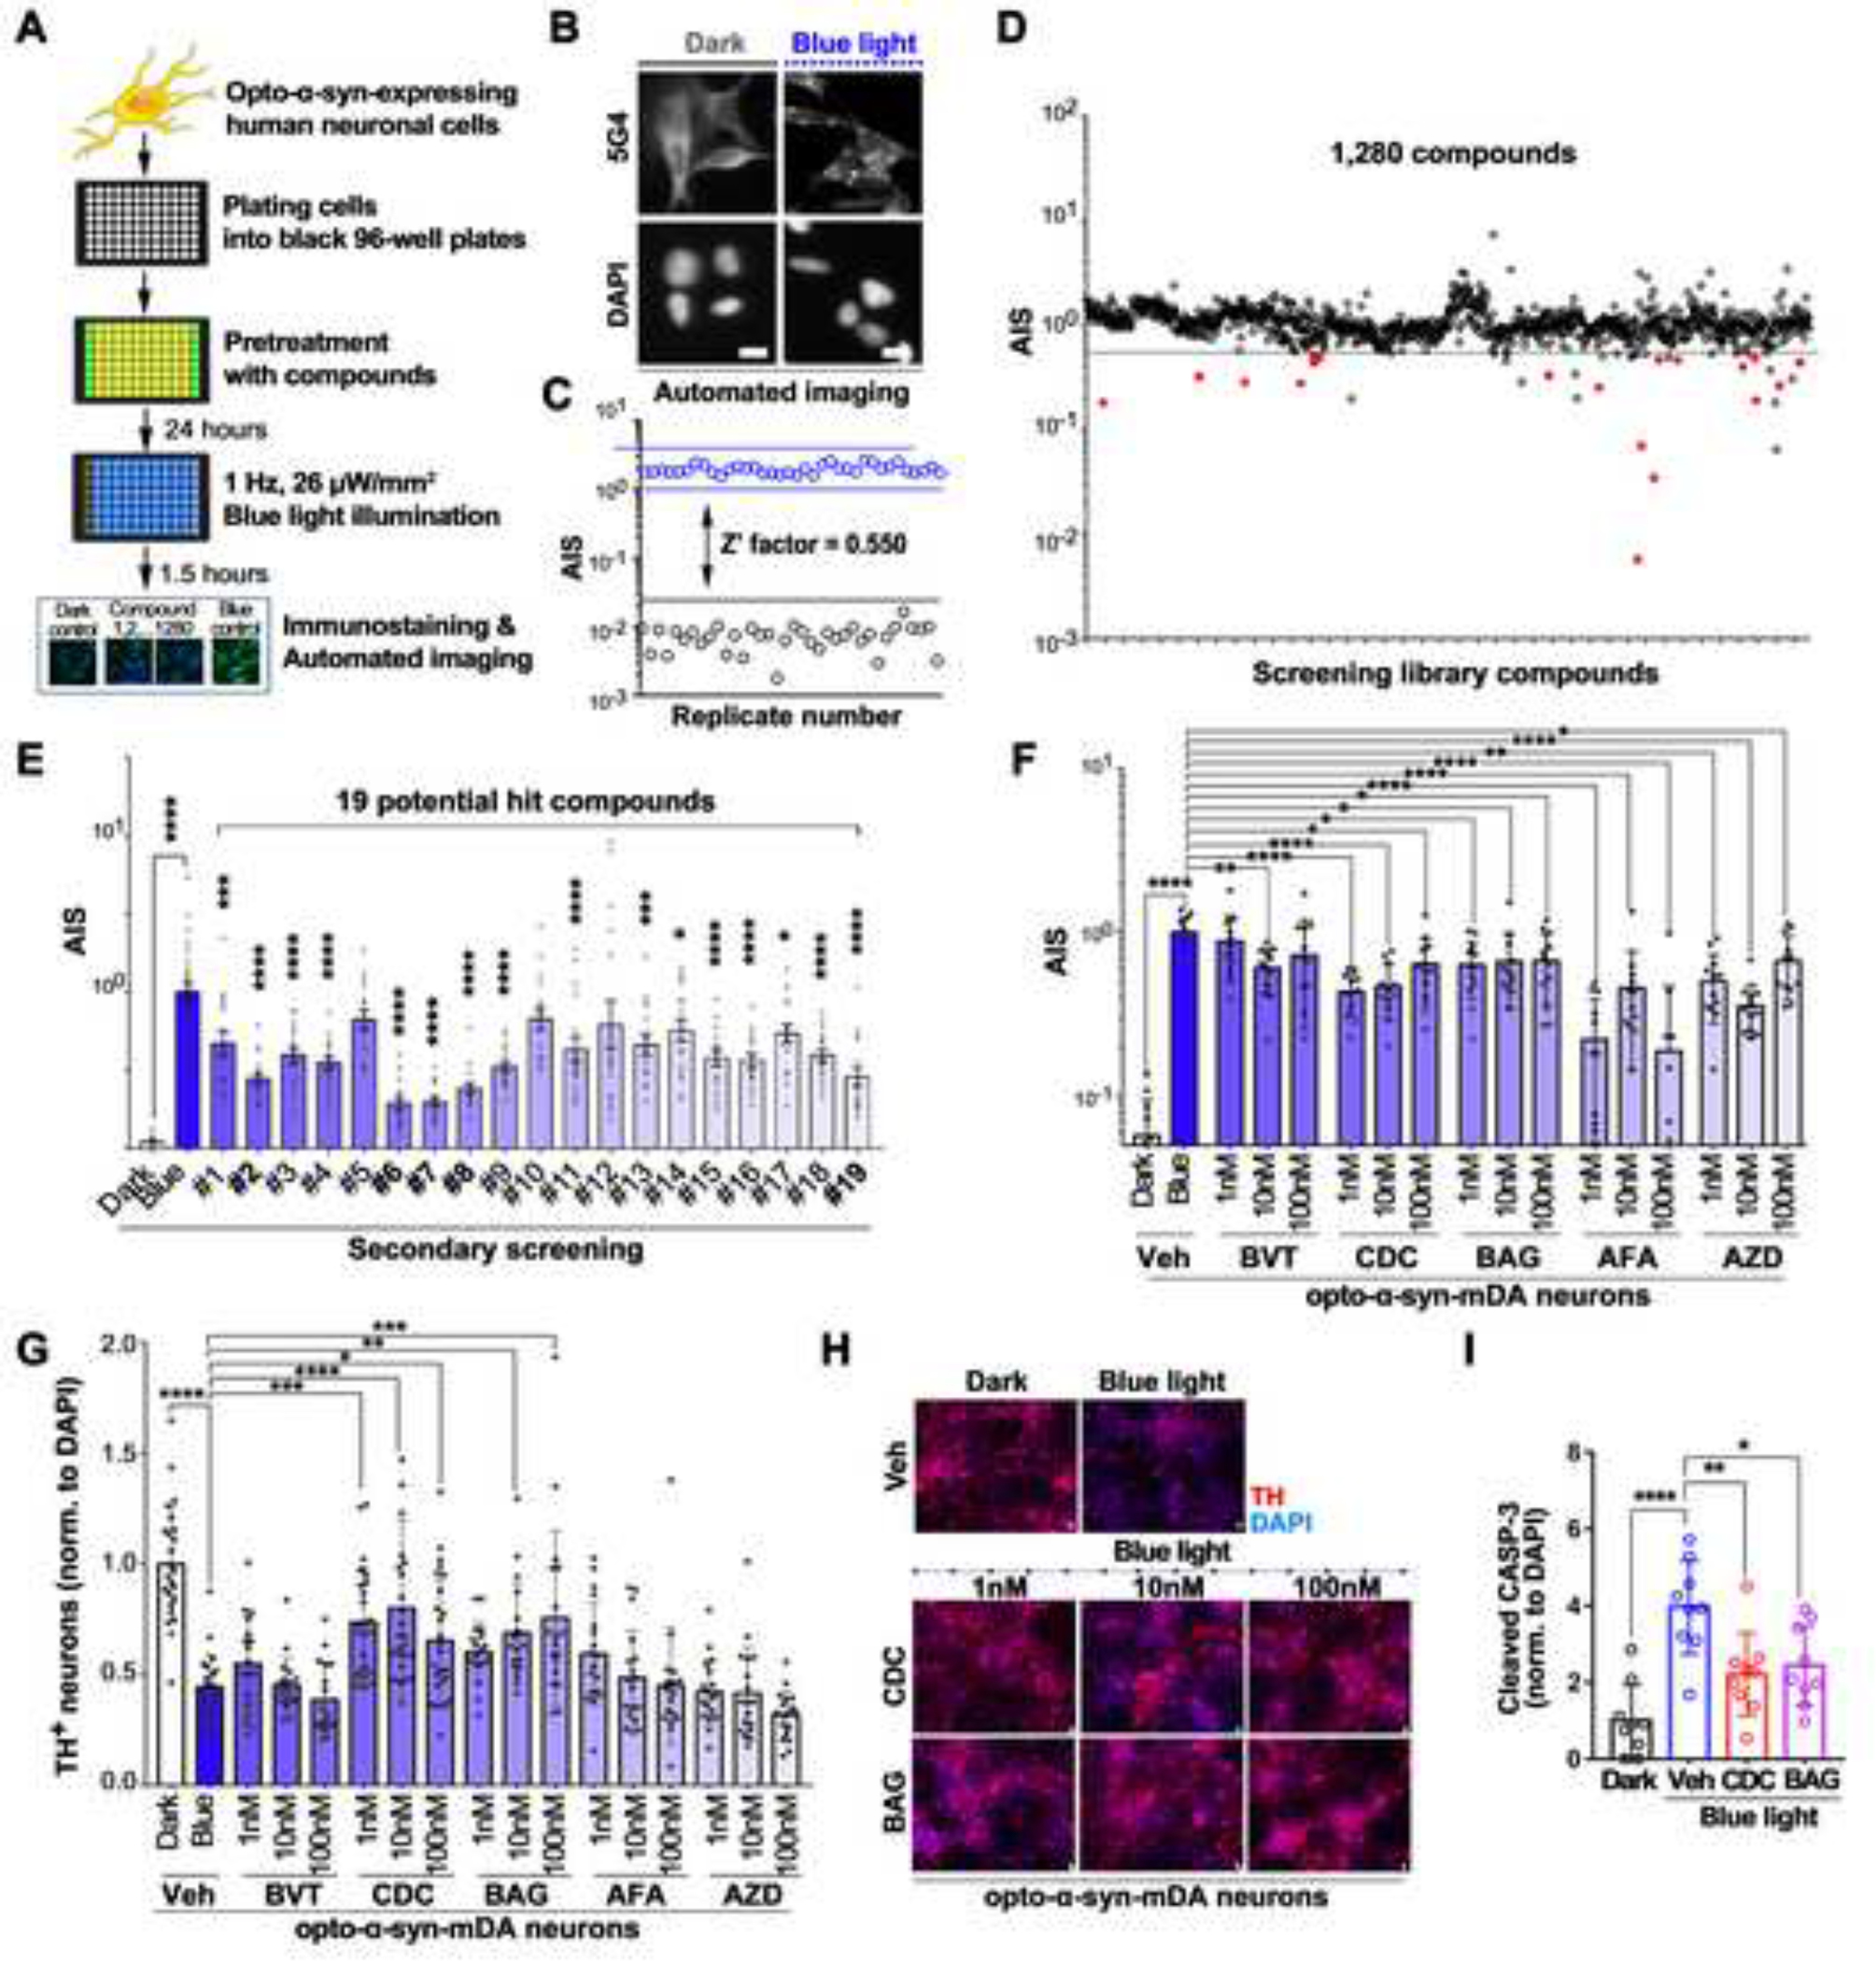
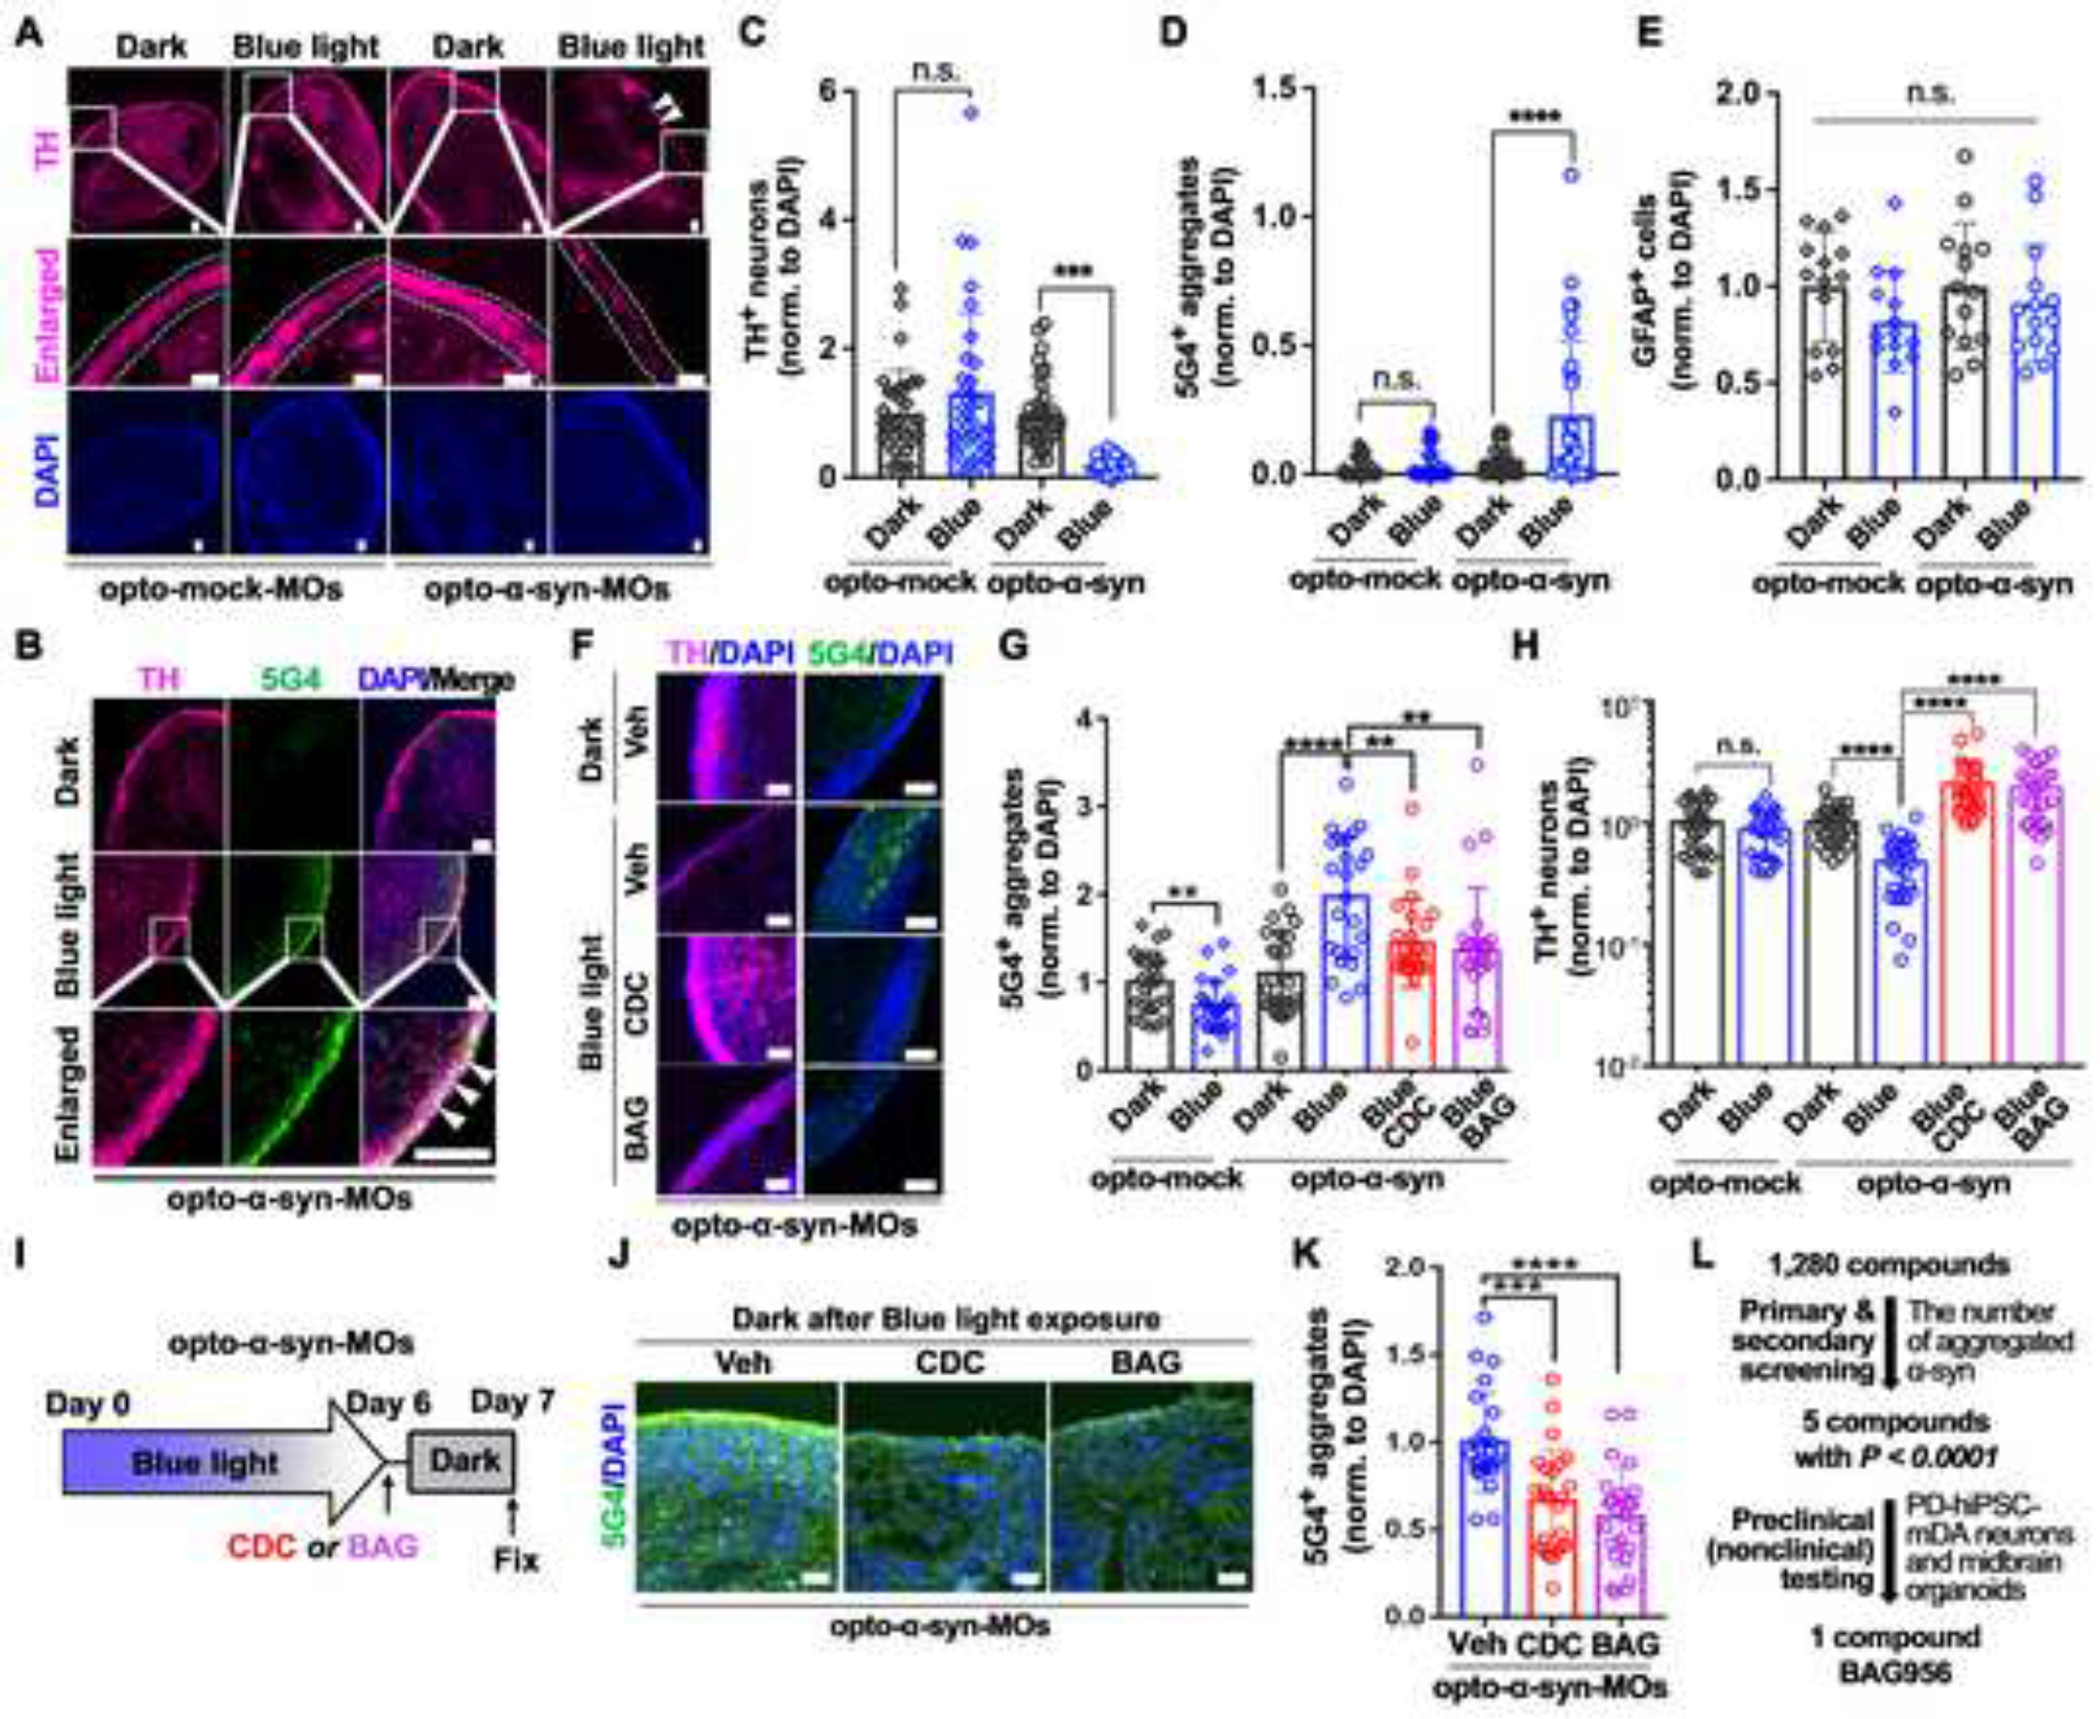
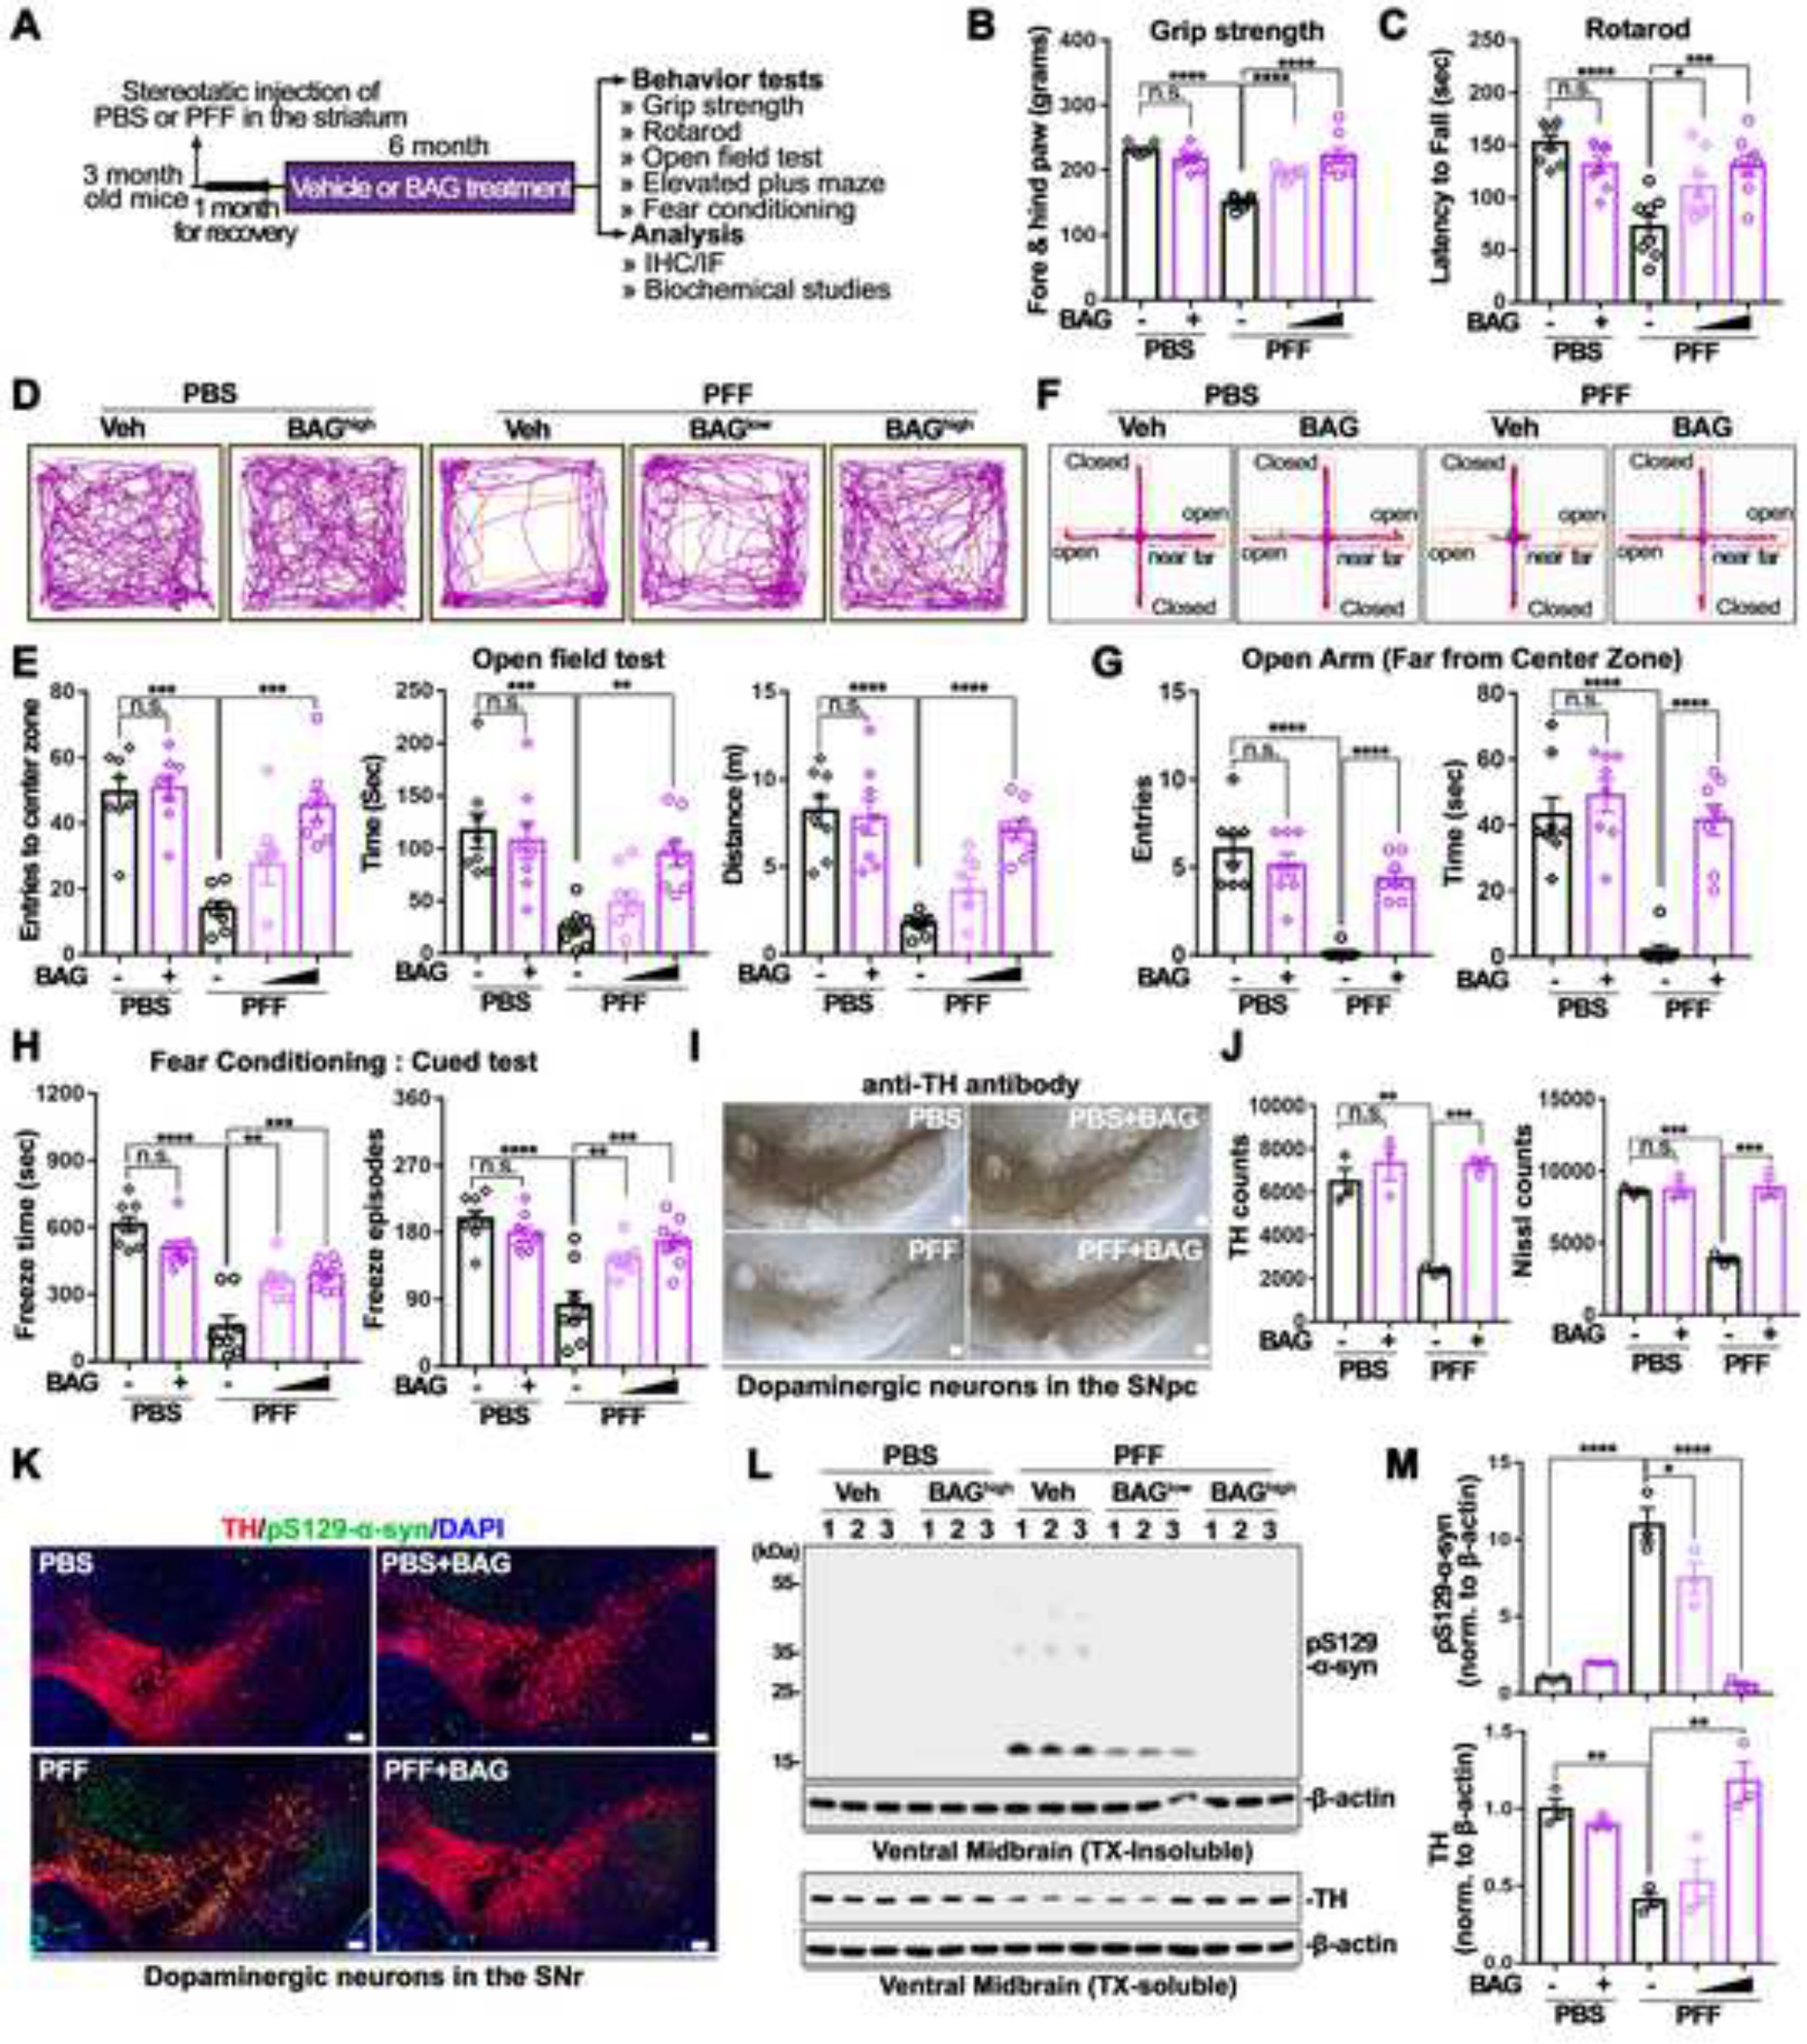
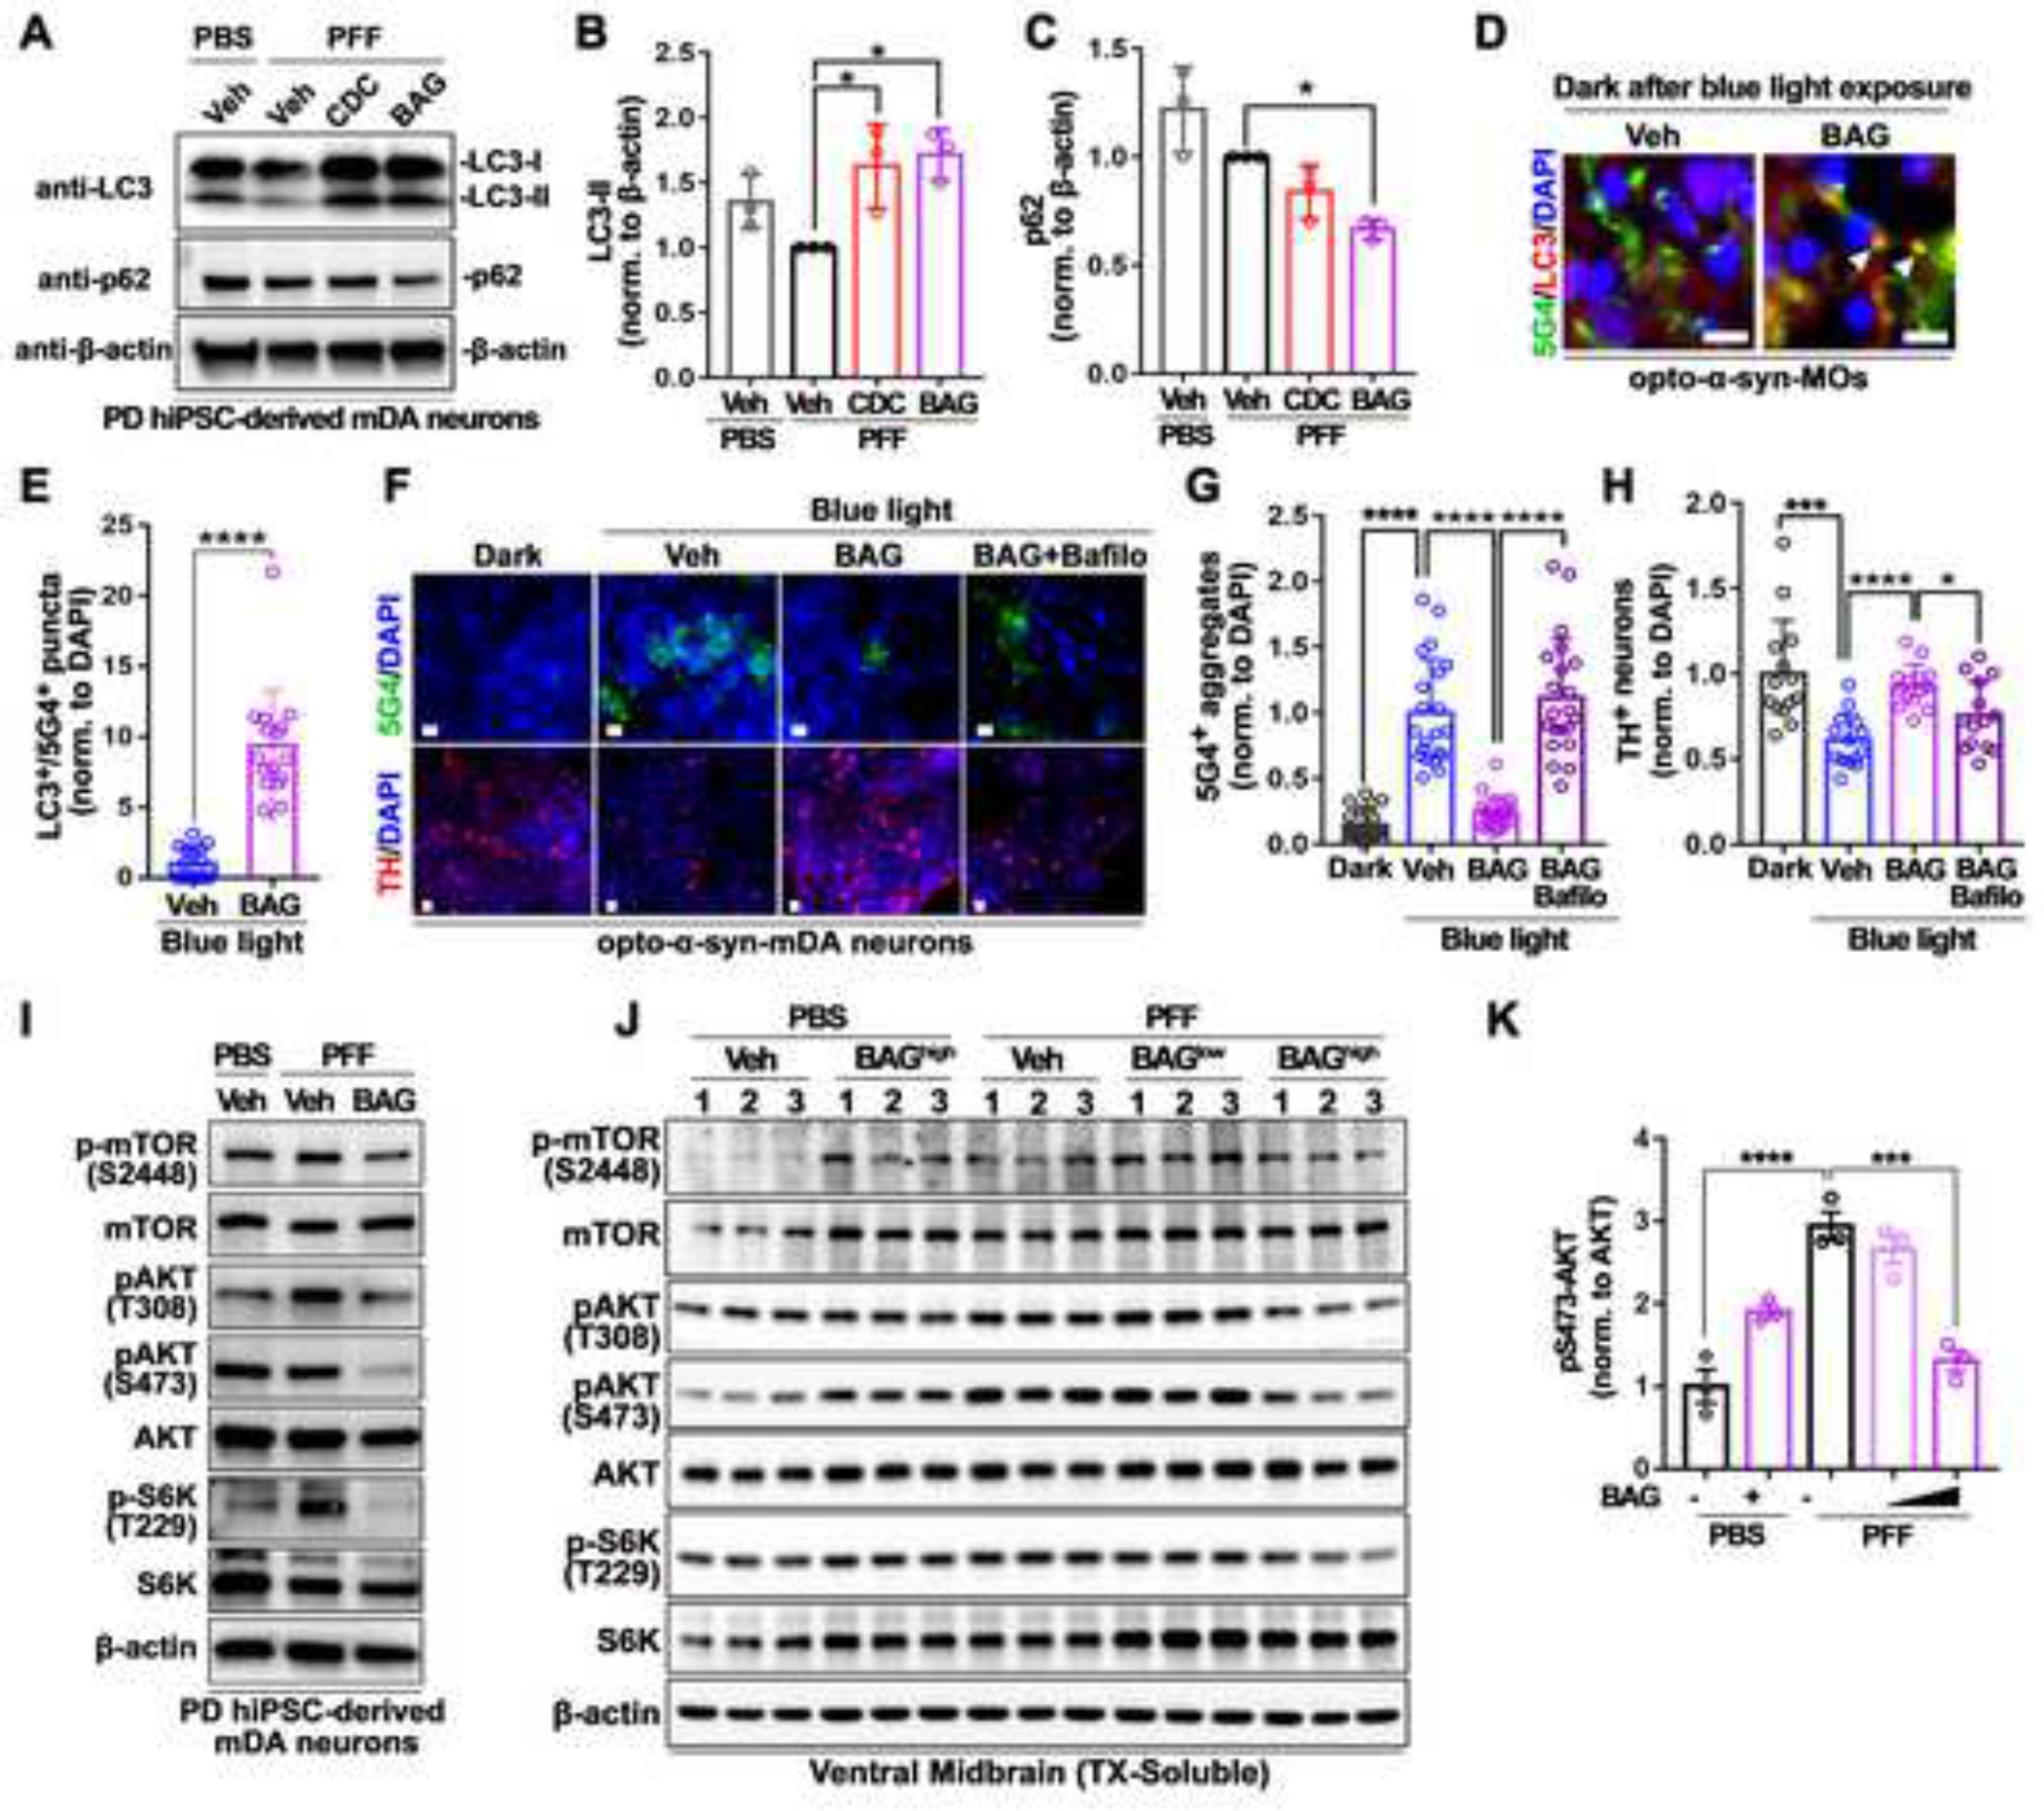
Human induced pluripotent stem cells (hiPSCs) offer advantages for disease modeling and drug discovery. However, recreating innate cellular pathologies, particularly in late-onset neurodegenerative diseases with accumulated protein aggregates including Parkinson's disease (PD), has been challenging. To overcome this barrier, we developed an optogenetics-assisted α-synuclein (α-syn) aggregation induction system (OASIS) that rapidly induces α-syn aggregates and toxicity in PD hiPSC-midbrain dopaminergic neurons and midbrain organoids. Our OASIS-based primary compound screening with SH-SY5Y cells identified 5 candidates that were secondarily validated with OASIS PD hiPSC-midbrain dopaminergic neurons and midbrain organoids, leading us to finally select BAG956. Furthermore, BAG956 significantly reverses characteristic PD phenotypes in α-syn preformed fibril models in vitro and in vivo by promoting autophagic clearance of pathological α-syn aggregates. Following the FDA Modernization Act 2.0's emphasis on alternative non-animal testing methods, our OASIS can serve as an animal-free preclinical test model (newly termed "nonclinical test") for the synucleinopathy drug development.

Keywords: Parkinson’s disease; alpha-synuclein; dopaminergic neurons; human pluripotent stem cell; opto-alpha-synuclein; optogenetics; organoid; protein aggregation; α-syn PFFs; α-synuclein preformed fibrils.


Conflict of interest statement

Declaration of interests M.S.K., E.A.R., H.S.K., and G.L. are inventors of a patent related to this study. G.L. is a scientific founder, shareholder, and serves as scientific advisors of Vita Therapeutics.

Figures

Figure 1.
Figure 1.. Light-induced disease-associated α-syn aggregation in PD hiPSC-derived mDA neurons
(A) Schematic representation of the optogenetics-assisted α-syn aggregation induction system (OASIS). (B) Schematic for AAVS1 locus targeting using homologous recombination enhanced by CRISPR/Cas9 system. SA, splice acceptor. (C) Representative images of differentiated TH+ mDA neurons from opto-mock or opto-α-syn PD hiPSCs. (D) The opto-α-syn aggregates formation in PD-hiPSC-mDA neurons. (E) Quantification of the total area of opto-α-syn aggregate in mDA neurons expressing opto-mock or opto-α-syn over time using automated live-cell imaging system. (n = 3, each experiment contains at least 40 cells, ordinary two-way ANOVA). (F) Quantification of the total area of opto-α-syn aggregate in cell body or neurite of opto-α-syn-expressing mDA neurons over time using automated live-cell imaging system. (n = 3, each experiment contains at least 40 cells, ordinary two-way ANOVA). (G) Quantification of aggregate-forming cells in control or SNCA−/− cells (n = 3, one-way ANOVA followed by Tukey’s post hoc test). (H) Representative images of light-induced α-syn aggregates in opto-α-syn-mDA neurons. (I) Quantification of the number of 5G4+ aggregates in mDA neurons (n = 8, one-way ANOVA followed by Tukey’s post hoc test). (J) Quantification of the number of pS129-α-syn+ aggregates in mDA neurons (n = 6, one-way ANOVA followed by Tukey’s post hoc test). (K) Co-localization of mCherry+ aggregates with indicated antibodies or Thioflavin S (ThioS) (White arrowheads). (L) Quantification of the indicated marker aggregates at the indicated time-point after blue light illumination in opto-α-syn-mDA neurons (n = 12). Scale bars, 10 μm. Bars represent means ± SEM. n.s., not significant. ****P < 0.0001. Blue light condition: 34 μW/mm2 at 470 nm, 0.17 Hz, 0.5 s, for 7 days for fixed-cell imaging, 1.5 μW at 488nm, 0.5 Hz, 1 s for live-cell imaging.
Figure 2.
Figure 2.. Selective death of PD hiPSC-derived mDA neurons induced by the optogenetics-assisted α-syn aggregation induction system.
(A) Representative images of TH+ neurons kept in dark or exposed to blue light. (B) Quantification of the number of TH+ neurons in response to blue light (n = 30, one-way ANOVA followed by Tukey’s post hoc test). (C) Representative western blot images of TH in opto-α-syn-mDA neurons kept in dark or exposed to blue light. (D) Quantification of the level of TH in opto-α-syn-mDA neurons kept in dark or exposed to blue light (n = 3, two-tailed unpaired t-test). (E) Schematic representation for NR4A2 (also known as NURR1) locus targeted by CRISPR/Cas9 system and differentiation of NURR1::GFP+ neurons. (F) Quantification of NURR1::GFP+ neurons with or without blue light (n = 4, one-way ANOVA followed by Tukey’s post hoc test). (G) Representative immunostaining images of cleaved caspase-3 in opto-α-syn-mDA neurons at the indicated time point in response to blue light stimulation. (H) Quantification of cleaved caspase-3 in opto-α-syn-mDA neurons in response to blue light stimulation (n = 9, one-way ANOVA followed by Tukey’s post hoc test). Scale bars, 10 μm. Bars represent means ± SEM. n.s., not significant, *P < 0.05, **P < 0.01, ***P < 0.001, ****P < 0.0001. Blue light condition: 34 μW/mm2 at 470 nm, 0.17 Hz, 0.5 s.
Figure 3.
Figure 3.. High-content imaging screening with the optogenetics-assisted α-syn aggregation induction system
(A) Schematic representation of the process of high-content imaging (HCI) screening with optogenetics-assisted α-synuclein aggregation induction system (OASIS). (B) Representative images of 5G4+ aggregates or DAPI+ cells by automated imaging in SH-SY5Y cells. (C) Calculation of Z’-factor for HCI screening with OASIS; opto-α-syn cells in dark (black circles) or exposed to blue light (blue circles) (n = 36). (D) Scatter plot of compounds screened in the OASIS-based HCI assay. For each compound, the corresponding Aggregates Induction Score (AIS) observed in the drug-treated is plotted (positive control was set as 1.0). 1,280 compounds were screened, and red closed circles represent 19 selected potential hit compounds, with an AIS value of less than 0.5. (E) Validating effect of 19 compounds on α-syn aggregation in SH-SY5Y cells under 24-well plate culture conditions (n = 31 or 42, one-way ANOVA followed by Dunnett’s post hoc test). Detailed information of numbered compounds was described in Table S1. (F) Quantification of AIS in opto-α-syn-mDA neurons kept in dark or exposed to blue light with or without 5 selected molecules (n = 12 for BVT (BVT948), BAG (BAG956), AFA (Arcyriaflavin A), and AZD (AZD1480); n =18 for CDC (C 021 dihydrochloride), one-way ANOVA followed by Dunnett’s post hoc test). (G) Quantification of TH+ neurons in opto-α-syn-mDA neurons kept in dark or exposed to blue light with or without 5 selected molecules (n = 18, one-way ANOVA followed by Dunnett’s post hoc test). (H) Representative images of TH+ opto-α-syn-mDA neurons kept in dark or exposed to blue light with or without CDC or BAG treatment. (I) Quantification of cleaved caspase-3 in opto-α-syn-mDA neurons kept in dark or exposed to blue light with or without CDC or BAG treatment (n = 9, one-way ANOVA followed by Dunnett’s post hoc test). Scale bars, 10 μm. Bars represent means ± SEM. n.s., not significant, *P < 0.05, **P < 0.01, ***P < 0.001, ****P < 0.0001.
Figure 4.
Figure 4.. Confirmation of the effects of selected two compounds on the opto-α-syn-expressing PD hiPSC-derived midbrain organoids (MOs).
(A) Representative immunostaining images of TH in opto-mock- or opto-α-syn-MOs kept in dark or exposed to blue light. White dotted lines and arrowheads indicate the area containing TH+ mDA neurons and the decreased level of TH+ neurons, respectively. (B) Representative images of 5G4+ signals in TH+ neurons in opto-α-syn-MOs kept in dark or exposed to blue light. White arrowheads indicate the co-localization between TH+ and 5G4+ signals. (C) Quantification of TH+ neurons in opto-mock- or opto-α-syn-MOs kept in dark or exposed to blue light (n = 32, total 8 organoids, one-way ANOVA followed by Tukey’s post hoc test). (D) Quantification of 5G4+ signals in opto-mock- or opto-α-syn-MOs kept in dark or exposed to blue light (n = 32, total 8 organoids, one-way ANOVA followed by Tukey’s post hoc test). (E) Quantification of GFAP in opto-mock- or opto-α-syn-MOs kept in dark or exposed to blue light. (n = 14, total 8 organoids, one-way ANOVA followed by Tukey’s post hoc test). (F) Representative immunostaining images of TH and 5G4 in opto-α-syn-MOs kept in dark or exposed to blue light with or without CDC or BAG treatment. (G) Quantification of 5G4+ α-syn aggregates in opto-mock- or opto-α-syn-MOs (n = 24, total 8 organoids, two-tailed unpaired t-test). (H) Quantification of TH+ neurons in opto-mock- or opto-α-syn-MOs (n = 24, total 8 organoids, two-tailed unpaired t-test). (I) Schematic representation of degradation efficiency checking system of blue light-induced opto-α-syn aggregates in MOs. Opto-α-syn-MOs were exposed to blue light for 6 days and then kept in dark with vehicle, CDC, or BAG for 1 day. (J) Representative images of 5G4+ α-syn aggregates in opto-α-syn-MOs kept in dark for 1 day with vehicle, CDC, or BAG, after blue light illumination for 6 days. (K) Quantification of 5G4+ signals with or without CDC or BAG in opto-α-syn-MOs (n = 24, total 8 organoids, one-way ANOVA followed by Tukey’s post hoc test). (L) Schematic summary of OASIS-based compound screening. Scale bars, 100 μm. Bars represent means ± SEM. n.s., not significant, *P < 0.05, **P < 0.01, ***P < 0.001, ****P < 0.0001. Blue light condition: 34 μW/mm2 at 470 nm, 0.17 Hz, 0.5 s.
Figure 5.
Figure 5.. Behavioral deficits and PD-like pathologies induced by α-syn PFF injection were recovered by oral administration of BAG 956.
(A) Schematical diagram for behavioral assessment at 7 months after intrastriatal injection of PBS or α-syn PFF (n = 8). PBS injected mice were treated vehicle or BAGhigh (10 mg/kg), whereas α-syn PFF injected mice were orally administered with vehicle, BAGlow (2 mg/kg), or BAGhigh (10 mg/kg). (B) Fore- and hind-limb grip strength test (n = 8, one-way ANOVA followed by Tukey’s post hoc test). (C) Latency to fall from the rotarod test (n = 8, one-way ANOVA followed by Tukey’s post hoc test). (D) Representative showed locomotion and central activity of each group via travelled path in the OFT. (E) The number of entries (left), time spent (middle), and distance travelled (right) in the center zone of the OFT are shown (n = 8, one-way ANOVA followed by Tukey’s post hoc test). (F) Representative movement paths of mice from each group in the EPM (G) The number of entries (left) and time spent (right) in the open area far from center zone are shown (n = 8, one-way ANOVA followed by Tukey’s post hoc test). (H) Evaluation α-syn PFF induced loss of learning and memory by total freeze time and freezing episode from cued FC (n = 8, one-way ANOVA followed by Tukey’s post hoc test). (I) Representative photomicrographs from coronal mesencephalon sections including TH+ and Nissl+ neurons in PBS or α-syn PFF with or without BAG. (J) Quantification of TH+ and Nissl+ neurons in PBS or α-syn PFF with or without BAG (n = 3, one-way ANOVA followed by Tukey’s post hoc test). (K) Representative fluorescence image of anti-pS129-α-syn immunoreactivities from PBS or α-syn PFF with or without BAG treatment. (L) Representative immunoblot from insoluble (upper) and soluble (lower) fraction of ventral midbrain regions. (M) Quantification of pS129-α-syn protein level (upper) and TH level (lower, n = 3, one-way ANOVA followed by Tukey’s post hoc test). Scale bars, 100 μm. Bars represent means ± SEM. n.s., not significant. *P < 0.05, **P < 0.01, ***P < 0.001, ****P < 0.0001.
Figure 6.
Figure 6.. Induction of autophagy-mediated clearance of α-syn-aggregates through inhibition of PI3K-PDK1/AKT/mTOR pathway by BAG 956 treatment
(A) Representative western blot images in PD hiPSC-derived mDA neurons treated with PBS or α-syn PFF with vehicle, BAG, or CDC. (B) Quantification of LC3-II in PD hiPSC-derived mDA neurons treated with PBS or α-syn PFF with vehicle, BAG, or CDC (n = 3, one-way ANOVA followed by Tukey’s post hoc test). (C) Quantification of p62 in PD hiPSC-derived mDA neurons treated with PBS or α-syn PFF with vehicle, BAG, or CDC (n = 3, one-way ANOVA followed by Tukey’s post hoc test). (D) Representative immunostaining images of LC3+/5G4+ co-localized dots (white arrowheads) in opto-α-syn-MOs kept in dark after blue light illumination (6 days). Scale bars, 100 μm. (E) Quantification of LC3+/5G4+ co-localization in opto-α-syn-MOs kept in dark after blue light illumination (n = 16, total 8 organoids, two-tailed unpaired t-test). (F) Representative immunostaining images of 5G4+ α-syn aggregates and TH+ neurons in opto-α-syn-mDA neurons with vehicle, BAG, or BAG and Bafilomycin A1 (Bafilo). Scale bars, 10 μm. (G) Quantification of 5G4+ α-syn aggregates in opto-α-syn-mDA neurons (n = 21, two-tailed unpaired t-test). (H) Quantification of TH+ neurons in opto-α-syn-mDA neurons (n = 14, two-tailed unpaired t-test). (I) Representative western blot images of PI3K/PDK1 downstream targets in PD hiPSC-derived mDA neurons with PBS or α-syn PFF with vehicle or BAG. (J) Representative western blot images of PI3K/PDK1 downstream targets in mouse ventral midbrain with PBS or α-syn PFF with vehicle or BAG. (K) Quantification of pS473-AKT normalized to pan-AKT (n = 3, one-way ANOVA followed by Tukey’s post hoc test) Bars represent means ± SEM. n.s., not significant. *P < 0.05, **P < 0.01, ***P < 0.001, ****P < 0.0001. Blue light condition: 34 μW/mm2 at 470 nm, 0.17 Hz, 0.5 s, for 7 days.

References

    1. Dauer W, and Przedborski S (2003). Parkinson’s disease: mechanisms and models. Neuron 39, 889–909. 10.1016/s0896-6273(03)00568-3. - DOI - PubMed
    1. Olanow CW, and Tatton WG (1999). Etiology and pathogenesis of Parkinson’s disease. Annual review of neuroscience 22, 123–144. 10.1146/annurev.neuro.22.1.123. - DOI - PubMed
    1. Polymeropoulos MH, Lavedan C, Leroy E, Ide SE, Dehejia A, Dutra A, Pike B, Root H, Rubenstein J, Boyer R, et al. (1997). Mutation in the alpha-synuclein gene identified in families with Parkinson’s disease. Science 276, 2045–2047. 10.1126/science.276.5321.2045. - DOI - PubMed
    1. Singleton AB, Farrer M, Johnson J, Singleton A, Hague S, Kachergus J, Hulihan M, Peuralinna T, Dutra A, Nussbaum R, et al. (2003). alpha-Synuclein locus triplication causes Parkinson’s disease. Science 302, 841. 10.1126/science.1090278. - DOI - PubMed
    1. Lee VM, and Trojanowski JQ (2006). Mechanisms of Parkinson’s disease linked to pathological alpha-synuclein: new targets for drug discovery. Neuron 52, 33–38. 10.1016/j.neuron.2006.09.026. - DOI - PubMed

Publication types

MeSH terms