

The Prognostic Significance of Nomogram-Based Pretreatment Inflammatory Indicators in Patients With Esophageal Squamous Cell Carcinoma Receiving Intensity-Modulated Radiotherapy
- PMID: 37339928
- PMCID: PMC10286216
- DOI: 10.1177/10732748231185025
The Prognostic Significance of Nomogram-Based Pretreatment Inflammatory Indicators in Patients With Esophageal Squamous Cell Carcinoma Receiving Intensity-Modulated Radiotherapy
Abstract
Background: At present, there is no objective prognostic index available for patients with esophageal squamous cell carcinoma (ESCC) who underwent intensity-modulated radiotherapy (IMRT). This study is to develop a nomogram based on hematologic inflammatory indices for ESCC patients treated with IMRT.
Methods: 581 patients with ESCC receiving definitive IMRT were enrolled in our retrospective study. Of which, 434 patients with treatment-naïve ESCC in Fujian Cancer Hospital were defined as the training cohort. Additional 147 newly diagnosed ESCC patients were used as the validation cohort. Independent predictors of overall survival (OS) were employed to establish a nomogram model. The predictive ability was evaluated by time-dependent receiver operating characteristic curves, the concordance index (C-index), net reclassification index (NRI), and integrated discrimination improvement (IDI). Decision curve analysis (DCA) was performed to assess the clinical benefits of the nomogram model. The entire series was divided into 3 risk subgroups stratified by the total nomogram scores.
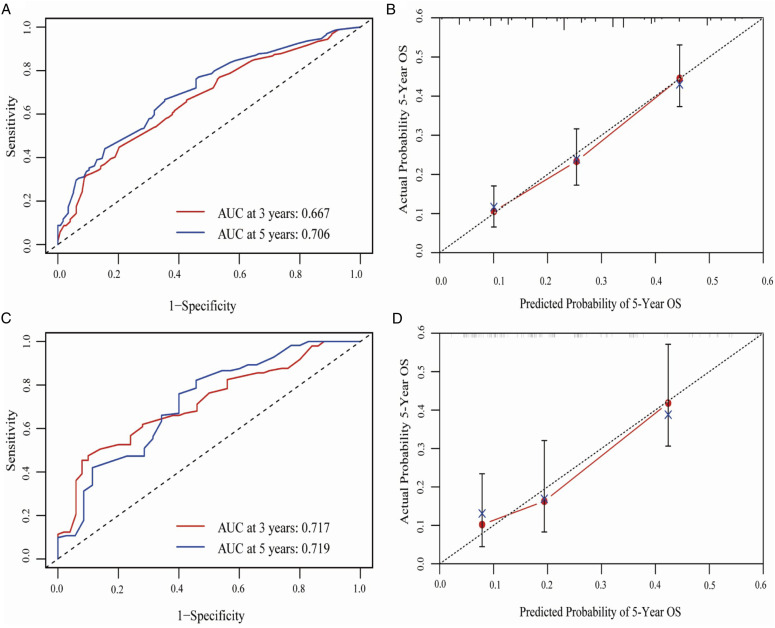
Results: Clinical TNM staging, primary gross tumor volume, chemotherapy, neutrophil-to-lymphocyte ratio and platelet lymphocyte ratio were independent predictors of OS. Nomogram was developed incorporating these factors. Compared with the 8th American Joint Committee on Cancer (AJCC) staging, the C-index for 5-year OS (.627 and .629) and the AUC value of 5-year OS (.706 and .719) in the training and validation cohorts (respectively) were superior. Furthermore, the nomogram model presented higher NRI and IDI. DCA also demonstrated that the nomogram model provided greater clinical benefit. Finally, patients with <84.8, 84.8-151.4, and >151.4 points were categorized into low-risk, intermediate-risk, and high-risk groups. Their 5-year OS rates were 44.0%, 23.6%, and 8.9%, respectively. The C-index was .625, which was higher than the 8th AJCC staging.
Conclusions: We have developed a nomogram model that enables risk-stratification of patients with ESCC receiving definitive IMRT. Our findings may serve as a reference for personalized treatment.
Keywords: esophageal squamous cell carcinoma; intensity-modulated radiotherapy; nomogram; prognosis; risk-stratification.
Conflict of interest statement
he author(s) declared no potential conflicts of interest with respect to the research, authorship, and/or publication of this article.
Figures


References
-
- Sung H, Ferlay J, Siegel RL, et al.Global cancer statistics 2020: GLOBOCAN estimates of incidence and mortality worldwide for 36 cancers in 185 Countries. CA Cancer J Clin. 2021;71(3):209-249. - PubMed
-
- Ajani JA, D'Amico TA, Bentrem DJ, et al.Esophageal and Esophagogastric junction cancers, Version 2.2019, NCCN clinical practice guidelines in oncology. J Natl Compr Canc Netw. 2019;17(7):855-883. - PubMed
MeSH terms
LinkOut - more resources
Full Text Sources
Medical
