. 2023 Jun 20;14(1):3667.
doi: 10.1038/s41467-023-39428-y.

Epistatic interactions between the high pathogenicity island and other iron uptake systems shape Escherichia coli extra-intestinal virulence

Affiliations

Epistatic interactions between the high pathogenicity island and other iron uptake systems shape Escherichia coli extra-intestinal virulence

Guilhem Royer et al. Nat Commun. .

Abstract

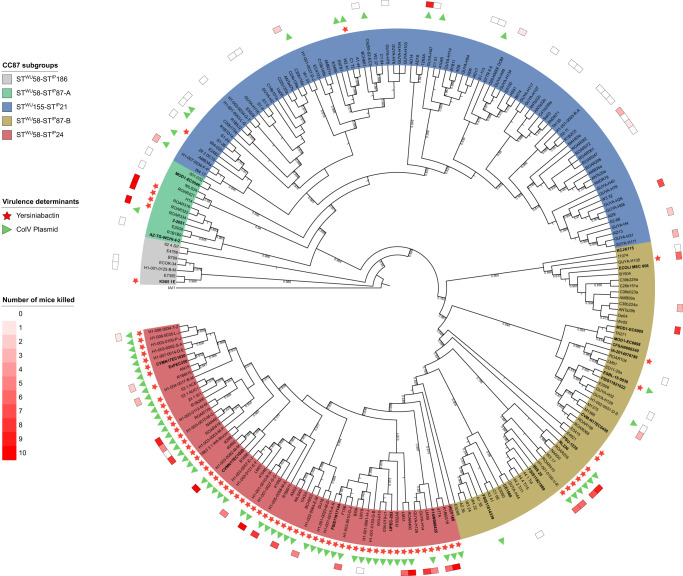
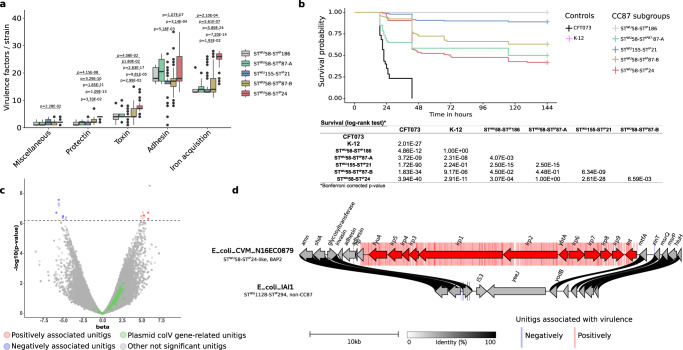
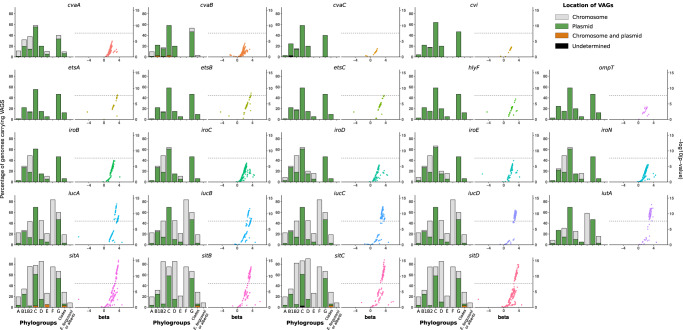
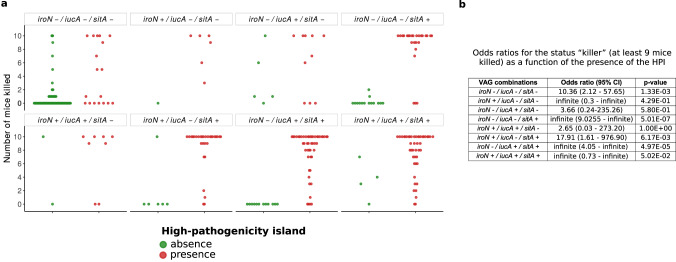
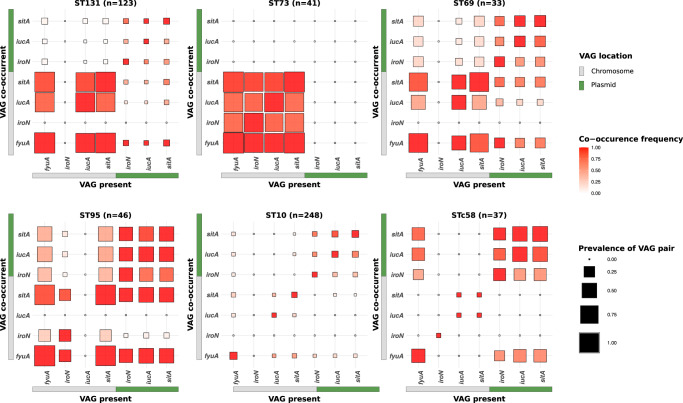
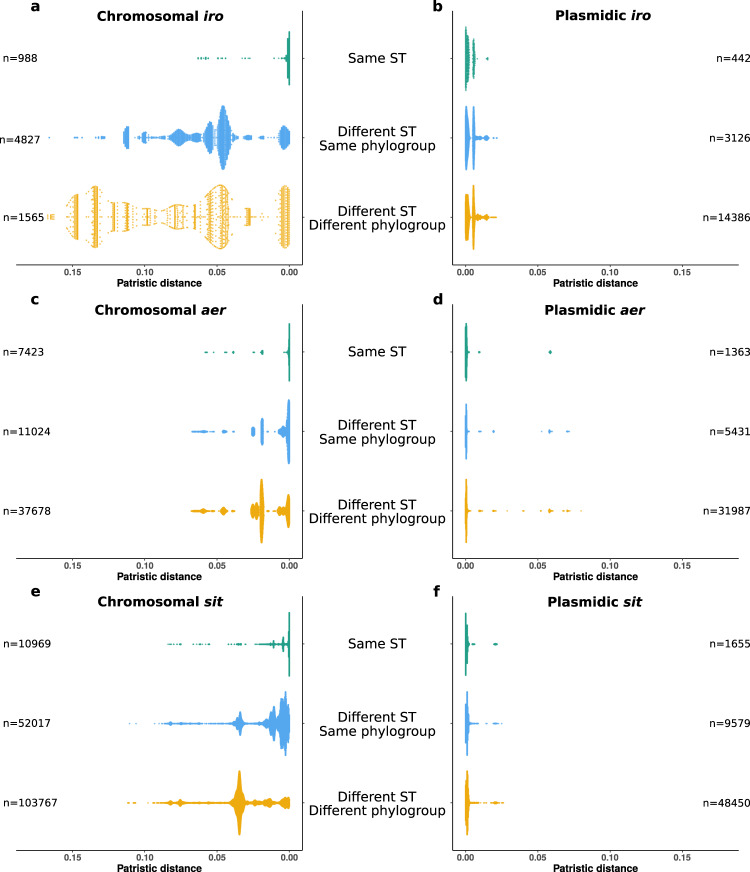
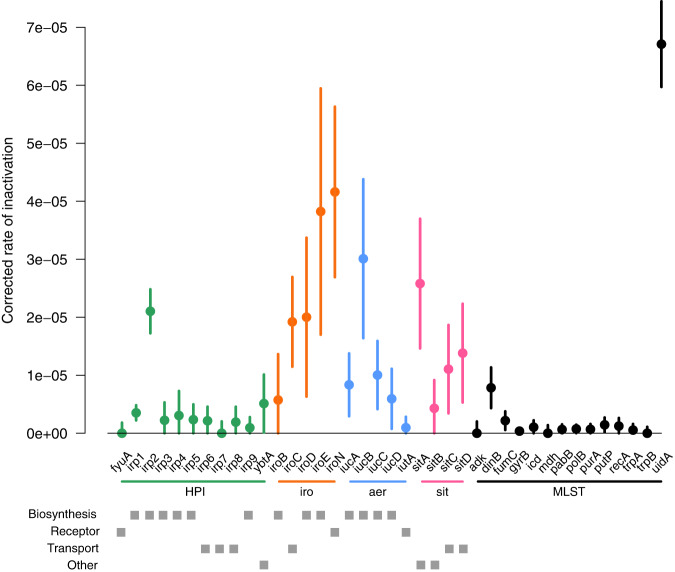
The intrinsic virulence of extra-intestinal pathogenic Escherichia coli is associated with numerous chromosomal and/or plasmid-borne genes, encoding diverse functions such as adhesins, toxins, and iron capture systems. However, the respective contribution to virulence of those genes seems to depend on the genetic background and is poorly understood. Here, we analyze genomes of 232 strains of sequence type complex STc58 and show that virulence (quantified in a mouse model of sepsis) emerged in a sub-group of STc58 due to the presence of the siderophore-encoding high-pathogenicity island (HPI). When extending our genome-wide association study to 370 Escherichia strains, we show that full virulence is associated with the presence of the aer or sit operons, in addition to the HPI. The prevalence of these operons, their co-occurrence and their genomic location depend on strain phylogeny. Thus, selection of lineage-dependent specific associations of virulence-associated genes argues for strong epistatic interactions shaping the emergence of virulence in E. coli.


Conflict of interest statement

The authors declare no competing interests.

Figures

Fig. 1
Fig. 1. Maximum likelihood core genome phylogenetic tree of the 232 B1 phylogroup CC87 (Institut Pasteur scheme numbering) strains.
The five CC87 subgroups (STWU58-STIP186, STWU58-STIP87-A, STWU155-STIP21, STWU58-STIP87-B, STWU58-STIP24) based on the Warwick University and Institut Pasteur MLST schemes are highlighted in color. The presence of the high pathogenicity island (HPI) is highlighted by red stars and ColV plasmid (defined as proposed by Reid et al.) by green triangles. In the outermost circle, colored squares represent the number of mice killed over ten in the mouse model of sepsis. The 26 ST58 genomes obtained from the study by Reid et al. are in bold. The tree is rooted on IAI1 (non-CC87, phylogroup B1). For the sake of readability, branch lengths are ignored and local support values higher than 0.7 are shown.
Fig. 2
Fig. 2. From genotypic and phenotypic characterization of CC87 extra-intestinal virulence to identification of genetic determinants by GWAS in the 232 B1 phylogroup CC87 strains.
a Number of virulence-associated genes per strain among the six main functional classes of virulence according to CC87 subgroups (n = 232 biologically independent CC87 genomes) (Kruskal-Wallis test with Bonferroni adjusted p-values). Only significant p-values are shown. The upper and lower limits of box-plots represent 75th and 25th quartile, the centre line represents the median and the whiskers extend to 1.5 × IQR. Dots represent values outside these ranges. b Kaplan-Meier survival curves of the mouse sepsis assay. Note that the pink (K-12) and gray (STWU58-STIP186) curves overlap. The table below the curves shows the log rank results to compare survival according to CC87 subgroups. c Results of the unitigs association with virulence (likelihood ratio test). The p-value of the association is shown on the y-axis, the effect size (beta) on the x-axis and the significance level with a dotted line (Bonferroni multiple-testing corrected p-value). The unitigs positively and negatively associated with the phenotype are highlighted in red and blue, respectively. The unitigs found in genes belonging to the ColV plasmid (as described by Reid et al.) are highlighted in green. Other non-significant unitigs are in gray. d Physical map of the genome region where significant associations with the virulence in mice were observed. Unitigs positively or negatively associated are represented in the background of the map by red and blue bars, respectively. Genes positively associated with virulence are represented by red arrows and include the whole HPI. The fully sequenced and circularized genomes of E. coli CVM_N16EC0879 (STWU58-STIP24-like, BAP2 in the study by Reid et al.) and IAI1 (STWU1128-STIP294, non-CC87) were used as reference. The links between the maps are colored according to amino acid identity.
Fig. 3
Fig. 3. Prevalence and location of VAGs and association between virulence and unitigs within these VAGs among 370 genomes of the Escherichia genus.
For each VAG two plots are represented. The bar plot represents the prevalence according to the phylogroup/genus and the predicted location. Plasmidic location is highlighted in green, chromosomal location in gray and cases with both chromosomal and plasmidic location in orange. Location of VAGs could not be determined in two genomes (cvaC in phylogroup B1 and sitC in phylogroup C) and is shown in black. The whole dataset is composed of genomes of strains from phylogroup A (n = 72), B1 (n = 41), B2 (n = 111), C (n = 36), D (n = 20), E (n = 19), F (n = 12), G (n = 15), clades (n = 32) and E. fergusonii and E. albertii (n = 12). The scatter plot represents the association between unitigs within the VAGs and the virulence in mice (likelihood ratio test). The p-value is shown on the y-axis, the effect size (beta) on the x-axis and the significance level of the GWAS analysis with a dotted line (Bonferroni multiple-testing corrected p-value).
Fig. 4
Fig. 4. Virulence according to VAG combinations and HPI.
a Number of mice killed over ten according to the combination of iron acquisition-related VAGs iroN, iucA, sitA. These individual genes are representative of their gene cluster. In each facet, each point represents the number of mice killed by a given strain according to the VAG or combination of VAGs it carries. Strains with or without the HPI are represented by red and green points, respectively. b Odds ratios (95% confidence interval) and p-value for the status “killer” (i.e. at least 9/10 mice killed) (Two-sided Fisher exact test) as a function of the presence of the HPI in strains carrying different VAG combinations. A related figure detailing the phylogroup of each strain is available in Fig. S8.
Fig. 5
Fig. 5. Co-occurrence frequency and prevalence of iron acquisition-related VAG pairs among 528 fully circularized E. coli genomes belonging to ST131, 73, 69, 95, 10 and STc58.
For each given VAG on the x-axis, the frequency of co-occurrence with the VAGs on the y-axis is highlighted by a colour gradient. The size of each square is proportional to the prevalence of the VAG pair in the given ST/STc. VAGs are separated according to their location on the chromosome in gray or on the plasmid in green. The co-occurrence frequencies of the VAGs and the prevalence at the phylogroup scale are available in Fig. S10. Odds ratios to test for associations between chromosomal and/or plasmidic VAGs in a given ST/STc are available in Supplementary Data 4.
Fig. 6
Fig. 6. Distributions of patristic distances between iro, aer and sit operons according to their location and to the sequence types and phylogroups of the strains.
The scatter plots represent the patristic distances between pairs of (a) chromosomal iro operons, (b) plasmidic iro operons, (c) chromosomal aer operons, (d) plasmidic aer operons, (e) chromosomal sit operons and (f) plasmidic sit operons. The number of pairs of genomes involved in each category is specified opposite each scatter plot. For the sake of readability, the highly divergent sequences of chromosomal aer from genomes GCF_010725305.1 and GCF_002946715.1 and chromosomal sit from genome GCF_024225755.1 were not included.
Fig. 7
Fig. 7. Corrected inactivation rate of HPI (green), iro (orange), aer (blue) and sit (pink) operon genes and of MLST control genes (black) (n = 2302 biologically independent E. coli genome).
For each gene we show the corrected inactivation rate (circles at the centre of error bars) and the 95% binomial confidence interval (error bars) computed by approximating the distribution of error with a normal distribution, and using the rule of three for rates equal to 0. The inactivation rate is the number of strains with at least one inactivation over the number of strains carrying the gene and gene length. The gray squares indicate the gene function category (biosynthesis, receptor, transport and other). Note the high inactivation of the uidA gene previously reported,.

Similar articles

Cited by

References

    1. Begier E, et al. Epidemiology of invasive Escherichia coli infection and antibiotic resistance status among patients treated in US hospitals: 2009-2016. Clin. Infect. Dis. Publ. Infect. Dis. Soc. Am. 2021;73:565–574. doi: 10.1093/cid/ciab005. - DOI - PubMed
    1. Bélanger L, et al. Escherichia coli from animal reservoirs as a potential source of human extraintestinal pathogenic E. coli. FEMS Immunol. Med. Microbiol. 2011;62:1–10. doi: 10.1111/j.1574-695X.2011.00797.x. - DOI - PubMed
    1. Antimicrobial Resistance Collaborators. Global burden of bacterial antimicrobial resistance in 2019: a systematic analysis. Lancet Lond. Engl. 2022;399:629–655. doi: 10.1016/S0140-6736(21)02724-0. - DOI - PMC - PubMed
    1. Desjardins P, Picard B, Kaltenböck B, Elion J, Denamur E. Sex in Escherichia coli does not disrupt the clonal structure of the population: evidence from random amplified polymorphic DNA and restriction-fragment-length polymorphism. J. Mol. Evol. 1995;41:440–448. doi: 10.1007/BF00160315. - DOI - PubMed
    1. Clermont O, Christenson JK, Denamur E, Gordon DM. The Clermont Escherichia coli phylo-typing method revisited: improvement of specificity and detection of new phylo-groups. Environ. Microbiol. Rep. 2013;5:58–65. doi: 10.1111/1758-2229.12019. - DOI - PubMed

Publication types