. 2023 Jun 20;14(1):3668.
doi: 10.1038/s41467-023-39448-8.

UBAP2 plays a role in bone homeostasis through the regulation of osteoblastogenesis and osteoclastogenesis

Affiliations

UBAP2 plays a role in bone homeostasis through the regulation of osteoblastogenesis and osteoclastogenesis

Jeonghyun Kim et al. Nat Commun. .

Abstract

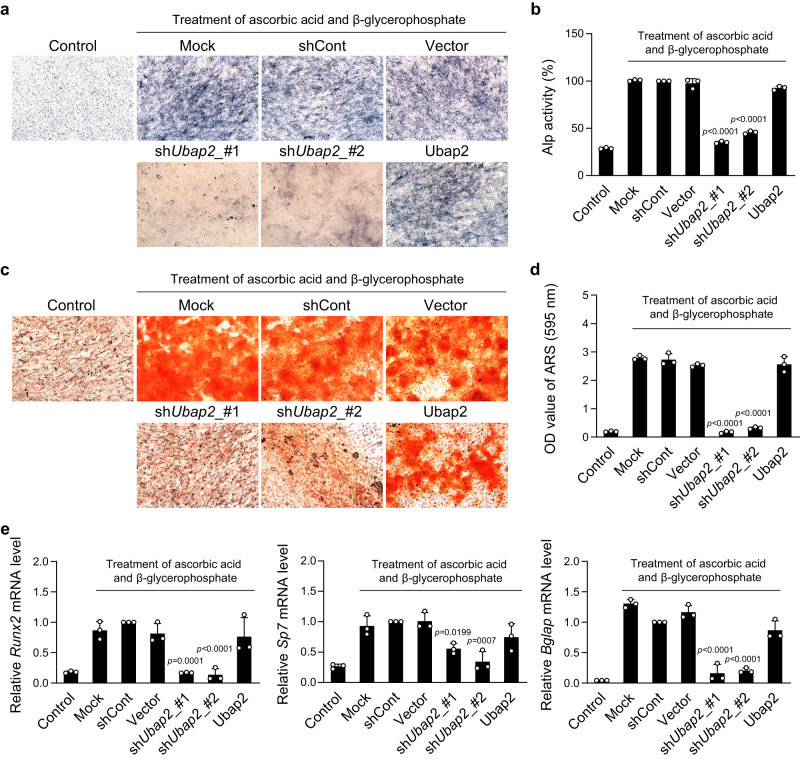
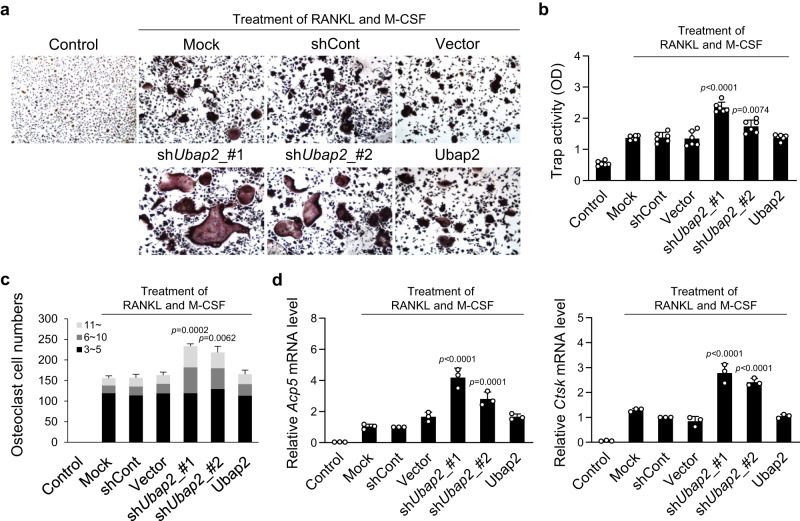
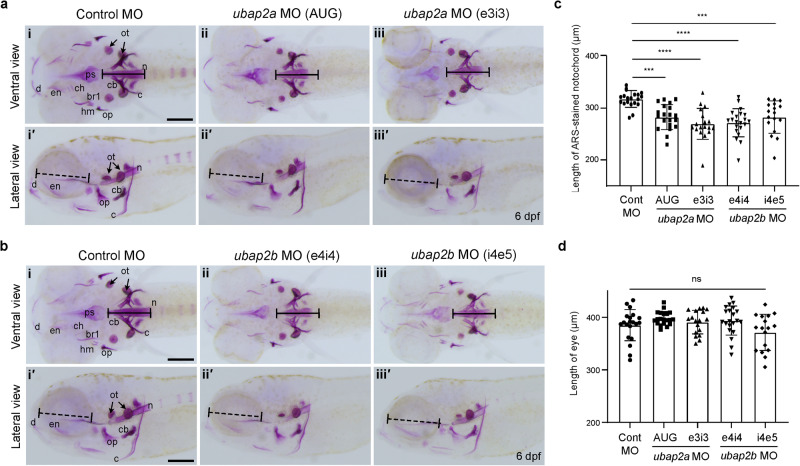
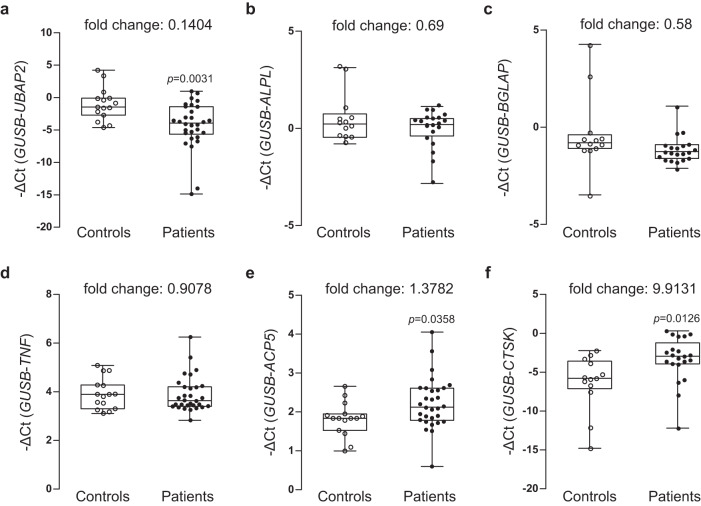
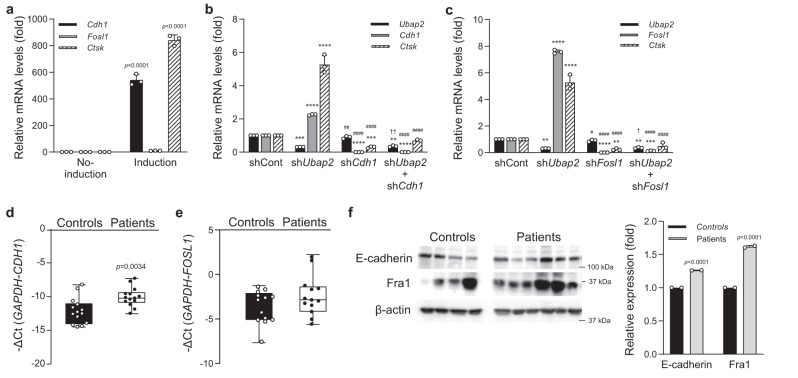
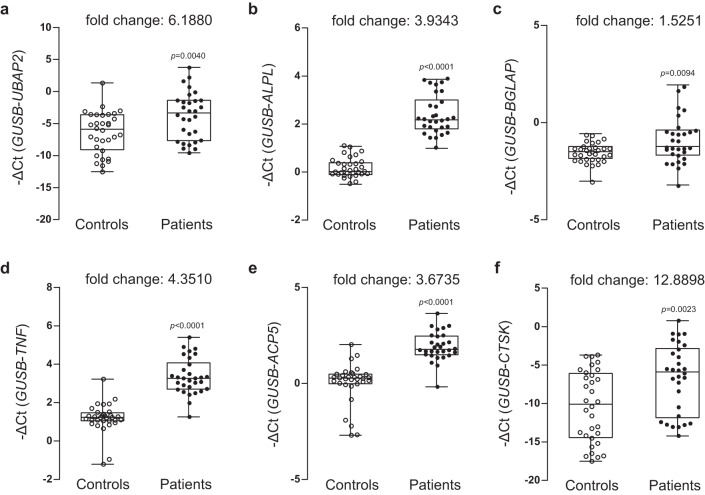
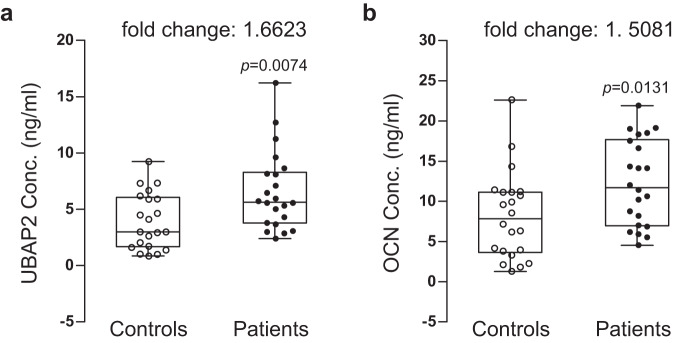
Osteoporosis is a condition characterized by decreased bone mineral density (BMD) and reduced bone strength, leading to an increased risk of fractures. Here, to identify novel risk variants for susceptibility to osteoporosis-related traits, an exome-wide association study is performed with 6,485 exonic single nucleotide polymorphisms (SNPs) in 2,666 women of two Korean study cohorts. The rs2781 SNP in UBAP2 gene is suggestively associated with osteoporosis and BMD with p-values of 6.1 × 10⁻⁷ (odds ratio = 1.72) and 1.1 × 10⁻⁷ in the case-control and quantitative analyzes, respectively. Knockdown of Ubap2 in mouse cells decreases osteoblastogenesis and increases osteoclastogenesis, and knockdown of ubap2 in zebrafish reveals abnormal bone formation. Ubap2 expression is associated with E-cadherin (Cdh1) and Fra1 (Fosl1) expression in the osteclastogenesis-induced monocytes. UBAP2 mRNA levels are significantly reduced in bone marrow, but increased in peripheral blood, from women with osteoporosis compared to controls. UBAP2 protein level is correlated with the blood plasma level of the representative osteoporosis biomarker osteocalcin. These results suggest that UBAP2 has a critical role in bone homeostasis through the regulation of bone remodeling.


Conflict of interest statement

The authors declare no competing interests.

Figures

Fig. 1
Fig. 1. Effects of changes in Ubap2 expression on osteoblast differentiation in pre-osteoblast MC3T3-E1 cells.
a, b Results of alkaline phosphatase (ALP) staining and ALP activity assay in Ubap2-knockdown and -overexpressing cells after 5 days with induction of osteoblast differentiation (n = 3 independent experiments; duplicate samples). c, d Results of mineralized nodule formation in Ubap2-knockdown and -overexpressing cells via Alizarin red S (ARS) staining and quantification of ARS-positive cells. Cells were incubated with the osteoblastic medium containing ascorbic acid and β-glycerophosphate for 14 days (n = 3 independent experiments; duplicate samples). e mRNA expression levels of osteoblast differentiation-related genes in Ubap2-knockdown and Ubap2-overexpressing cells. Quantitative reverse-transcription PCR was performed with the specific primers for Runx2, Sp7, and Bglap. Relative quantification of mRNA expression was presented as fold change relative to shCont (Day 5) and normalized to mouse Gusb expression (n = 3 independent experiments; duplicate samples). Control, no induction; Mock, no treatment; shCont, pLKO.1-puro empty vector; and Vector, pDON-5 Neo vector. Statistical differences of multiple groups were determined using one-way analysis of variance (ANOVA), followed by Tukey’s honestly significant difference post hoc test. Exact p-values representing comparison to short hairpin RNA control (shCont) are shown. All data are presented as mean ± SD with individual average values. Source data are provided as a Source Data file.
Fig. 2
Fig. 2. Effects of changes in Ubap2 expression on osteoclast differentiation in primary-cultured monocytes.
a, b Results of tartrate-resistant acid-phosphatase (TRAP) staining and TRAP activity assay in Ubap2-knockdown and -overexpressing monocytes. Monocytes from mouse bone marrow were incubated for 4 days after induction of osteoclast differentiation (n = 3 independent experiments; duplicate samples). c The distribution of multinuclear cells. Cells were categorized according to the number of nuclei; 3 ~ 5, 6 ~ 10, and more than 11. Multinuclear cells were counted and plotted. d mRNA expression levels of osteoclast differentiation-related genes in Ubap2-knockdown and -overexpressing cells. Quantitative reverse-transcription PCR was performed with the specific primers for Acp5 and Ctsk. Relative quantification of mRNA expression was presented as fold change relative to shCont (Day 4) and normalized to mouse Gusb expression (n = 3 independent experiments; duplicate samples). Control, no induction; Mock, no treatment; shCont, pLKO.1-puro empty vector; and Vector, pDON-5 Neo vector. Statistical differences of multiple groups were determined using one-way ANOVA, followed by Tukey’s honestly significant difference post hoc test. Exact p-values representing comparison to short hairpin RNA control (shCont) are shown. All data are presented as mean ± SD. Source data are provided as a Source Data file.
Fig. 3
Fig. 3. Phenotypes of pharyngeal skeleton and notochord in the ubap2a- and ubap2b-knockdown zebrafish models during development.
a Alizarin red S (ARS) staining results of the knockdown larvae with control morpholino (Control MO, n = 20) (i, iʹ), ubap2a MO (AUG, n = 20) (ii, iiʹ), ubap2a MO (e3i3, n = 18) (iii, iiiʹ). b ARS staining results of knockdown larvae with control morpholino (Control MO, n = 20) (i, iʹ), ubap2b MO (e4i4, n = 21) (ii, iiʹ), and ubap2b MO (i4e5, n = 17) (iii, iiiʹ). Upper panels show the ventral view and lower panels show the lateral view in (a) and (b). The larvae injected with either control MO, ubap2a, or ubap2b were stained with ARS at 6 dpf and the length of the ARS-stained notochord (black lines, the lengths of the lines in each panel are identical) was measured in a and b. Eye sizes (dashed black lines) of the larvae were also measured. Concentrations of Mos; 800 μM for control MO, 500 μM for ubap2a AUG MO, 300 μM for ubap2a e3i3 MO, 800 μM for ubap2b e4i4 MO, and 800 μM for ubap2b i4e5 MO. c, d Quantification results of the ARS-stained notochord length (c) and eye diameter (d). Statistical significances were determined by ordinary one-way ANOVA with Tukey’s test. ***p < 0.001 (Cont MO vs. ubap2a MO AUG, p = 0.0005; Cont MO vs. ubap2b MO i4e5, p = 0.0009 for (c)); ****p < 0.0001; ns; not significant. n = 17–21 biologically independent embryos per condition in (c) and (d). br1, branchiostegal ray 1; c, cleithrum; cb, ceratobranchial 5; ch, ceratohyal; d, dentary; dpf, days post fertilization; hm, hyomandibular; en, entopterygoid; m, maxilla; MO, morpholino, n, notochord; op, opercle; ot, otolith; and ps, parasphenoid. Scale bars = 200 μm. Source data are provided as a Source Data file.
Fig. 4
Fig. 4. Analysis of mRNA expression levels of UBAP2 and osteoblast and osteoclast differentiation-related genes in the bone marrow samples from postmenopausal woman controls and postmenopausal woman patients with osteoporosis.
Relative mRNA expression and fold changes in the expression of a UBAP2, osteoblast differentiation markers b ALPL, c BGLAP, d TNF, e ACP5, and f CTSK in bone marrow-derived buffy coats from controls and patients with osteoporosis are shown. Total RNAs were isolated from buffy coat of bone marrow samples from the normal postmenopausal woman controls (n = 15) and postmenopausal women with osteoporosis (n = 30) and then used as templates to synthesize cDNAs. Relative mRNA expression of the six genes relative to the internal control GUSB was determined via quantitative reverse-transcription PCR. The negative values of the delta cycle threshold (–ΔCt) for UBAP2 are plotted via open and closed circles. The minimum to maximum values and median values are shown in box-and-whisker plots. All experiments were repeated three times with duplicated samples. Exact p-values between the groups were calculated with an unpaired two-tailed Student’s t-test. Source data are provided as a Source Data file.
Fig. 5
Fig. 5. Analysis of Cdh1 (E-cadherin) and Fosl (Fra1) expression levels in the Ubap2 knockdown cells during osteoclast differentiation and human samples of normal controls and patients with osteoporosis.
a mRNA expression levels of Cdh1, Fosl1, and Ctsk during osteoclast differentiation of primary cultured monocytes. Quantitative reverse-transcription PCR (qRT-PCR) was performed with the specific primers for Cdh1, Fosl1, and Ctsk. Relative mRNA expression was presented as fold change relative to No-induction and normalized to mouse Gapdh expression (n = 3 independent experiments; duplicate samples). Exact p-values of an unpaired two-tailed t-test are shown. b, c mRNA expression levels of target genes in the Ubap2, Cdh1 (shCdh1_#3), and Fosl1 (shFosl1_#3)-knockdown osteoclastogenesis-induced primary-cultured monocytes. qRT-PCR was performed as shown a (n = 3 independent experiments; duplicate samples). Statistical differences of multiple groups were determined using two-way ANOVA multiple comparisons. All data are presented as the mean ± SD. **p = 0.0012 vs. shCont; ***p = 0.0005 and p = 0.0004 vs. shCont; ****p < 0.0001 vs. shCont; ##, p = 0.0035 vs. shUbap2; ####, p < 0.0001 vs. shUbap2; and ††, p = 0.0079 vs. shCdh1 for (b); **, p = 0.0040, p = 0.0012, and p = 0.0081 vs. shCont; ***p = 0.0002 vs. shCont; ****p < 0.0001 vs. shCont; #, p = 0.0199 vs. shUbap2; ####, p < 0.0001 vs. shUbap2; and †, p = 0.0386 vs. shFosl1 for (c). d, e mRNA expression levels of CDH1 and FOSL1 in bone marrow-derived buffy coats from the normal postmenopausal woman controls (n = 15) and postmenopausal women with osteoporosis (n = 15). The minimum to maximum values and median values are shown in box and whisker plots. Exact p-values of an unpaired two-tailed t-test are shown. f Protein expression levels of E-cadherin and Fra1 in bone marrow-derived buffy coats from controls and patients with osteoporosis. The protein levels of E-cadherin, Fra1, and β-actin were analyzed by western blotting. The intensity for quantitative analysis was normalized to β-actin using Image Processing and Analysis in Java (Image J) software [http://imagej.nih.gov/ij/]. Source data are provided as a Source Data file.
Fig. 6
Fig. 6. Analysis of mRNA expression levels of UBAP2 and osteoblast and osteoclast differentiation-related genes in the peripheral blood samples from normal controls and postmenopausal women with osteoporosis.
Relative mRNA expression and fold changes in expression of a UBAP2, osteoblast differentiation markers b ALPL and c BGLAP, and osteoblast differentiation markers d TNF, e ACP5, and f CTSK between whole blood-derived buffy coats from normal controls and patients with osteoporosis are shown. Total RNAs were isolated from buffy coat of peripheral blood samples from normal control postmenopausal women (n = 32) and postmenopausal women with osteoporosis (n = 31) and then used as templates to synthesize cDNAs. Relative mRNA expression of the six genes relative to the internal control GUSB was determined by quantitative reveres-transcription PCR. The negative values of delta cycle threshold (–ΔCt) for UBAP2 are plotted by opened and closed circles. The minimum to maximum values and median values are shown in box-and-whisker plots. All experiments were repeated three times with duplicated samples. Exact p-values between the groups were calculated with an unpaired two-tailed Student’s t-test. Source data are provided as a Source Data file.
Fig. 7
Fig. 7. Analysis of UBAP2 and osteocalcin (OCN) protein concentrations in blood plasma samples from normal controls and postmenopausal women with osteoporosis.
Protein concentration and fold changes in a UBAP2 and osteoblast differentiation marker b OCN between blood plasmas from normal controls and patients with osteoporosis are shown. Blood plasmas were separated from whole peripheral blood samples from the normal control postmenopausal women (n = 21) and postmenopausal women with osteoporosis (n = 22). Protein concentrations (ng/ml) in plasmas were determined by analysis of enzyme-linked immunosorbent assay data. The concentrations were plotted by opened and closed circles. The minimum to maximum concentration and median values are shown in box-and-whisker plots. Fold changes in mean values between groups are indicated. All experiments were repeated three times with duplicated samples. Exact p-values between the groups were calculated with an unpaired two-tailed Student’s t-test. Source data are provided as a Source Data file.

Similar articles

Cited by

References

    1. Zajickova K, Zofkova I. Osteoporosis: genetic analysis of multifactorial disease. Endocr. Regul. 2003;37:31–44. - PubMed
    1. Ralston SH. Genetics of osteoporosis. Proc. Nutr. Soc. 2007;66:158–165. doi: 10.1017/S002966510700540X. - DOI - PubMed
    1. Levine JP. Identification, diagnosis, and prevention of osteoporosis. Am. J. Manag. Care. 2011;17:S170–S176. - PubMed
    1. Leslie WD, Schousboe JT. A review of osteoporosis diagnosis and treatment options in new and recently updated guidelines on case finding around the world. Curr. Osteoporos. Rep. 2011;9:129–140. doi: 10.1007/s11914-011-0060-5. - DOI - PubMed
    1. Kwok AW, et al. Prevalence of vertebral fracture in Asian men and women: comparison between Hong Kong, Thailand, Indonesia and Japan. Public Health. 2012;126:523–531. doi: 10.1016/j.puhe.2012.03.002. - DOI - PubMed

Publication types

Substances