. 2023 Jun 20;14(1):3669.
doi: 10.1038/s41467-023-39403-7.

Gut microbiota Turicibacter strains differentially modify bile acids and host lipids

Affiliations

Gut microbiota Turicibacter strains differentially modify bile acids and host lipids

Jonathan B Lynch et al. Nat Commun. .

Abstract

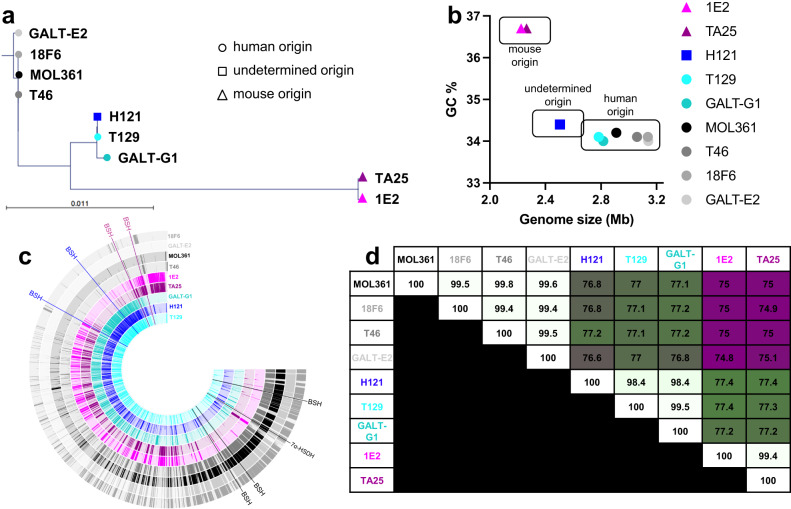
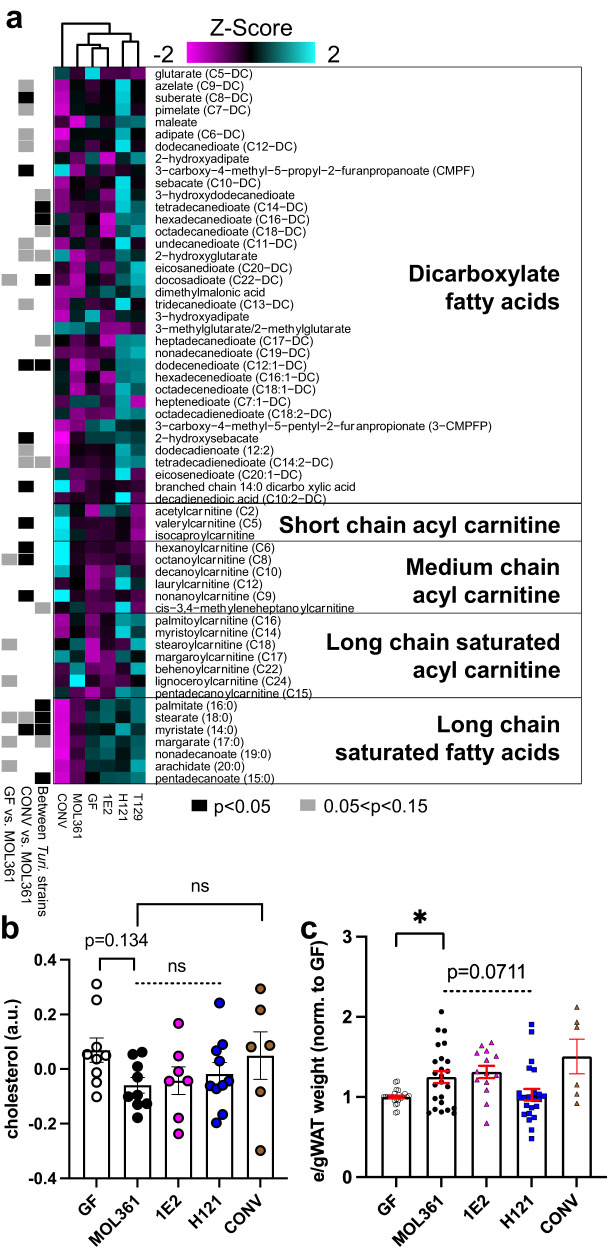
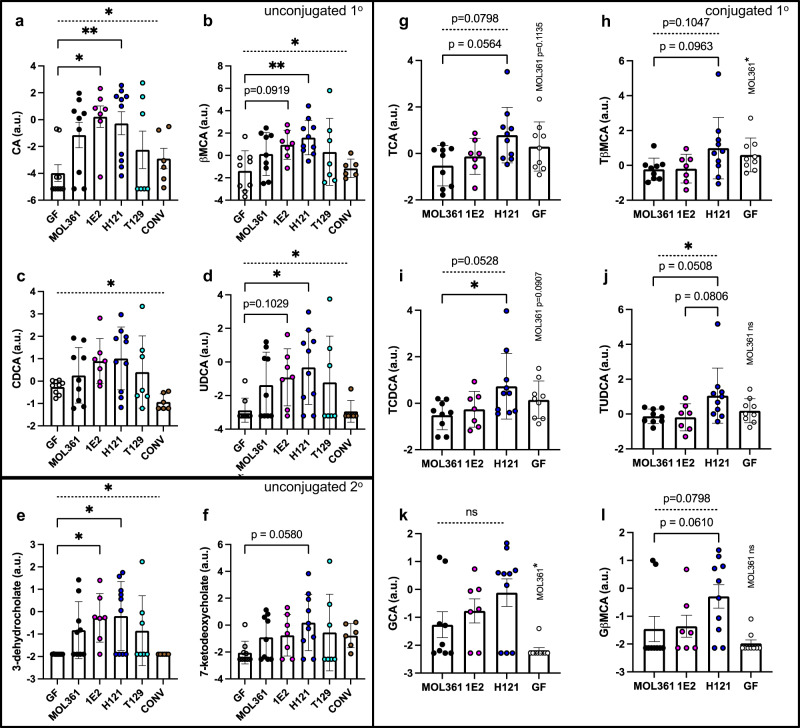
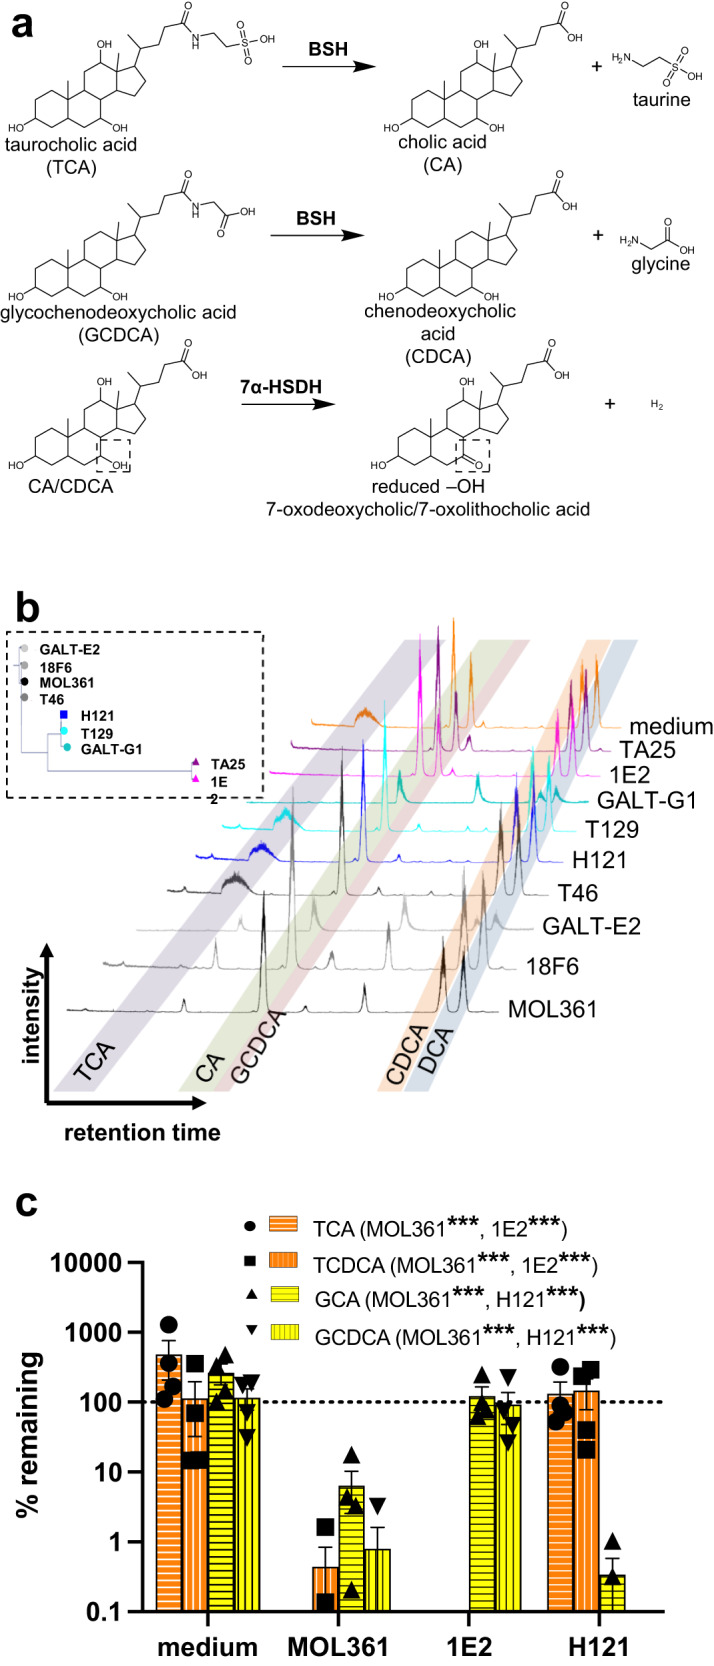
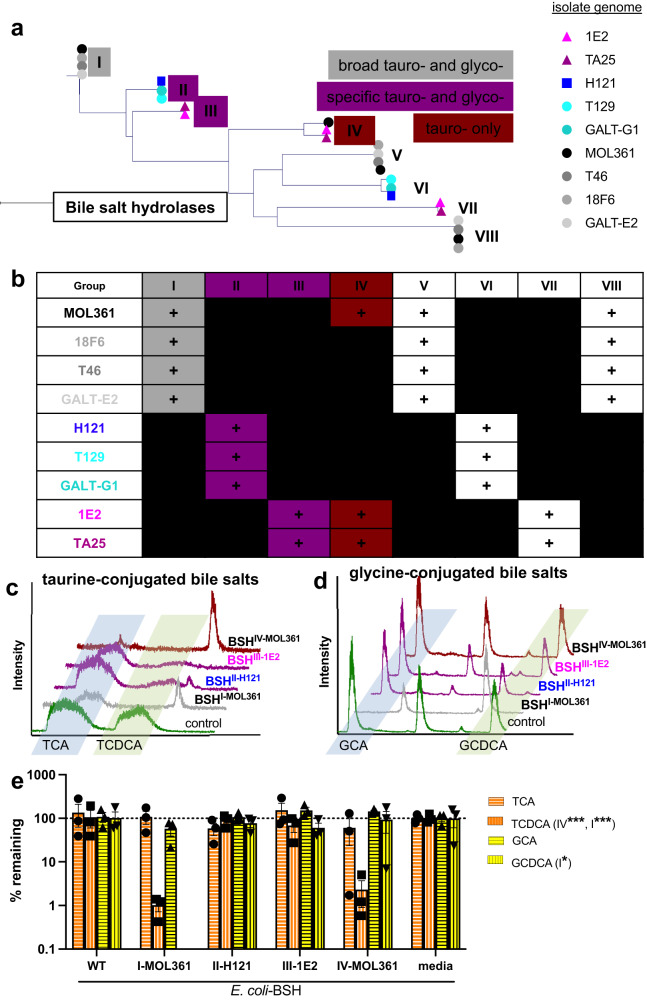
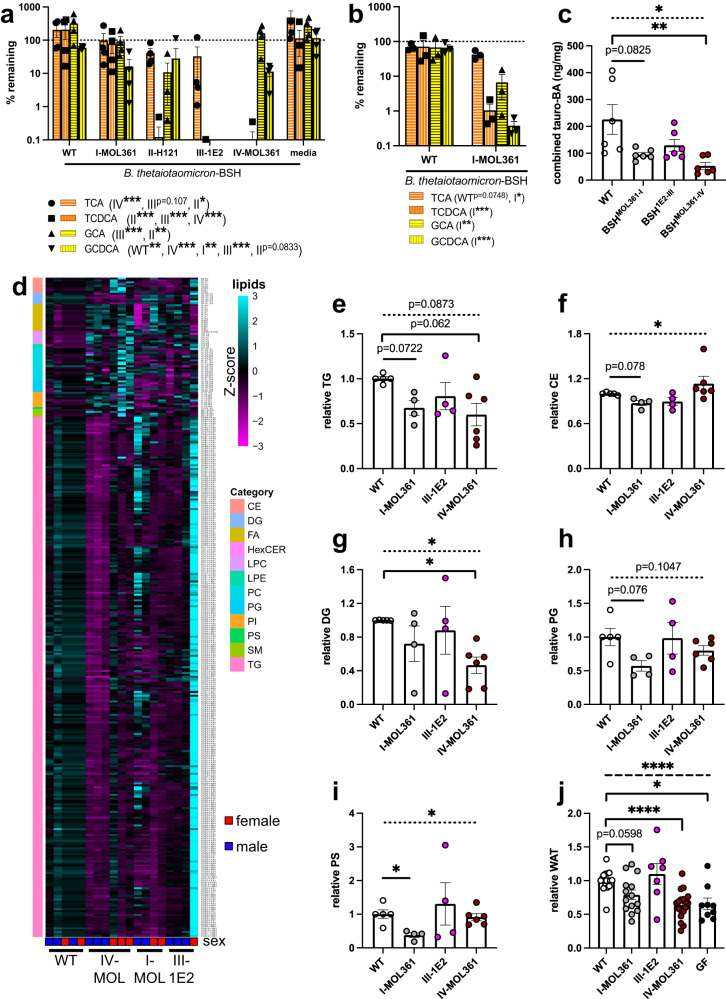
Bacteria from the Turicibacter genus are prominent members of the mammalian gut microbiota and correlate with alterations in dietary fat and body weight, but the specific connections between these symbionts and host physiology are poorly understood. To address this knowledge gap, we characterize a diverse set of mouse- and human-derived Turicibacter isolates, and find they group into clades that differ in their transformations of specific bile acids. We identify Turicibacter bile salt hydrolases that confer strain-specific differences in bile deconjugation. Using male and female gnotobiotic mice, we find colonization with individual Turicibacter strains leads to changes in host bile acid profiles, generally aligning with those produced in vitro. Further, colonizing mice with another bacterium exogenously expressing bile-modifying genes from Turicibacter strains decreases serum cholesterol, triglycerides, and adipose tissue mass. This identifies genes that enable Turicibacter strains to modify host bile acids and lipid metabolism, and positions Turicibacter bacteria as modulators of host fat biology.


Conflict of interest statement

Findings regarding the host effects of Turicibacter reported in the manuscript are the subject of provisional patent application 63/288980, owned by UCLA, on which J.B.L., E.L.G., K.C., and E.Y.H. are inventors. J.B.L. and E.Y.H. are scientific advisors for PurposeBio, which is licensing this patent but which had no role in study design, data collection, data analysis, or interpretation of this work. No other authors have competing interests.

Figures

Fig. 1
Fig. 1. Genomic comparisons reveal distinct subgroups of Turicibacter.
a Phylogenetic tree comparing full-length 16S rRNA gene sequences from noted Turicibacter isolates. Circles indicate human-derived isolates, triangles indicate mouse-derived isolates, and square indicates a mouse-derived contaminating isolate. b Association between guanine-cytosine % (GC%) and calculated genome size in megabases (Mb) for shotgun-assembled genomes of Turicibacter isolates from a. c Full genome sequence comparisons across Turicibacter strains. Position of predicted bile-modification gene homologs are noted outside of rings, with the color of the gene name denoting the genome family that gene is found in. Each ring represents sequence blocks in one genome. d Average nucleotide identity (ANI) between noted Turicibacter genomes. Number denotes ANI, white-green-maroon scale represents 100%-75% ANI scale.
Fig. 2
Fig. 2. Colonization with different Turicibacter strains alters host lipids.
a Heatmap displaying relative abundance of serum lipids from gnotobiotic mice monocolonized with noted Turicibacter strains. Heatmap values (Z-score) represent mean abundance of each detected lipid species from labeled lipid categories scaled across all the means of that individual lipid species. Black (p < 0.05) and gray (0.05 < p < 0.15) rectangles indicate statistically significant differences of that metabolite between: left, GF and MOL361 monocolonized mice; middle, CONV and MOL361 monocolonized mice; and right, between MOL361, 1E2, and H121 monocolonized mice. b Serum cholesterol abundances of mice colonized by noted Turicibacter strains. c Sex and litter-matched relative epidydimal/gonadal white adipose tissue (e/g WAT) mass of mice monocolonized with noted Turicibacter strains. Shapes indicate value for individual mouse, dotted bar represents ANOVA statistic for groups below the line, a.u. = arbitrary units. WAT analysis n: GF = 26, MOL361 = 24, 1E2 = 14, H121 = 23, T129 = 10, CONV = 6. All other analysis n: GF = 9, MOL361 = 9, 1E2 = 7, H121 = 10, T129 = 7, CONV = 6. In all panels Mann–Whitney test for MOL361-GF and MOL361-CONV comparisons, Kruskal–Wallis for intra-Turicibacter comparison, Šidák correction for multiple comparisons. Errors bars are mean +/− SEM, *p < 0.05, GF-MOL361 in 2c: p = 0.0108. Data are provided as source data file.
Fig. 3
Fig. 3. Turicibacter colonization alters circulating host bile species in a strain-specific manner.
Serum abundances of ad, primary unconjugated bile acids; e, f secondary unconjugated bile acids; or gl primary conjugated bile acids. Points indicate log-transformed value for individual mouse with shapes and colors matching Fig. 1, error bars represent mean +/− SEM, a.u.=arbitrary units. Kruskal–Wallis test across all noted colonizations with Dunn’s multiple comparisons to GF for af. Kruskal–Wallis test between noted Turicibacter strains and multiple comparisons to H121 for gl. Mann–Whitney test used to compare GF and MOL361 in gl, and p-values are noted above GF data points. n for each group: GF = 9, MOL361 = 9, 1E2 = 7, H121 = 10, T129 = 7, CONV = 6. Dotted bar represents ANOVA statistic for groups below the line. Error bars are mean +/− SEM, *p < 0.05, **p < 0.005. Corrected p-values (ANOVA/GF-MOL361/GF-1E2/GF-H121/GF-T129/GF-CONV): 2a = (0.0204/0.1785/0.0141/0.0049/0.999/0.999); 2b = (0.0116/0.5123/0.0919/0.0059/0.9256/0.999); 2c = (0.0208/0.999/0.5425/0.5306/0.999/0.4158); 2d = (0.0216/0.4850/0.1029/0.0201/0.8856/0.999); 2e = (0.0121/0.3585/0.0299/0.0405/0.7612/0.999); 2f = (0.2203/0.6556/0.6645/0.0580/0.999/0.4012). Corrected p-values (ANOVA/H121-MOL361/H121-1E2/GF-MOL361): 2g = (0.0798/0.0564/0.3171/0.1135); 2h = (0.1047/0.0963/0.2315/0.400); 2i = (0.0528/0.0351/0.2726/0.0907); 2j = (0.0407/0.0508/0.0806/0.2973); 2k = (0.3988/0.3757/0.7675/0.0226); 2l = (0.0769/0.0610/0.2393/0.7176).
Fig. 4
Fig. 4. Turicibacter isolates differ in their bile-modifying abilities.
a Schematic for types of bile transformations found to be performed by Turicibacter isolates. b inset: 16S rRNA gene-based phylogenic tree from Fig. 1a. Liquid chromatograms of individual Turicibacter isolates grown for 24 h in media with sub-inhibitory concentrations of five bile acids: taurocholic acid (TCA), cholic acid (CA), glycochenodeoxycholic acid (GCDCA), chenodeoxycholic acid (CDCA), and deoxycholic acid (DCA). Shaded regions indicate expected retention time of each bile species. c Percent remaining (compared to cultures at time = 0) of conjugated bile acids (TCA, taurochenodeoxycholic acid [TCDCA], glycocholic acid [GCA], GCDCA) after 24 growth with noted Turicibacter isolate. Yellow = glycine-conjugated bile acids, orange=taurine-conjugated bile acids. n = 4 independent cultures. Values not shown were below 0.1% remaining. Statistical analysis performed by one sample t-test, annotations of legend denotes strains with significant difference from 100% remaining for each bile acid. p-values for each bile acid (MOL361/1E2/H121): TCA = (< 0.0001/ < 0.0001/0.6327); TCDCA = (< 0.0001/ < 0.0001/0.5410); GCA = (0.0002/0.6348/ < 0.0001); GCDCA = (< 0.0001/0.8803/ < 0.0001). Data are provided as source data file.
Fig. 5
Fig. 5. Turicibacter isolates differ in their genetic capacity to modify bile species.
a Phylogenetic tree of amino acid sequences for each predicted bile salt hydrolase (BSH) sequence from Turicibacter isolates, with observed bile species specificity noted in boxes. We did not detect bile salt hydrolase activity in sequences without boxes, representing groups V-VIII. b Presence (+) or absence of sequence homologs with potential BSH activity in Turicibacter isolates. c Liquid chromatograms of media after 24 h cultures of E. coli expressing individual predicted bsh genes from each sequence grouping and grown with TCA and TCDCA. Control is E. coli with same expression vector but expressing non-bile-modifying gene. d same as c but with GCA and GCDCA instead of tauro-bile acids. e Quantification of percent remaining (compared to media controls) of conjugated bile acid (TCA, TCDCA, GCA, GCDCA) after 24 h growth with E. coli expressing the noted Turicibacter bsh gene. n = 3 independent cultures, annotations in legend indicate *p < 0.05, **p < 0.005, ***p < 0.0005 using one sample t-test comparison with 100% remaining. p-values for each bile acid expressed in E. coli (WT/BSHI-MOL361/BSHII-H121/BSHIII-1E2/BSHIV-MOL361): TCA = (0.6778/0.8401/0.1597/0.5261/0.4015); TCDCA = (0.9252/ < 0.0001/0.6322/0.2703/0.0002); GCA = (0.7814/0.1447/0.6873/0.1938/0.0474); GCDCA = (0.9706/ < 0.0001/0.2851/0.1405/0.9125). BSH nomenclature indicates homolog group (e.g. III) and isolate of origin (e.g. MOL361). Data are provided as source data file.
Fig. 6
Fig. 6. Turicibacter bsh expression is sufficient to alter host lipidome and health-associated lipid markers.
a Percent remaining of noted bile acids after 24 h growth with Bacteroides thetaiotaomicron expressing noted bsh genes. n = 4 cultures per strain. b Same as a, but with 48 h growth with noted B. thetaiotaomicron strains. n = 3 cultures per strain. For a and b, points represent individual comparison with media control, legend annotations denote strains with statistical significance for each bile acid using one sample t-test comparison with 100% remaining. c Quantification of combined taurine-conjugated cecal bile acids (BA) from mice colonized with bsh-expressing B. thetaiotaomicron. Statistical analysis was performed with Kruskal–Wallis test with Dunn’s multiple comparisons test. n = 6 animals per colonization. d Heatmap of circulating lipid species significantly altered by expression of at least one Turicibacter bsh in B. thetaiotaomicron. Heatmap Z-score values represent mean abundance of each detected lipid species from labeled lipid categories scaled across all the means of that individual lipid species. Colors on left correspond to lipid class, each column represents one animal. e–i Relative combined circulating concentrations of (e) triglycerides (TG), f cholesterol esters (CE), g diacylglycerides (DG), h phosphotidylglycines (PG), or i phosphotidylserines (PS) of mice monocolonized with bsh-expressing B. thetatiotaomicron. j Relative white adipose tissue weight of mice monocolonized with bsh-expressing B. thetatiotaomicron. n for each condition in di: WT = 5(3 M, 2 F); BSHI-MOL361 = 4(2 M, 2 F); BSHIII-1E2 = 4(3 M, 1 F); BSHIV-MOL361 = 6(3 M, 3 F). n for j: WT = 17; BSHI-MOL361 = 14; BSHIII-1E2 = 7; BSHIV-MOL361 = 18. In (ej), all values normalized to sex-matched littermates, statistical analysis performed by Welch’s ANOVA with Dunnett’s multiple comparisons to Bt-WT, dotted bar in c, ej represents ANOVA statistic for groups below the line. n for (ei): Bt-WT = 5, Bt-BSH-MOL361-I = 4, Bt-BSH-1E2-III = 4, Bt-BSH-MOL361-IV = 6. n for (j): Bt-WT = 17, Bt-BSH-MOL361-I = 14, Bt-BSH-1E2-III = 7, Bt-BSH-MOL361-IV = 18. Error bars are mean +/− SEM, *p < 0.05, **p < 0.005, ***p < 0.0005. Figure 6ap-value for B. thetaiotaomicron expressing BSH in each bile acid (WT/BSHI-MOL361/BSHII-H121/BSHIII-1E2/BSHIV-MOL361): TCA = (0.3020/0.9811/0.0286/0.1074/ < 0.0001); TCDCA = (0.3686/0.6211/ < 0.0001/ < 0.0001/ < 0.0001); GCA = (0.1703/0.8672/0.0028/ < 0.0001/0.3291); GCDCA = (0.0007/0.0035/0.0833/ < 0.0001/ < 0.0001). Figure 6bp-values (WT/BSHIV-MOL361): TCA = (0.0748/0.0148); TCDCA = (0.5295/ < 0.0001); GCA = (0.4168/0.0023); GCDCA = (0.1323/ < 0.0001). Figure 6c, e–jp-values (ANOVA/BSHI-MOL361/BSHIII-1E2/BSHIV-MOL361): 6c = (0.0051/0.0825/0.5337/0.0016); 6e = (0.0222/0.0722/0.5767/0.0669); 6f = (0.0377/0.0780/0.2933/0.4864); 6g = (0.0142/0.5490/0.9599/0.0072); 6h = (0.1047/0.0760/0.999/0.4879); 6i = (0.0076/0.0147/0.9449/0.9344); 6j = (0.0042/0.0457/0.8987/ < 0.0001). Data are provided as source data file.

Similar articles

Cited by

References

    1. Schoeler M, Caesar R. Dietary lipids, gut microbiota and lipid metabolism. Rev. Endocr. Metab. Disord. 2019;20:461–472. doi: 10.1007/s11154-019-09512-0. - DOI - PMC - PubMed
    1. Wahlström A, Sayin SI, Marschall H-U, Bäckhed F. Intestinal crosstalk between bile acids and microbiota and its impact on host metabolism. Cell Metab. 2016;24:41–50. doi: 10.1016/j.cmet.2016.05.005. - DOI - PubMed
    1. Sharon, G., Sampson, T. R., Geschwind, D. H. & Mazmanian, S. K. The central nervous system and the gut microbiome. Cell10.1016/j.cell.2016.10.027 (2016). - PMC - PubMed
    1. Fung, T. C., Olson, C. A. & Hsiao, E. Y. Interactions between the microbiota, immune and nervous systems in health and disease. Nat. Neurosci.10.1038/nn.4476 (2017). - PMC - PubMed
    1. Rabot S, et al. Germ-free C57BL/6J mice are resistant to high-fat-diet-induced insulin resistance and have altered cholesterol metabolism. FASEB J. 2010;24:4948–4959. - PubMed

Publication types

LinkOut - more resources