. 2023 Jun 20;14(1):3645.
doi: 10.1038/s41467-023-39422-4.

Tnpo3 controls splicing of the pre-mRNA encoding the canonical TCR α chain of iNKT cells

Affiliations

Tnpo3 controls splicing of the pre-mRNA encoding the canonical TCR α chain of iNKT cells

Norimasa Iwanami et al. Nat Commun. .

Abstract

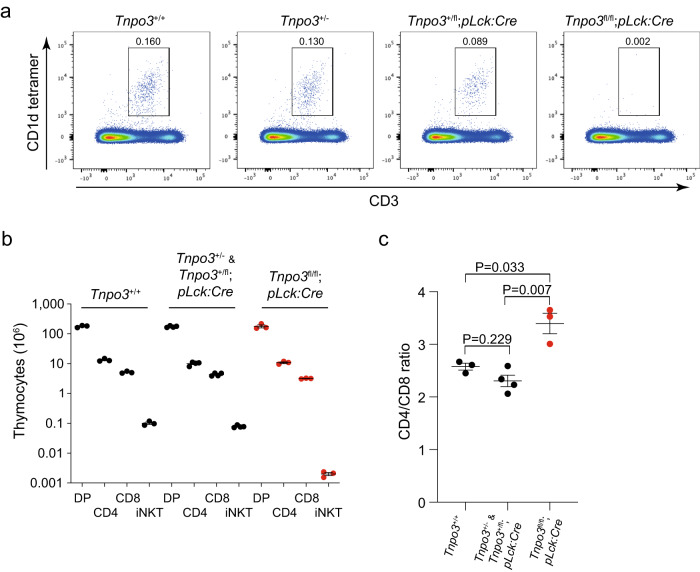
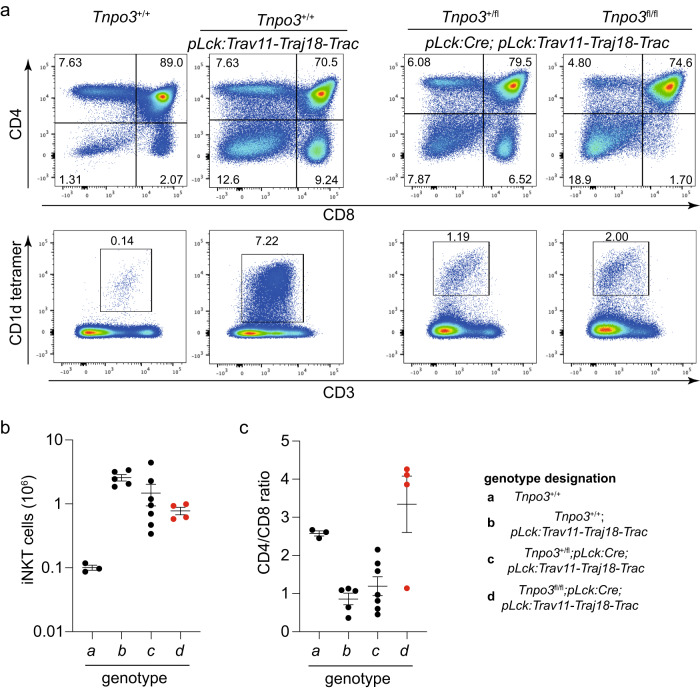
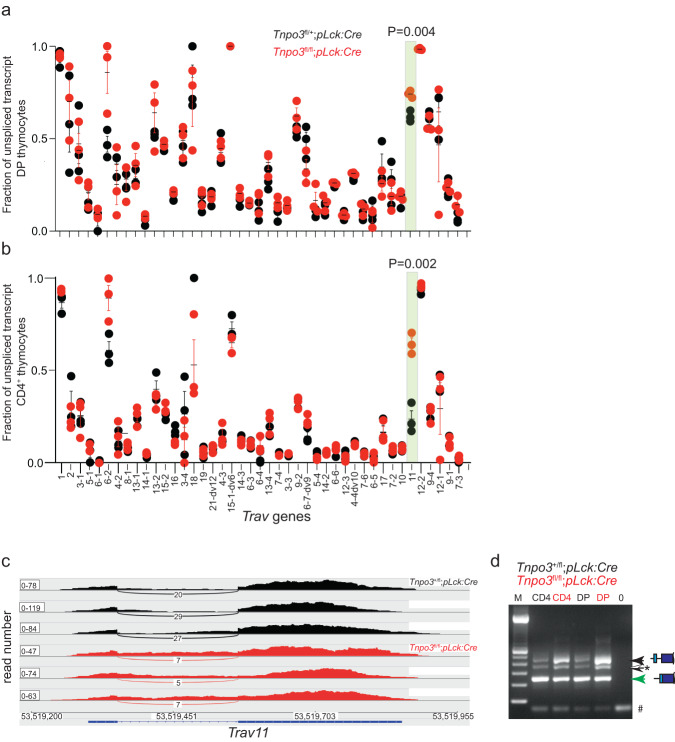
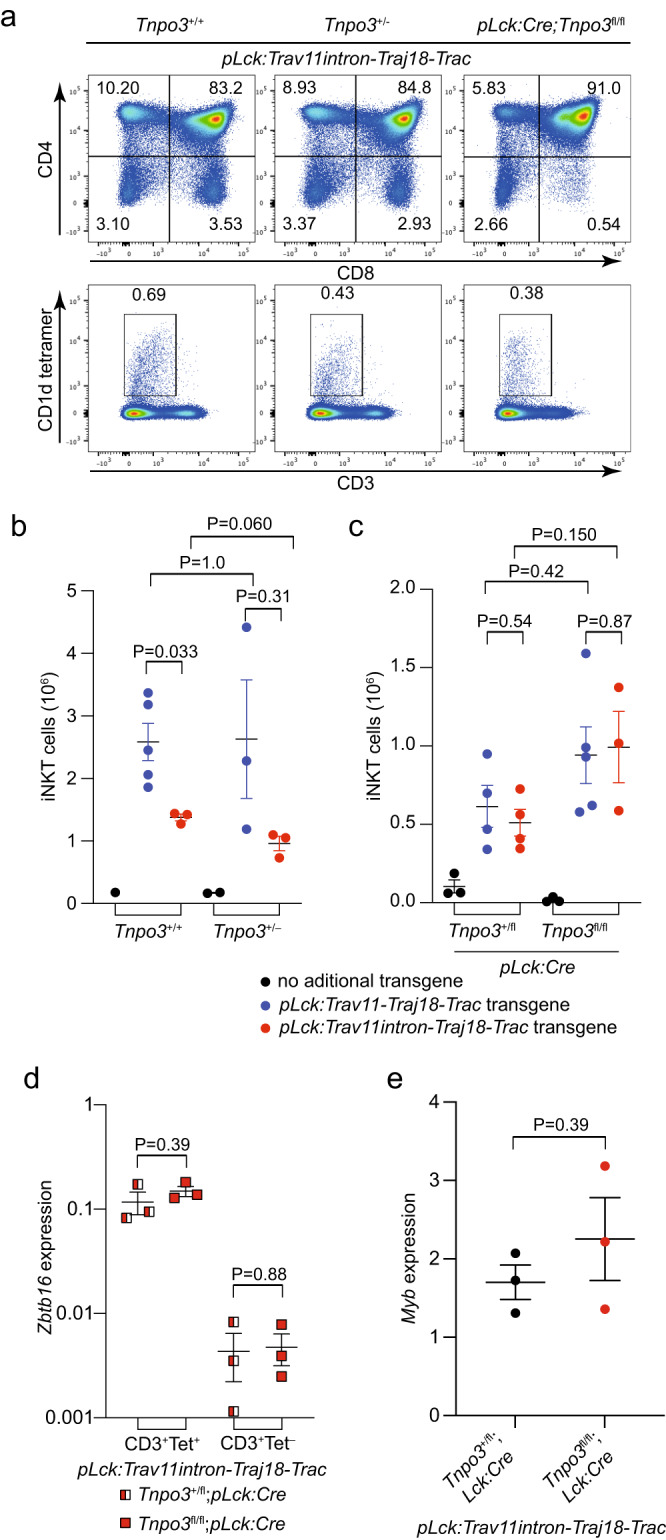
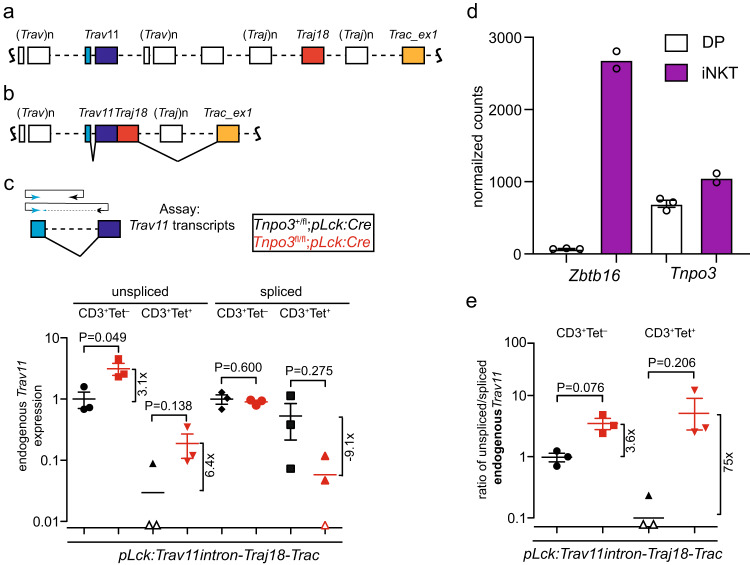
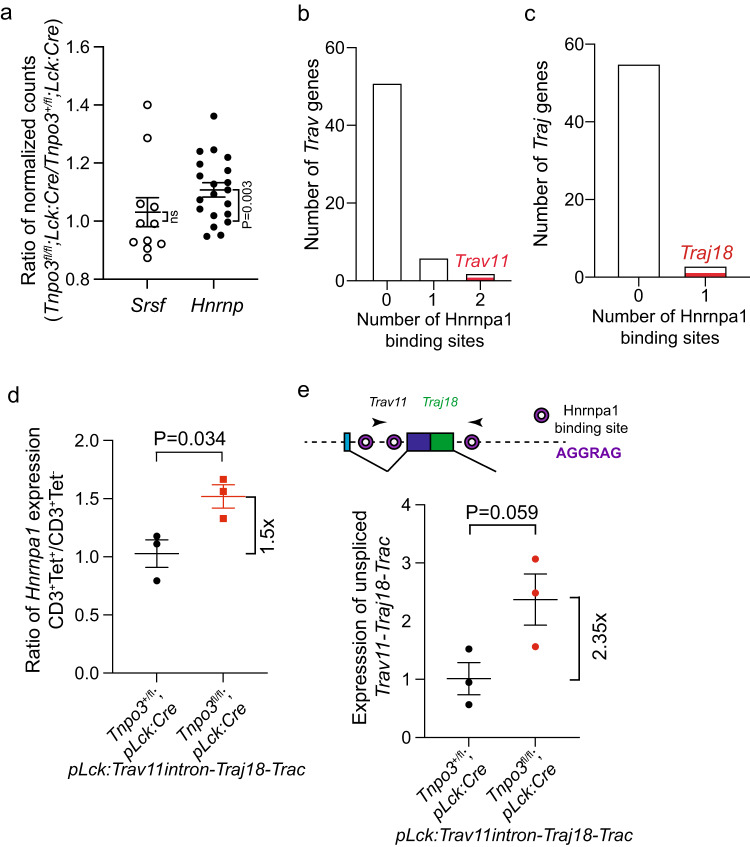
Unconventional T cells, such as innate natural killer T cells (iNKT) cells, are an important part of vertebrate immune defences. iNKT recognise glycolipids through a T cell receptor (TCR) that is composed of a semi-invariant TCR α chain, paired with a restricted set of TCR β chains. Here, we show that splicing of the cognate Trav11-Traj18-Trac pre-mRNA encoding the characteristic Vα14Jα18 variable region of this semi-invariant TCR depends on the presence of Tnpo3. The Tnpo3 gene encodes a nuclear transporter of the β-karyopherin family whose cargo includes various splice regulators. The block of iNKT cell development in the absence of Tnpo3 can be overcome by transgenic provision of a rearranged Trav11-Traj18-Trac cDNA, indicating that Tnpo3 deficiency does not interfere with the development of iNKT cells per se. Our study thus identifies a role for Tnpo3 in regulating the splicing of the pre-mRNA encoding the cognate TCRα chain of iNKT cells.


Conflict of interest statement

The authors declare no competing interests.

Figures

Fig. 1
Fig. 1. Lack of iNKT cells in the thymus of mutant Tnpo3fl/fl; pLck:Cre mice.
a Flow cytometric profiles of total thymocytes isolated from the animals of the indicated genotypes stained with anti-CD3 antibodies and an αGalCer-CD1d tetramer. The profiles are representative of three animals each; the percentage of iNKT cells is indicated above the indicated area. b Differential effect of Tnpo3 inactivation on thymocyte numbers. Note the lack of iNKT cells in the mutant animals; n = 3 biological replicates for all cell types. c The increased CD4/CD8 cell ratio in mutant animals reflects the more severely affected CD8 compartment in the mutants; n = 3 biological replicates for Tnpo3+/+ and Tnpo3fl/fl;pLck:Cre; n = 4 biological replicates for Tnpo3+/-/Tnpo3+/fl;pLck:Cre. b, c, t-test, two-tailed; mean ± s.e.m. are shown. Source data are provided as a Source Data file.
Fig. 2
Fig. 2. Restoration of iNKT development in Trav11-Traj18-Trac transgenic mice.
a Flow cytometric profiles of total thymocytes isolated from the animals of the indicated genotypes stained with anti-CD4 and anti-CD8 antibodies (upper row) and anti-CD3 antibodies and an αGalCer-CD1d tetramer (bottom row). The profiles are representative of three animals each; the percentages of CD4, CD8, and iNKT cells are indicated. b Number of iNKT cells in mice of the indicated groups (genotype designation is indicated in a separate panel); n = 3 biological replicates for genotype a; n = 5 biological replicates for genotype b; n = 7 biological replicates for genotype c; n = 4 biological replicates for genotype d; mean ± s.e.m. are shown. c Variable CD4/CD8 cell ratios in mice of the indicated groups (genotype designation is indicated in a separate panel). The reduced CD4/CD8 ratio is indicative of precocious expression of the transgene; in the absence of Tnpo3, the reduced CD8+ thymocyte numbers skew the ratio in the opposite direction (c.f. Fig. 1c); n = 3 biological replicates for genotype a; n = 5 biological replicates for genotype b; n = 7 biological replicates for genotype c; n = 4 biological replicates for genotype d; mean ± s.e.m. are shown. Source data are provided as a Source Data file.
Fig. 3
Fig. 3. Aberrant splicing of mouse T cell receptor α variable (Trav) genes.
Quantitative analysis of the fraction of unspliced transcripts of different Trav genes in Tnpo3 heterozygous (Tnpo3+/fl; pLck:Cre [n = 3 biological replicates]) and homozygous (Tnpo3fl/fl; pLck:Cre [n = 3 biological replicates]) mutant DP (a) and CD4+ (b) thymocytes as determined by RNA-seq. The gene designations are indicated. Each data point represents the result of one mouse. A statistically significant difference (P < 0.01; beta-binomial test, two-sided, Bonferroni multiple testing correction) was observed in both populations only for Trav11 (highlighted by green box with P values indicated); mean ± s.e.m. are shown. c Sashimi plot depicting the distribution of RNA sequencing reads across the Trav11 gene in CD4+ thymocytes, including those spanning splice donor and acceptor sites. The top three panels are derived from Tnpo3 heterozygous (Tnpo3+/fl; pLck:Cre), the bottom three panels from homozygous (Tnpo3fl/fl; pLck:Cre) mutant mice. d Increased levels of unspliced Trav11 transcripts in DP and CD4+ thymocytes isolated from Tnpo3 heterozygous (Tnpo3+/fl; pLck:Cre) and homozygous (Tnpo3fl/fl; pLck:Cre) mutant mice as determined by standard RT-PCR; results are representative of three animals. The positions of the unspliced and spliced cDNAs of Trav11 are indicated by the schematics to the right, as is the position of a heteroduplex (*) formed between the two forms of transcripts; the size of the spliced Trav11 cDNA is 239 bp, that of the unspliced form 453 bp. M, marker lane; 0, control reaction without template; the band marked as “heteroduplex” was identified as such by sequencing. The fragment at the bottom (#) represents primer dimers. Source data are provided as a Source Data file.
Fig. 4
Fig. 4. Restoration of iNKT development in Trav11intron-Traj18-Trac transgenic mice.
a Flow cytometric profiles of total thymocytes isolated from the animals of the indicated genotypes stained with anti-CD4 and anti-CD8 antibodies (upper row) and anti-CD3 antibodies and an αGalCer-CD1d tetramer (bottom row). The profiles are representative of three animals each; the percentages of CD4, CD8, and iNKT cells are indicated. b, c Numbers of iNKT cells in the thymus of mice of the indicated genotypes. In (b), n = 1 for Tnpo3+/+; n = 5 biological replicates for Tnpo3+/+;pLck:Trav11-Traj18-Trac; n = 3 biological replicates for Tnpo3+/+;pLck:Trav11intron-Traj18-Trac; n = 2 biological replicates for Tnpo3+/–; n = 3 biological replicates for Tnpo3+/–;pLck:Trav11-Traj18-Trac; n = 3 biological replicates for Tnpo3+/–;pLck:Trav11intron-Traj18-Trac. In (c), n = 3 biological replicates for Tnpo3+/fl;pLck:Cre; n = 4 biological replicates for Tnpo3+/fl;pLck:Cre;pLck:Trav11-Traj18-Trac; n = 4 biological replicates for Tnpo3+/fl; pLck:Cre;pLck:Trav11intron-Traj18-Trac; n = 3 biological replicates for Tnpo3fl/fl;pLck:Cre; n = 5 biological replicates for Tnpo3fl/fl;pLck:Cre;pLck:Trav11-Traj18-Trac; n = 3 biological replicates for Tnpo3fl/fl; pLck:Cre;pLck:Trav11intron-Traj18-Trac. d, e Expression levels of Zbtb16 and Myb genes (relative to Hprt) in the indicated cell populations of mice with the indicated genotypes as determined by qPCR; n = 3 biological replicates for all groups. be, t-test, two-tailed; mean ± s.e.m. are shown. Source data are provided as a Source Data file.
Fig. 5
Fig. 5. Lack of endogenous spliced Trav11-Traj18-Trac transcripts in Tnpo3-deficient thymocytes.
a Schematic of the TCR α locus, highlighting the tandem arrays of Trav and Traj genes; note that the Tcrd locus, which is sandwiched between Trav and Traj genes is not shown for simplicity. b The recombined VJ genes are transcribed into a long primary transcript that undergoes two splicing steps, removing the Trav intron and the intron separating Traj and exon 1 of the Trac gene. c qPCR assay for the detection of endogenous Trav11 splicing relative to Gapdh expression. The forward primer (blue) is located in the 5´-UTR of Trav11; the reverse primer is located either in the intron of Trav11 (top scheme), or at the junction of the two Trav11 exons and thus detects only the spliced Trav11 transcript (bottom scheme). The colour code for the two genotypes is indicated. Tet and Tet+ refers to cells negative or positive in αGalCer-CD1d tetramer staining. n = 3 biological replicates for all conditions; mean ± s.e.m. are shown. d Expression levels of Zbtb16 and Tnpo3 genes in CD4+CD8+ double positive (DP) thymocytes and thymic iNKT cells (data taken from GSE37448); n = 3 biological replicates for DP cells; n = 2 biological replicates for iNKT cells; mean ± s.e.m. shown for DP cells; mean for iNKT cells. e Ratios of unspliced and spliced endogenous Trav11 transcripts; data are from (c); n = 3 biological replicates for all conditions; mean ± s.e.m. are shown. Open data points in (c) and (e) indicate no signal; c, e, t-test, two-tailed. Source data are provided as a Source Data file.
Fig. 6
Fig. 6. Mechanism of impaired splicing of Trav11-Traj18-Trac transcripts in Tnpo3-deficient thymocytes.
a Ratio of expression levels of Srsf and Hnrnp gene family members in DP thymocytes of the two indicated genotypes; each dot represents a single gene; n = 11 Srsf genes; n = 19 Hnrnp genes. Single sample t-test, two-tailed; hypothetical mean = 1 to indicate no change between the two genotypes. The expression levels of Srsf and Hnrnp gene family members in DP thymocytes of the two genotypes are individually depicted in Supplementary Fig. 5e. Numbers of Hnrnpa1 binding sites in the introns of Trav genes (b) and downstream of Traj genes (c). Only two Trav genes possess two Hnrnpa1 binding sites, one of which is Trav11 (red); only three Traj genes posses an Hnrnpa1 binding site downstream of the splice donor site, one of which is Traj18 (red). The expression levels of these genes are depicted in Supplementary Fig. 5d. d Increased expression of Hnrnpa1 in Tnpo3-deficient thymocytes as determined by qPCR; the ratios of expression levels in iNKT cells and CD3+ thymocytes are shown; n = 3 biological replicates for both conditions; mean ± s.e.m. are shown. e Expression levels of unspliced endogenous Trav11-Traj18-Trac transcripts in DP thymocytes of the indicated genotypes as determined by qPCR; n = 3 biological replicates for both conditions; mean±s.e.m. are shown. The locations of Hnrnpa1 binding sites in the transcript is schematically indicated at the top. a, d, e, t-test, two-tailed. Source data are provided as a Source Data file.

Similar articles

Cited by

References

    1. Crosby CM, Kronenberg M. Tissue-specific functions of invariant natural killer T cells. Nat. Rev. Immunol. 2018;18:559–574. doi: 10.1038/s41577-018-0034-2. - DOI - PMC - PubMed
    1. Krovi SH, Gapin L. Invariant natural killer T cell subsets-more than just developmental intermediates. Front. Immunol. 2018;9:1393. doi: 10.3389/fimmu.2018.01393. - DOI - PMC - PubMed
    1. Jameson SC, Lee YJ, Hogquist KA. Innate memory T cells. Adv. Immunol. 2015;126:173–213. doi: 10.1016/bs.ai.2014.12.001. - DOI - PMC - PubMed
    1. Bendelac A, Savage PB, Teyton L. The biology of NKT cells. Annu. Rev. Immunol. 2007;25:297–336. doi: 10.1146/annurev.immunol.25.022106.141711. - DOI - PubMed
    1. Legoux F, Salou M, Lantz O. Unconventional or preset alphabeta T cells: evolutionarily conserved tissue-resident T cells recognizing nonpeptidic ligands. Annu. Rev. Cell. Dev. Biol. 2017;33:511–535. doi: 10.1146/annurev-cellbio-100616-060725. - DOI - PubMed

Publication types

MeSH terms

Substances

LinkOut - more resources