. 2023 Jun 20;14(1):3651.
doi: 10.1038/s41467-023-39038-8.

The contribution of inflammatory astrocytes to BBB impairments in a brain-chip model of Parkinson's disease

Affiliations

The contribution of inflammatory astrocytes to BBB impairments in a brain-chip model of Parkinson's disease

A de Rus Jacquet et al. Nat Commun. .

Abstract

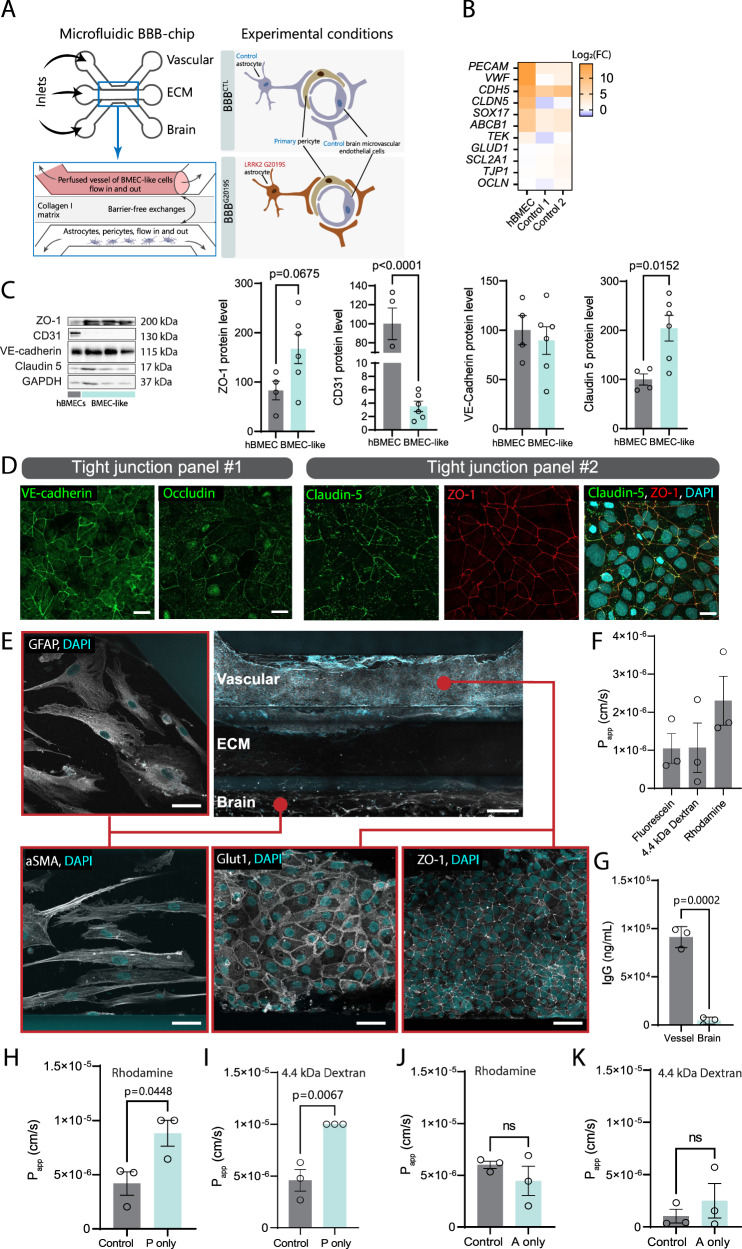
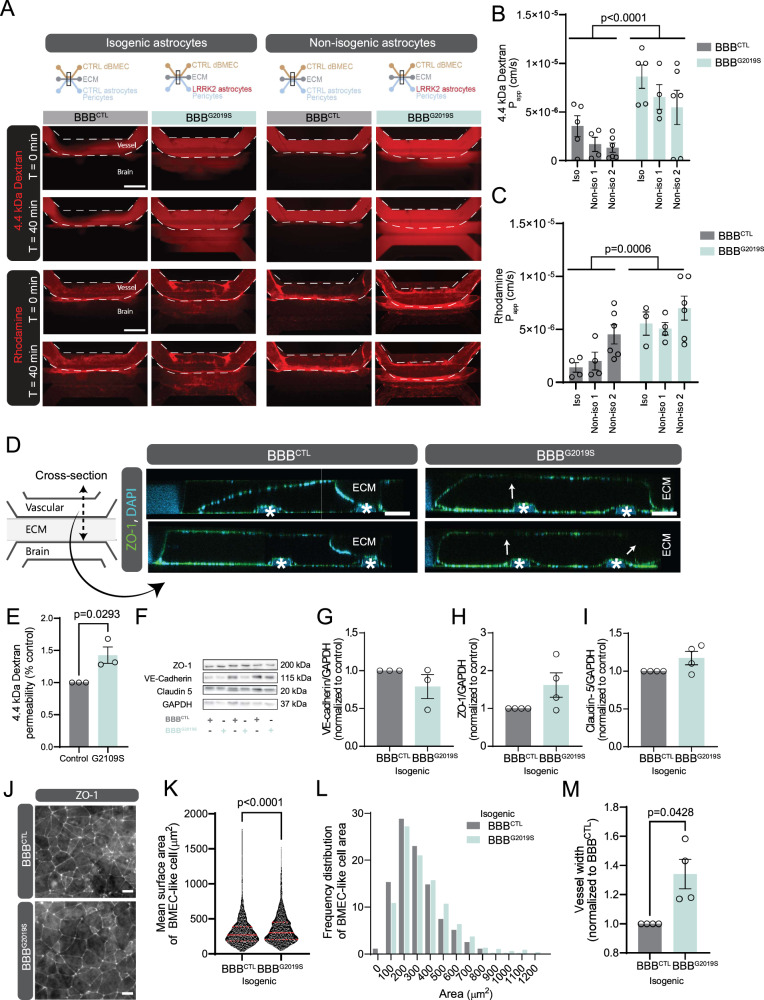
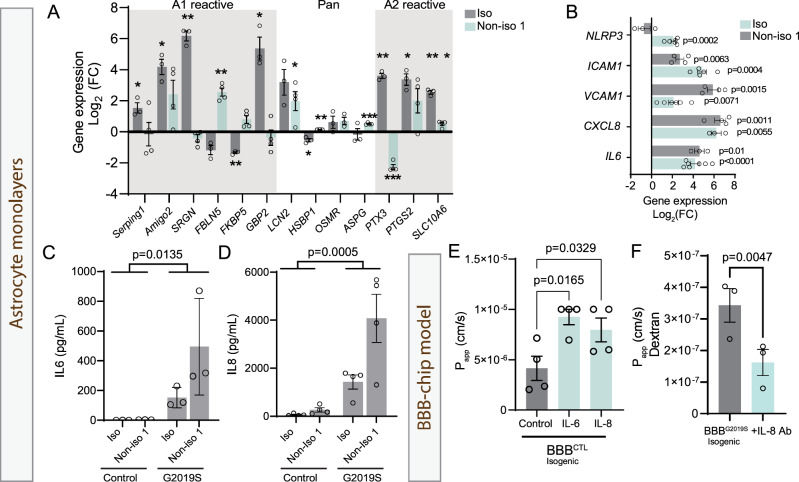
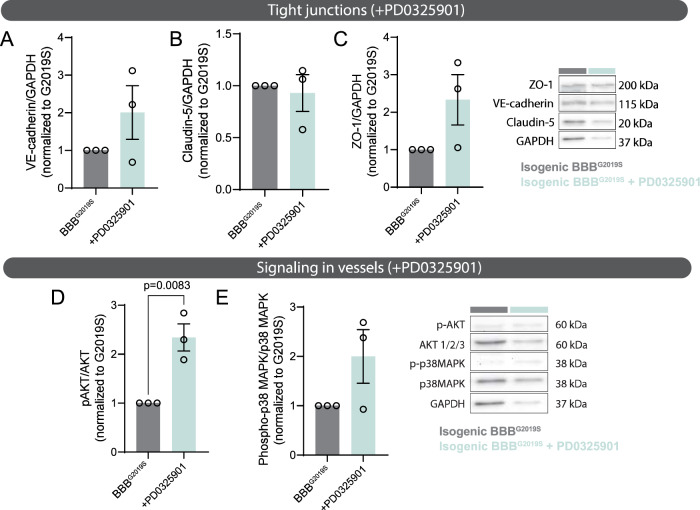
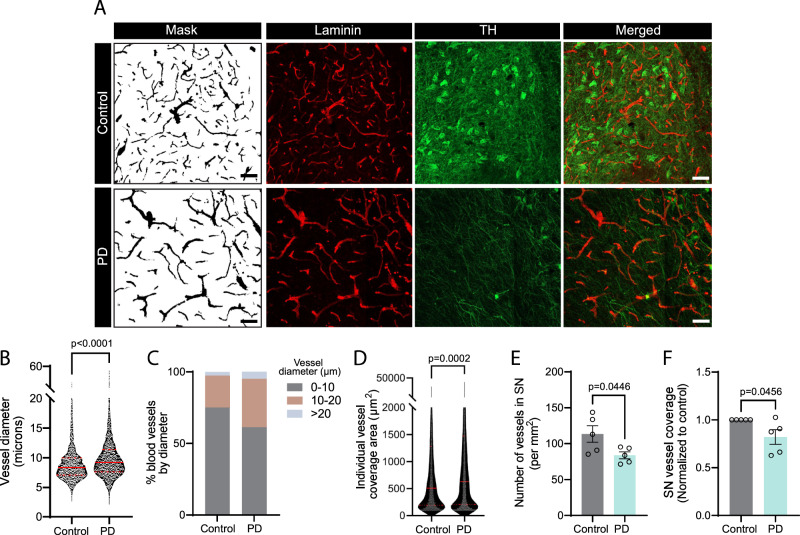
Astrocyte dysfunction has previously been linked to multiple neurodegenerative disorders including Parkinson's disease (PD). Among their many roles, astrocytes are mediators of the brain immune response, and astrocyte reactivity is a pathological feature of PD. They are also involved in the formation and maintenance of the blood-brain barrier (BBB), but barrier integrity is compromised in people with PD. This study focuses on an unexplored area of PD pathogenesis by characterizing the interplay between astrocytes, inflammation and BBB integrity, and by combining patient-derived induced pluripotent stem cells with microfluidic technologies to generate a 3D human BBB chip. Here we report that astrocytes derived from female donors harboring the PD-related LRRK2 G2019S mutation are pro-inflammatory and fail to support the formation of a functional capillary in vitro. We show that inhibition of MEK1/2 signaling attenuates the inflammatory profile of mutant astrocytes and rescues BBB formation, providing insights into mechanisms regulating barrier integrity in PD. Lastly, we confirm that vascular changes are also observed in the human postmortem substantia nigra of both males and females with PD.


Conflict of interest statement

The authors declare no competing interests. J.L.T. contributed to this article before her affiliation with the Cell Biology R&D at Thermo Fisher Scientific.

Figures

Fig. 1
Fig. 1. Meta-analysis of RNA-sequencing data reveals transcriptomic changes in inflammation and angiogenesis-related processes.
A Summary of the differentiation protocols utilized in the three studies included in the analysis to derive astrocytes from iPSCs. B Venn diagram illustrating the number of overlapping genes between each RNA-sequencing (RNA-seq) dataset. C Gene ontology analysis show upregulated components identified by RNA-seq. Benjamini–Hochberg adjusted p-values were obtained from the Database for Annotation, Visualization and Integrated Discovery (DAVID) tool. D, E Heatmaps representing the differential expression of genes encoding angiogenesis- (D) or inflammation-related factors (E) in LRRK2 G2019S vs. control iPSC-derived astrocytes. Log2(FC) represents disease vs. control fold change in gene expression. Histograms show the log2(FC) values of a selection of genes sorted in order of descending fold-change. F Gene ontology analysis of downregulated components identified by RNA-seq. G, H Heatmaps representing the differential expression of genes encoding angiogenesis- (G) or cell adhesion-related factors (H) in LRRK2 G2019S vs. control iPSC-derived astrocytes. Histograms report the log2(FC) values of a selection of genes sorted in order of descending fold-change. I Representative images of angiogenesis membrane arrays obtained using control or LRRK2 G2019S astrocyte conditioned media. Each dark dot represents a specific angiogenic factor spotted in duplicate onto the membrane. The table shows a selection of proteins either over-secreted (red) or under-secreted (blue) by iPSC-derived LRRK2 G2019S vs. control astrocytes, and the numbers refer to specific spots on the membranes. All secreted proteins were quantified and shown in panel J. J Histogram reporting the membrane quantification of secreted angiogenic factors by iPSC-derived LRRK2 G2019S vs. control astrocytes for an isogenic and non-isogenic pair. RNA-seq data were obtained from two (Di Domenico et al.), three (de Rus Jacquet et al.) or four (Booth et al.) biological replicates; Data in (D, E, G, H) represent the differential gene expression calculated for each independent RNA-seq study (n = 3 biological replicates); angiogenesis array data in (J) are from three (isogenic line) and four (non-isogenic line) independent biological replicates; error bars represent mean + standard error of the mean (SEM). Statistical analysis was performed prior to log2 transformation using one sample t test with a theoretical mean of 1 (J). iso isogenic iPSC line, non-iso non-isogenic iPSC line. Source data are provided as a Source Data file.
Fig. 2
Fig. 2. Establishing a human model of the BBB using iPSC and microfluidic technologies.
A Model showing the BBB chip and experimental design. Inlet arrows indicate where the cells and ECM gel are loaded. B Gene expression validation by RT-qPCR of markers of endothelial cell identity in primary human brain microvascular endothelial cells (hBMEC) or BMEC-like cell monolayers. The heatmap represents the log2(fold change) values of hBMEC or control BMEC-like cells vs. control iPSCs. C Western blot-based quantification of tight junction proteins ZO-1, CD31, VE-cadherin and claudin 5 in hBMEC and BMEC-like cell monolayers normalized to GAPDH loading control. Data are represented as the combined protein levels for three different control iPSC lines independently differentiated into BMEC-like cells. D Confocal images of immunostained control BMEC-like cells illustrate the expression and localization of tight junction proteins VE-cadherin (green), occludin (green), claudin-5 (green), ZO-1 (red) and merged claudin-5 (red) and ZO-1 (green) with the nuclear marker DAPI represented in blue. E Confocal images of an immunostained BBB chip indicate expression of ZO-1 and Glut1 (white, bottom center and right panels), and GFAP and αSMA (white, left panels). Blue structures in all images represent the nuclear marker DAPI. F Retention of fluorescein, 4.4 kDa dextran-TMRE and p-glycoprotein substrate rhodamine over a 40-min incubation in BBBCTL vessels cultured for 6 days in vitro (6 DIV). G Graphs showing BBBCTL vessel permeability to IgG. HK Graphs showing vessel permeability to rhodamine (H, J) and 4.4 kDa dextran-TMRE (I, K) at 6 DIV when a BBBCTL is prepared with pericytes only (P only) in the absence of iPSC-derived astrocytes (H, I), or with astrocytes only (A only) (J, K). Data are from three (B, FK) biological replicates; in (C), data were produced using a total of six biological BMEC-like cell replicates originating from three independent iPSC lines. Error bars represent mean + SEM. Statistical analysis was performed using two-tailed unpaired Student’s t test with equal standard deviation (s.d.), Scale bars: 20 µm (D), 50 and 200 µm (E). The BBBCTL and BBBG2019S nomenclature refers to the presence of either control or LRRK2 G2019S astrocytes in the brain compartment of the BBB chip. Papp apparent permeability, s seconds. Source data are provided as Source Data file.
Fig. 3
Fig. 3. Astrocytes with the LRRK2 G2019S mutation fail to support the formation of a functional BBB.
A Representative images of 4.4 kDa dextran-TMRE (red, top images) or rhodamine (red, bottom images) in BBBG2019S vs. BBBCTL chips after a 40-min incubation, prepared using two independent LRRK2 G2019S iPSC pairs. B, C Quantification of 4.4 kDa dextran-TMRE (B) and rhodamine (C) apparent permeability (Papp) values in chips prepared using three independent iPSC pairs. D Confocal images illustrating two cross-sections of immunostained vessels expressing ZO-1 (green) and DAPI nuclear stain (blue). White arrows indicate areas of low or absent immunoreactivity, white stars point to the localization of guides imprinted on the microchip. E Quantification of 4.4 kDa dextran-TMRE permeability in a transwell system, results for isogenic and non-isogenic line 1 are combined into a single graph. F Representative immunoblots depicting protein levels of tight junction markers VE-cadherin, ZO-1, claudin-5 and loading control GAPDH in vessels. GI Quantifications of VE-cadherin (G), ZO-1 (H), and claudin-5 (I) protein levels in vessels were normalized to GADPH. Data are shown as the fold change of BBBG2019S levels compared to BBBCTL. J Representative images of immunostained BBBCTL and BBBG2019S vessels depicting ZO-1 expression in BMEC-like cells. K, L Quantification of control and LRRK2 G2019S BMEC-like cell mean surface area (K) and frequency distribution (L). M Graph representing vessel width in BBBG2019S chips normalized to BBBCTL. Data are from three (E, G), four (H, I, M), five (B) or six (C) biological replicates; data in (K, L) are sampled from >900 individual cells from three independent biological replicates; error bars represent mean + SEM. Outliers were identified using Grubbs’ test with an alpha value set at 0.05 and removed from analysis. Statistical analysis was performed using two-tailed unpaired Student’s t test with equal s.d. Violin plot in (K) shows the median (red line) and quartile (red dotted line) values. Scale bar: 600 µm (A), 100 µm (D), 15 µm (J). The BBBCTL and BBBG2019S nomenclature refers to the presence of either control or LRRK2 G2019S astrocytes in the brain compartment of the BBB chip. cm centimeter, iso isogenic iPSC line, kDa kilodalton, min minutes, non-iso non-isogenic iPSC line, s seconds. Source data are provided as a Source Data file.
Fig. 4
Fig. 4. Astrocytes with the LRRK2 G2019S mutation are pro-inflammatory.
A Gene expression validation by RT-qPCR of a panel of 13 markers characteristic of astrocyte reactivity, using control and LRRK2 G2019S astrocytes cultured in monolayers. Data are shown as log2(fold change) values of LRRK2 G2019S vs. control astrocytes for the isogenic and non-isogenic pairs. B Gene expression quantification by RT-qPCR of the inflammasome component NLRP3, adhesion molecules ICAM1 and VCAM1, and pro-inflammatory cytokines CXCL8 and IL6 for the isogenic and non-isogenic astrocyte pairs grown as monolayers. Data are shown as log2(fold change) values of LRRK2 G2019S vs. control astrocytes. C, D ELISA-based quantification of IL-6 (C) and IL-8 (D) concentration in astrocyte conditioned media prepared from isogenic and non-isogenic pairs. E Graph showing vessel permeability to rhodamine at 6 days in vitro (DIV) when the brain compartment of a BBBCTL is treated with 100 ng/mL IL-6 or IL-8 for 6 days. F Graph showing vessel permeability to 4.4 kDa dextran-TMRE when the brain compartment of a BBBG2019S chip is treated with 0.8 µg/mL IL-8 neutralizing antibody. Data are from three (A, iso; B, iso NLRP3, non-iso CXCL10, iso IL6; C, F), four (A, non-iso; B, iso ICAM1, iso VCAM1, non-iso CXCL10; D, E), five (B, iso ICAM1), six (B, non-iso NLRP1 and VCAM1), or seven (B, non-iso IL6) biological replicates; error bars represent mean + SEM. Statistical analysis was performed using one sample t test with a theoretical mean of 0 (AC), two-tailed unpaired Student’s t test with equal s.d. (DG, I), or a one-way ANOVA with Dunnett’s multiple comparisons test (I) (*p ≤ 0.05, **p < 0.01, ***p < 0.001). The exact p-values for data shown in (A) are available in the source data file. Outliers were identified using Grubbs’ test with an alpha value set at 0.05 and removed from analysis. The BBBCTL and BBBG2019S nomenclature refers to the presence of either control or LRRK2 G2019S astrocytes in the brain compartment of the BBB chip. iso isogenic iPSC line, non-iso non-isogenic iPSC line. Source data are provided as a Source Data file.
Fig. 5
Fig. 5. The LRRK2 G2019S mutation is associated with activation of the MEK/ERK pathway, which mediates the astrocyte inflammatory profile.
A Heatmap representing, for each GO term identified in Fig. 1, the percent genes targeted by ERK-related transcription factor. B Model showing the MEK/ERK cascade and the targets of small molecule inhibitors PD0325901 and SCH772984 used in this study. C Representative immunoblots and quantification of phosphorylated ERK1/2 (p-ERK1/2), total ERK1/2, and loading control GAPDH in LRRK2 G2019S and isogenic control astrocytes cultured as monolayers. D Gene expression quantification by RT-qPCR of a panel of 13 markers characteristic of astrocyte reactivity, using control and LRRK2 G2019S astrocytes cultured in monolayers and treated with 0.5 µM PD0325901 for 24 h. Data are shown as log2(fold change) values of LRRK2 G2019S vs. control astrocytes for the isogenic and non-isogenic pairs. E, F Gene expression quantification by RT-qPCR of the inflammasome component NLRP3 and pro-inflammatory cytokines CXCL8 and IL6 for the isogenic and non-isogenic astrocyte pairs grown as monolayers and treated with 0.5 µM PD0325901 (E) or 0.5 µM SCH772984 (F) for 24 h. G, H ELISA-based quantification of IL-6 (G) or IL-8 (H) concentration in astrocyte conditioned media prepared from isogenic and non-isogenic pairs treated with 0.5 µM PD0325901 for 24 h. Data are from at least three (C–F, H) or four (G) independent biological replicates; error bars represent mean + SEM. Statistical analysis was performed using one sample t test with a theoretical mean of 0 (D) or 1 (E-F), two-tailed unpaired Student’s t test with equal s.d. (C), or two-way ANOVA with Šídák’s multiple comparisons test (G) (*p ≤ 0.05, **p < 0.01). The exact p-values for data shown in (D) are available in the source data file. The BBBCTL and BBBG2019S nomenclature refers to the presence of either control or LRRK2 G2019S astrocytes in the brain compartment of the BBB chip. iso isogenic iPSC line, kDa kilodalton, non-iso non-isogenic iPSC line. Source data are provided as a Source Data file.
Fig. 6
Fig. 6. Pharmacological inhibition of MEK1/2 in the brain compartment of the BBB chip rescues barrier integrity.
A, B ELISA-based quantification of IL-6 (A) and IL-8 (B) in glia conditioned media collected from the brain compartment of isogenic and non-isogenic BBBG2019S chips after treatment with 0.5 µM PD0325901 for 4 to 6 days. C Confocal images of BBBG2019S vessels immunostained with tight junction marker ZO-1. These cultures were grown in the absence or presence of 0.5 µM PD0325901 for 6 days. DF Graphs showing vessel permeability to rhodamine (D, E) and 4.4 kDa dextran-TMRE (F) when the brain compartment of a BBBG2019S chip is treated with regular growth medium or medium supplemented with 0.5 µM PD0325901 for the duration of the experiment. Data were collected using isogenic and non-isogenic iPSC pairs. G Quantification of vessel width in BBBG2019S chips produced in the absence or presence of 0.5 µM PD0325901 for 6 days. H, I Graphs showing vessel permeability to 4.4 kDa dextran-TMRE (H) and rhodamine (I) when the brain compartment of a BBBG2019S chip is treated with regular growth medium or medium supplemented with 5 µM LRRK2-IN-1 for the duration of the experiment. Data are from three (A, B, E, G, H), four (B, D, F, I), five (A) or six (E, F) biological replicates; error bars represent mean + SEM. Statistical analysis was performed using two-tailed unpaired Student’s t test with equal s.d. AM. Scale bar: 200 µm (C). The BBBG2019S nomenclature refers to the presence of LRRK2 G2019S astrocytes in the brain compartment of the BBB chip. Source data are provided as a Source Data file.
Fig. 7
Fig. 7. Rescue of BBB function is associated with increased AKT phosphorylation in the vessels.
AC Immunoblots showing protein levels of tight junction markers VE-cadherin (A), claudin-5 (B), ZO-1 (C), and loading control GAPDH in lysates extracted from the vascular compartment of BBBG2019S chips in which the brain compartment was treated with regular growth medium or medium supplemented with 0.5 µM PD0325901 for 6 days. Protein levels are normalized to GAPDH loading control and data is shown as the fold change of treated vs. untreated BBBG2019S vessels. D, E Immunoblots reporting protein levels of phosphorylated AKT, total AKT (D), phosphorylated p38MAPK, total p38 MAPK (E), or loading control GAPDH in lysates extracted from the vascular compartment of BBBG2019S chips in which the brain compartment was treated with regular growth medium or medium supplemented with 0.5 µM PD0325901 for 6 days. Protein levels are normalized to GAPDH loading control and data are shown as the fold change of treated vs. untreated BBBG2019S vessels. Data are from three biological replicates; error bars represent mean + SEM. Statistical analysis was performed using two-tailed unpaired Student’s t test with equal s.d. The BBBG2019S nomenclature refers to the presence of LRRK2 G2019S astrocytes in the brain compartment of the BBB chip. Source data are provided as a Source Data file.
Fig. 8
Fig. 8. The BBB chip recapitulates morphological changes to the vasculature observed in the substantia nigra of PD patients.
A Confocal images of human postmortem sections of the substantia nigra immunostained for laminin (red) and TH (green). The brain sections were obtained from age- and sex-matched controls or patients with PD. A mask of the laminin-positive staining was produced using FIJI image analysis software. BF Graphs reporting laminin-positive vessel diameter (B) and size distribution (C), individual laminin-positive vessel coverage area (D), number of laminin-positive vessels (E), and overall vessel coverage (F) in the substantia nigra of PD patients vs control. Data were collected using postmortem brain sections originating from five age- and sex-matched controls and five PD cases; error bars represent mean + SEM. Violin plot in (B) and (D) indicate the median (red line) and quartile (red dotted line) values. Statistical analysis was performed using two-tailed unpaired Student’s t test with equal s.d. Scale bar: 100 µm (A). Source data are provided as a Source Data file.

Similar articles

Cited by

References

    1. Qin XY, Zhang SP, Cao C, Loh YP, Cheng Y. Aberrations in peripheral inflammatory cytokine levels in Parkinson disease: a systematic review and meta-analysis. JAMA Neurol. 2016;73:1316–1324. doi: 10.1001/jamaneurol.2016.2742. - DOI - PubMed
    1. Brochard V, et al. Infiltration of CD4+ lymphocytes into the brain contributes to neurodegeneration in a mouse model of Parkinson disease. J. Clin. Invest. 2009;119:182–192. - PMC - PubMed
    1. McGeer PL, Itagaki S, Boyes BE, McGeer EG. Reactive microglia are positive for HLA-DR in the substantia nigra of Parkinson’s and Alzheimer’s disease brains. Neurology. 1988;38:1285–1291. doi: 10.1212/WNL.38.8.1285. - DOI - PubMed
    1. Harms AS, et al. MHCII is required for alpha-synuclein-induced activation of microglia, CD4 T cell proliferation, and dopaminergic neurodegeneration. J. Neurosci. 2013;33:9592–9600. doi: 10.1523/JNEUROSCI.5610-12.2013. - DOI - PMC - PubMed
    1. Troncoso-Escudero P, Parra A, Nassif M, Vidal RL. Outside in: unraveling the role of neuroinflammation in the progression of Parkinson’s disease. Front Neurol. 2018;9:860. doi: 10.3389/fneur.2018.00860. - DOI - PMC - PubMed

Publication types