. 2023 Jun 20;14(1):3643.
doi: 10.1038/s41467-023-39423-3.

Antioxidant hepatic lipid metabolism can be promoted by orally administered inorganic nanoparticles

Affiliations

Antioxidant hepatic lipid metabolism can be promoted by orally administered inorganic nanoparticles

Jie Cai et al. Nat Commun. .

Abstract

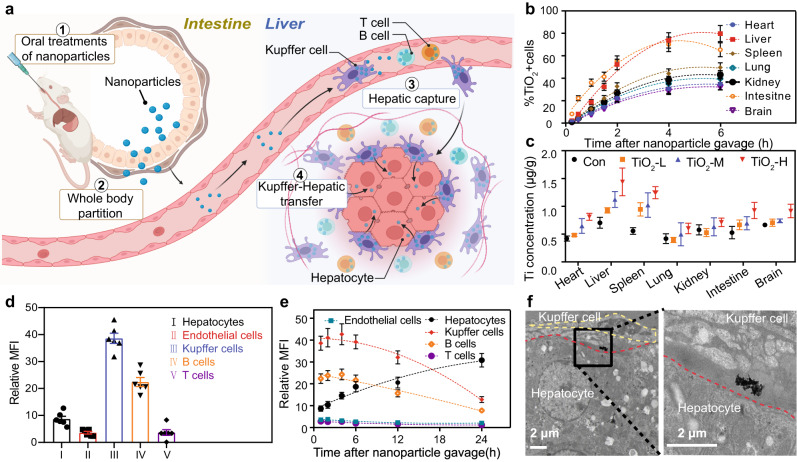
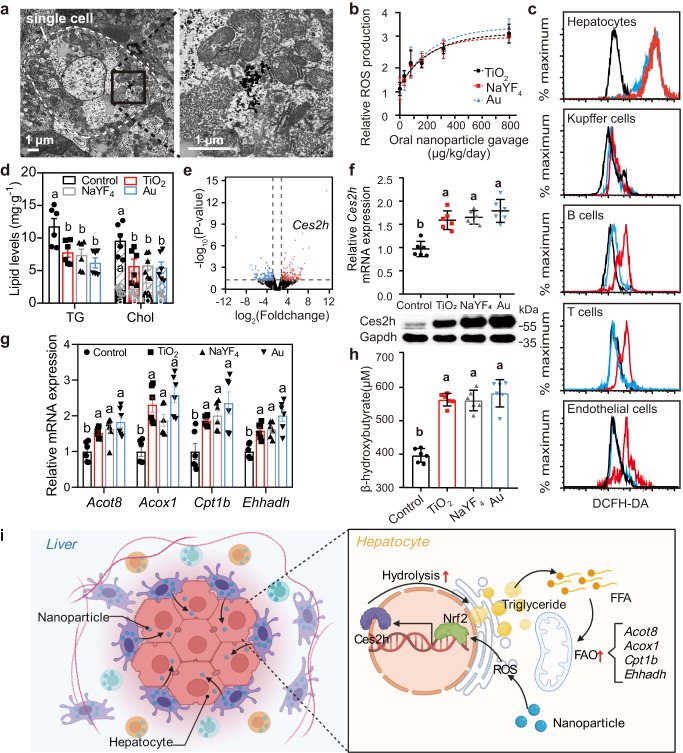
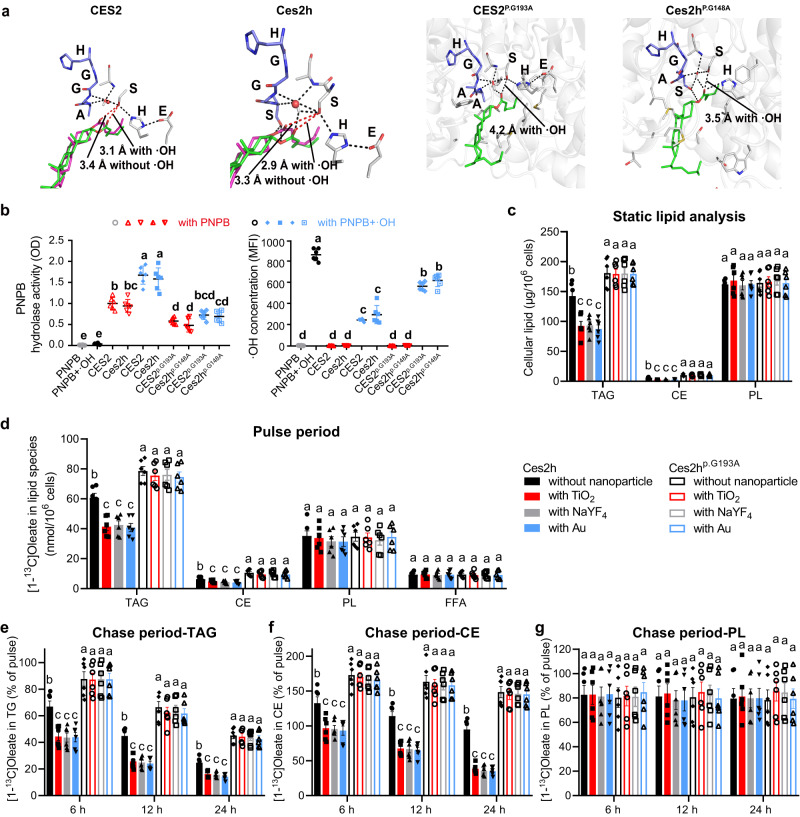
Accumulation of inorganic nanoparticles in living organisms can cause an increase in cellular reactive oxygen species (ROS) in a dose-dependent manner. Low doses of nanoparticles have shown possibilities to induce moderate ROS increases and lead to adaptive responses of biological systems, but beneficial effects of such responses on metabolic health remain elusive. Here, we report that repeated oral administrations of various inorganic nanoparticles, including TiO2, Au, and NaYF4 nanoparticles at low doses, can promote lipid degradation and alleviate steatosis in the liver of male mice. We show that low-level uptake of nanoparticles evokes an unusual antioxidant response in hepatocytes by promoting Ces2h expression and consequently enhancing ester hydrolysis. This process can be implemented to treat specific hepatic metabolic disorders, such as fatty liver in both genetic and high-fat-diet obese mice without causing observed adverse effects. Our results demonstrate that low-dose nanoparticle administration may serve as a promising treatment for metabolic regulation.


Conflict of interest statement

The authors declare no competing interests.

Figures

Fig. 1
Fig. 1. In vivo transfer of orally administrated nanoparticles and their targeted liver accumulation.
a Schematic illustration (Created with BioRender.com) showing in vivo delivery of orally administrated nanoparticles to liver tissues. b Time-dependent distribution of nanoparticle-positive cells in the main organs of wild-type (WT) mice after treatment with gavage of fluorescence (Cy5.5)-modified TiO2 nanoparticles (0.72 mg/kg). The detailed gating strategy is provided in supplementary information, Fig. S6. c Elemental analysis showing the bio-distributions of Ti elements in the main organs of mice 21 days after nanoparticle gavage. TiO2-L, TiO2-M, and TiO2-H represent mice groups treated with low-dose (0.72 mg/kg/day), middle-dose (1.8 mg/kg/day), and high-dose (18 mg/kg/day) of TiO2 nanoparticles, respectively. d Relative mean fluorescence intensity (MFI) of different types of liver cells indicating the accumulation of Cy5.5-modified TiO2 nanoparticles in different liver cells in WT mice 1 h after gavage of Cy5.5-modified TiO2 nanoparticles (1.8 mg/kg). e Relative MFI changes in different types of liver cells indicating dynamic changes of nanoparticle distributions in liver cells as a function of time after Cy5.5-modified TiO2 nanoparticle gavage. f Representative transmission electron microscopy (TEM) images showing the Kupffer-hepatocyte nanoparticle transfer. The TEM samples were collected 6 h after gavage of nanoparticles. Data in (be) are presented as mean values ± SEM. n = 6. Source data are provided as a Source Data file.
Fig. 2
Fig. 2. Promotion of hepatic lipid metabolism by nanoparticle-activated Ces2h expression.
a Transmission electron microscopy images indicating the subcellular distributions of TiO2 nanoparticles in a hepatocyte 24 h after nanoparticle gavage (0.72 mg/kg). b Nanoparticle-dose-dependent hepatocyte ROS production by different nanoparticles at 18 h after nanoparticle gavage. c Flow cytometry showing ROS generation in different types of liver cells. The black, blue, and red curves represent liver samples collected at 6, 18, 24 h after TiO2 nanoparticle gavage (0.72 mg/kg), respectively. d Effect of different types of nanoparticle treatments (0.72 mg/kg/day for 21 days) on liver lipid levels in wild-type (WT) mice. TG triglyceride, Chol cholesterol. The full length of the column represents the total cholesterol level (significance indicated above the column), the color-filled part represents the cholesterol ester level (significance indicated inside the column, in white), and the diagonally-filled part represents the free cholesterol level (significance indicated inside the column, in corresponding color). e Volcano plot of liver transcriptomic comparison between the TiO2-treated group (0.72 mg/kg) and the control group of WT mice (n = 5). FoldChange = TPMTiO2/TPMControl. f Relative hepatic Ces2h mRNA expressions measured by RT-qPCR (upper), and Ces2h protein expression measured by western blotting (lower) in WT mice. g Hepatic mRNA levels of fatty acid oxidation (FAO) genes in mice measured by RT-qPCR. h Plasma β-hydroxybutyrate levels in WT mice. i Schematic diagram (Created with BioRender.com) showing the reduction of liver triglycerides by nanoparticles. Different letters indicate the significant difference (P < 0.05) analyzed by one-way ANOVA. Expect for otherwise specified, data in (b, d, f–h) are presented as mean values ± SEM. n = 6. Source data are provided as a Source Data file.
Fig. 3
Fig. 3. Carboxylesterase 2 (CES2/Ces2) antioxidant response to ROS in the presence of nanoparticles.
a Computational simulations of molecular docking of normal CES2/Ces2h or mutated CES2p.G193A/Ces2hp.G148A with cholesterol ester and ·OH. Blue stick: oxyanion hole; Green sticks: spatial configuration of ligands with·OH in the oxyan hole; Pink sticks: spatial configuration of ligands without ·OH in the oxyan hole; Black dashes: hydrogen-bond interactions. b In vitro catalytic activity and corresponding ·OH concentration changes of normal CES2/Ces2h or mutated CES2p.G193A/Ces2hp.G148A enzymes on catalyzing PNPB hydrolysis under different conditions. c Intracellular lipid fraction analysis of normal Ces2h or mutated Ces2hp.G148A hepatocyte cell lines upon treatments with TiO2, NaYF4, and Au nanoparticles, respectively. d Incorporation of [1-13C]oleate into cellular lipids. e–g Chase experiments evaluating the turnover of lipid species, including triglycerides (TG), cholesterol esters (CE), and phospholipids (PL). Statistics for the chase period were analyzed as a percentage of the pulse. The group setting was the same in (c–g) as indicated in (d). Different letters indicate the significant difference (P < 0.05) analyzed by one-way ANOVA. Data in (bg) are presented as mean values ± SEM. n = 6. Source data are provided as a Source Data file.
Fig. 4
Fig. 4. Nanoparticle administration for treatment of lipid metabolic disorder in genetic obesity (db/db) mice by restoration of hepatic Ces2h expression.
a Scheme (Created with BioRender.com) showing the oral administration procedure for nanoparticle treatments (0.72 mg/kg per dose) over 92 days on db/db mice. FFA, free fatty acids. b Relative Ces2h mRNA expression, measured by RT-qPCR, in enterohepatic systems of wild-type (WT) or db/db mice fed with chow food in the absence of nanoparticle treatment. c Relative Ces2h mRNA expression, measured by RT-qPCR, in the liver of db/db mice on day 92 of nanoparticle treatments with different types of nanoparticles. d Body weight of db/db mice on day 92 of nanoparticle treatments with different types of nanoparticles. e Triglyceride (TG) and total cholesterol (Chol) contents in liver of db/db mice after nanoparticle treatments. f Oil-red O and (g), Hematoxylin-eosin (HE) staining of liver tissues of db/db mice collected on day 92 of the treatments. Different letters indicate the significant difference (P < 0.05) analyzed by one-way ANOVA. Data in (be) are presented as mean values ± SEM. n = 6. Source data are provided as a Source Data file.
Fig. 5
Fig. 5. Improvement of lipid metabolism by nanoparticle administration in C57BL/6 wild-type (WT) mice fed a high fat diet (HFD).
a Scheme showing the oral administration procedure for nanoparticle treatments over 91 days on WT mice fed a HFD for 90 days. The oral treatment of nanoparticles was performed by a 3-month gavage (0.72 mg/kg per dose). Body (b) and liver (c) weight, hepatic triglyceride (TG) and total cholesterol (Chol) levels (d), Plasma alanine aminotransferase (ALT) and aspartate aminotransferase (AST) levels (e), and relative Ces2h mRNA expression, measured by RT-qPCR, (f) of HFD-fed C57BL/6 mice on day 181 of nanoparticle treatments. g Hematoxylin-eosin (HE) and Oil-red O staining of liver tissues of WT mice collected on day 181 of the treatments. Different letters indicate the significant difference (P < 0.05) analyzed by one-way ANOVA. Data in (bf) are presented as mean values ± SEM. n = 6. Source data are provided as a Source Data file.

Similar articles

Cited by

References

    1. Maynard AD. Is novelty overrated? Nat. Nanotechnol. 2014;9:409–410. doi: 10.1038/nnano.2014.116. - DOI - PubMed
    1. Matter MT, et al. Multiscale analysis of metal oxide nanoparticles in tissue: insights into biodistribution and biotransformation. Adv. Sci. 2020;7:2000912. doi: 10.1002/advs.202000912. - DOI - PMC - PubMed
    1. Kim D, Kim J, Park YI, Lee N, Hyeon T. Recent development of inorganic nanoparticles for biomedical imaging. ACS Cent. Sci. 2018;4:324–336. doi: 10.1021/acscentsci.7b00574. - DOI - PMC - PubMed
    1. Luther DC, et al. Delivery of drugs, proteins, and nucleic acids using inorganic nanoparticles. Adv. Drug Deliv. Rev. 2020;156:188–213. doi: 10.1016/j.addr.2020.06.020. - DOI - PMC - PubMed
    1. Palui G, Aldeek F, Wang W, Mattoussi H. Strategies for interfacing inorganic nanocrystals with biological systems based on polymer-coating. Chem. Soc. Rev. 2015;44:193–227. doi: 10.1039/C4CS00124A. - DOI - PubMed

Publication types