. 2023 Jun 21;14(1):3673.
doi: 10.1038/s41467-023-39401-9.

SLC7A11 expression level dictates differential responses to oxidative stress in cancer cells

Affiliations

SLC7A11 expression level dictates differential responses to oxidative stress in cancer cells

Yuelong Yan et al. Nat Commun. .

Abstract

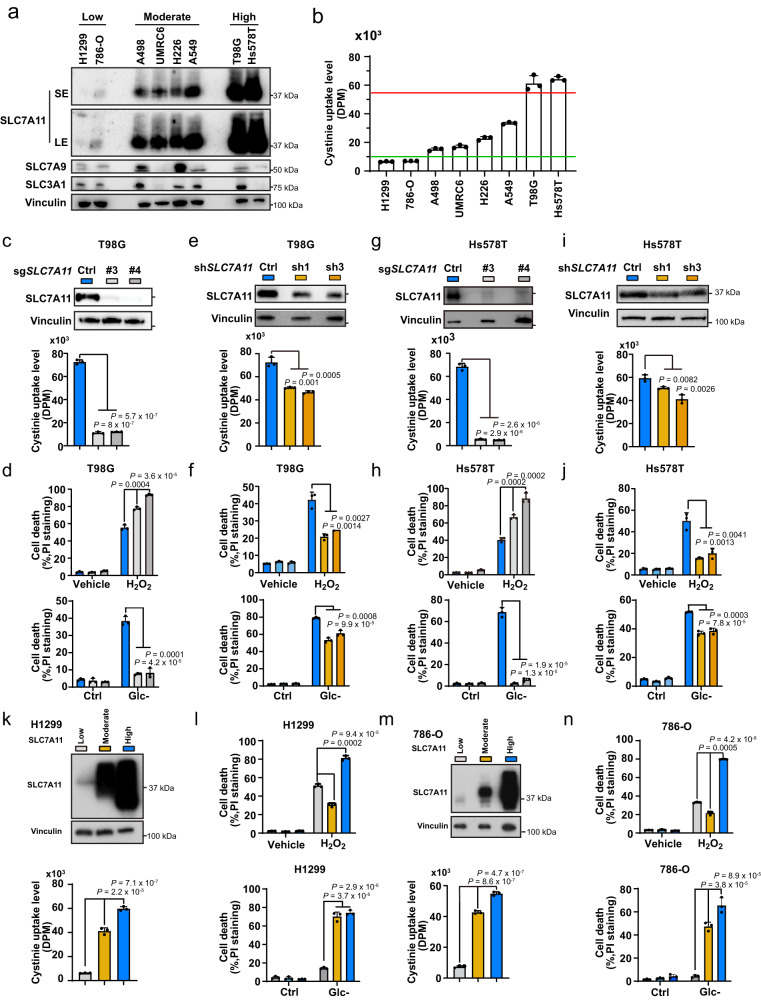
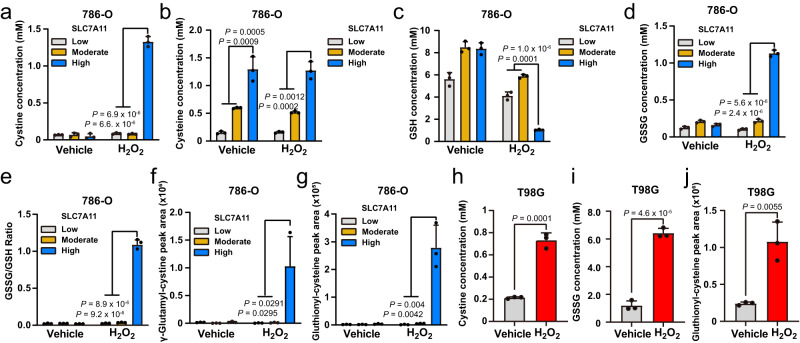
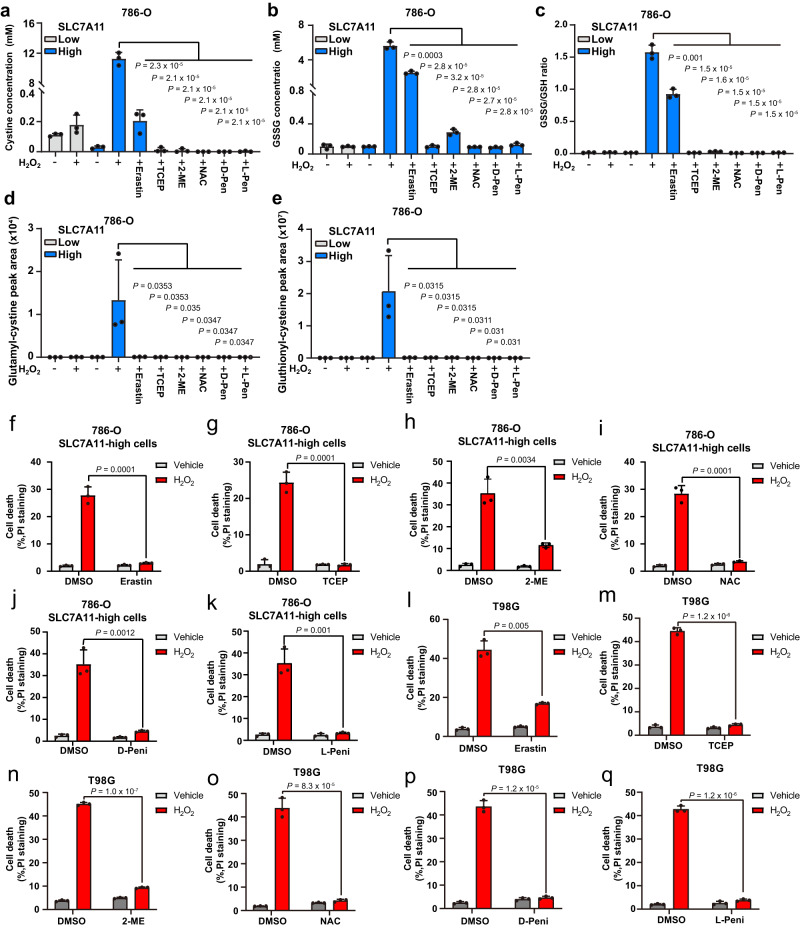
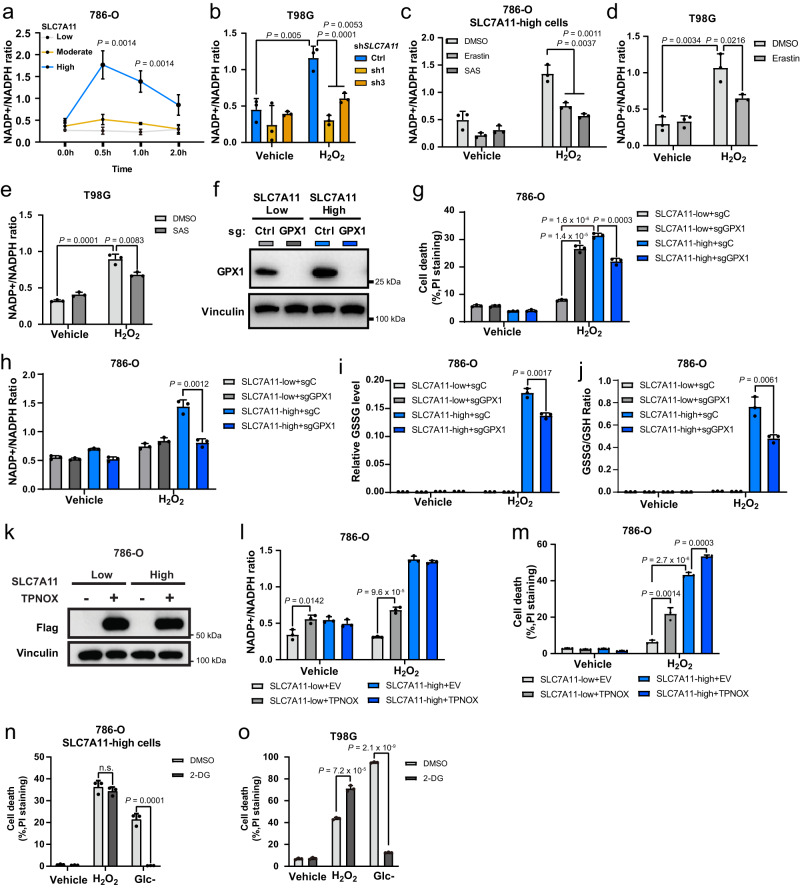
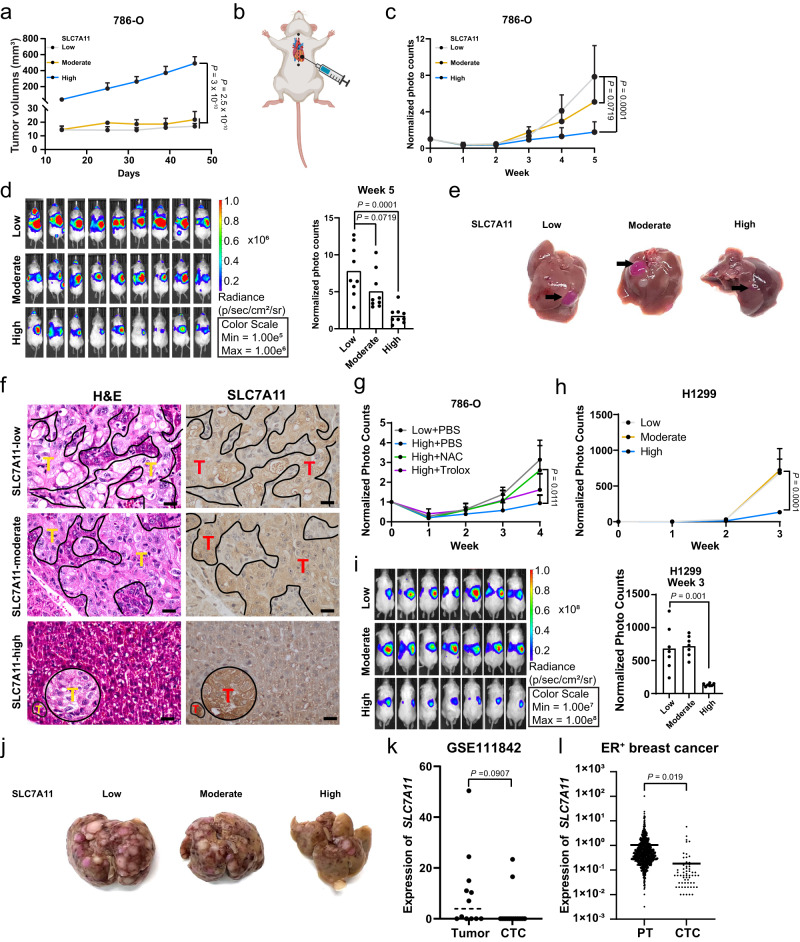
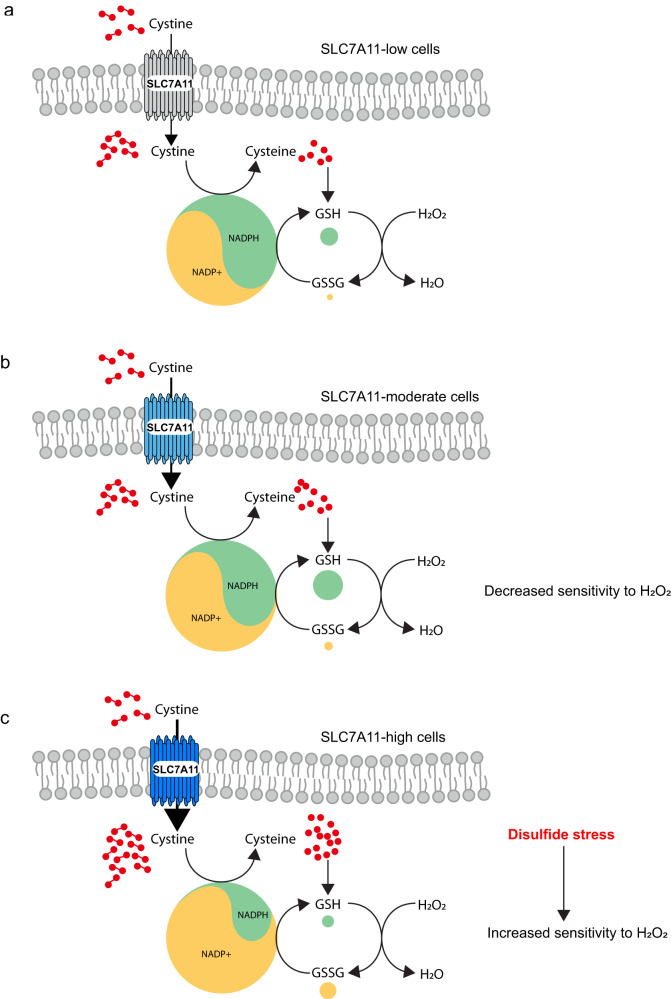
The cystine transporter solute carrier family 7 member 11 (SLC7A11; also called xCT) protects cancer cells from oxidative stress and is overexpressed in many cancers. Here we report a surprising finding that, whereas moderate overexpression of SLC7A11 is beneficial for cancer cells treated with H2O2, a common oxidative stress inducer, its high overexpression dramatically increases H2O2-induced cell death. Mechanistically, high cystine uptake in cancer cells with high overexpression of SLC7A11 in combination with H2O2 treatment results in toxic buildup of intracellular cystine and other disulfide molecules, NADPH depletion, redox system collapse, and rapid cell death (likely disulfidptosis). We further show that high overexpression of SLC7A11 promotes tumor growth but suppresses tumor metastasis, likely because metastasizing cancer cells with high expression of SLC7A11 are particularly susceptible to oxidative stress. Our findings reveal that SLC7A11 expression level dictates cancer cells' sensitivity to oxidative stress and suggests a context-dependent role for SLC7A11 in tumor biology.


Conflict of interest statement

K.O. and L.K. are former full-time employees of Kadmon Corporation and are now full-time employees of the Barer Institute and Sanofi, US, respectively. M.V.P. is a full-time employee of Kadmon Corporation, a Sanofi Company. The other authors declare no competing interests.

Figures

Fig. 1
Fig. 1. Moderate and high overexpression of SLC7A11 have opposite effects on H2O2-induced cell death.
a Protein levels of SLC7A11, SLC7A9, and SLC3A1 in a panel of cancer cell lines. Vinculin was used as the loading control. b Cystine uptake levels in a panel of cancer cell lines. c Protein levels of SLC7A11 (up) and cystine uptake levels (down) in sgCtrl and SLC7A11 knockout T98G cells. d Cell death in response to 1 mM H2O2 treatment (up) or glucose starvation (down) in T98G cells with indicated genotypes for 24 h was measured using PI staining. e Protein levels of SLC7A11 (up) and cystine uptake levels (down) in shCtrl and SLC7A11 knockdown T98G cells. f Cell death in response to 1 mM H2O2 treatment (up) or glucose starvation (down) in T98G cells with indicated genotypes for 24 h was measured using PI staining. g Protein levels of SLC7A11 (up) and cystine uptake levels (down) in sgCtrl and SLC7A11 knockout Hs578T cells. h Cell death in response to 1 mM H2O2 treatment (up) or glucose starvation (down) in Hs578T cells with indicated genotypes for 24 h was measured using PI staining. i Protein levels of SLC7A11 (up) and cystine uptake levels (down) in shCtrl and SLC7A11 knockdown Hs578T cells. j Cell death in response to 1 mM H2O2 treatment (up) or glucose starvation (down) in Hs578T cells with indicated genotypes for 24 h was measured using PI staining. k Protein levels of SLC7A11 (up) and cystine uptake levels (down) in SLC7A11-low, -moderate, and -high H1299 cells. l Cell death in response to 1 mM H2O2 treatment (left) or glucose starvation (right) for 20 h in SLC7A11-low, -moderate, and -high H1299 cells was measured using PI staining. m Protein levels of SLC7A11 (up) and corresponding cystine uptake levels (down) in SLC7A11-low, -moderate, and -high 786-O cells. n Cell death in response to 1 mM H2O2 treatment (left) or glucose starvation (right) in SLC7A11-low, -moderate, and -high 786-O cells for 20 h measured using PI staining. Data were presented as mean ± SD; n  =  3. n indicates independent repeats. P value was determined by two-tailed unpaired Student’s t test. Source data are provided as a Source Data file.
Fig. 2
Fig. 2. High SLC7A11 expression leads to marked increases in intracellular disulfide molecules under H2O2 treatment.
ae Measurement of intracellular concentrations of cystine (a), cysteine (b), GSH (c), GSSG (d), and the GSSG/GSH ratio (e) in SLC7A11-low, -moderate, and -high 786-O cells treated with vehicle or 1 mM H2O2 for 2 h. f, g Relative levels of intracellular γ-glutamyl-cystine (f) and γ-glutathionyl-cysteine (g) in SLC7A11-low, -moderate, and -high 786-O cells treated with vehicle or 1 mM H2O2 for 2 h. h, i Measurement of intracellular concentrations of cystine (h) and GSSG (i) in T98G cells treated with vehicle or 1 mM H2O2 for 8 h. j Relative levels of intracellular γ-glutathionyl-cysteine in T98G cells treated with vehicle or 1 mM H2O2 for 8 h. Data were presented as mean ± SD; n  =  3. n indicates independent repeats. P value was determined by two-tailed unpaired Student’s t test. Source data are provided as a Source Data file.
Fig. 3
Fig. 3. Blocking cystine uptake and resolving disulfide stress suppress high SLC7A11–induced cell death under H2O2 treatment.
ac Measurement of intracellular concentrations of cystine (a), GSSG (b), and the GSSG/GSH ratio (c) in SLC7A11-low 786-O cells treated with vehicle or 1 mM H2O2 for 2 h and SLC7A11-high 786-O cells treated with vehicle or 1 mM H2O2 for 2 h with or without 5 μM erastin, 1 mM tris(2-carboxyethyl) phosphine (TCEP), 1 mM 2-mercaptoethanol (2-ME), 2 mM N-acetyl cysteine (NAC), 2 mM d-penicillamine (D-Pen), or 2 mM l- penicillamine (L-Pen). d, e Relative levels of intracellular γ-glutamyl-cystine (d) and γ-glutathionyl-cysteine (e) in SLC7A11-low 786-O cells treated with vehicle or 1 mM H2O2 for 2 h and SLC7A11-high 786-O cells treated with vehicle or 1 mM H2O2 for 2 h with or without 5 μM erastin, 1 mM TCEP, 1 mM 2-ME, 2 mM NAC, 2 mM d-penicillamine, or 2 mM l-penicillamine. fk Cell death in response to 1 mM H2O2 treatment for 6 h with or without 5 μM erastin (f), 1 mM TCEP (g), 1 mM 2-ME (h), 2 mM NAC (i), 2 mM d-penicillamine (j), or 2 mM l-penicillamine (k) in SLC7A11-high 786-O cells measured using propidium iodide (PI) staining. lq Cell death in response to 1 mM H2O2 treatment for 24 h with or without 5 μM erastin (l), 1 mM TCEP (m), 1 mM 2-ME (n), 2 mM NAC (o), 2 mM d-penicillamine (p), or 2 mM l-penicillamine (q) in T98G cells measured using PI staining. Data were presented as mean ± SD; n = 3. n indicates independent repeats. P value was determined by two-tailed unpaired Student’s t test. Source data are provided as a Source Data file.
Fig. 4
Fig. 4. NADPH consumption contributes to the increased sensitivity to H2O2 in SLC7A11-high cancer cells.
a Measurement of the NADP+/NADPH ratio in SLC7A11-low, -moderate, and -high 786-O cells treated with vehicle or 1 mM H2O2 at the indicated time points. b Measurement of the NADP+/NADPH ratio in shCtrl and SLC7A11 knockdown T98G cells treated with vehicle or 1 mM H2O2 for 2 h. c Measurement of the NADP+/NADPH ratio in SLC7A11-high 786-O cells co-treated 1 mM H2O2 and 5 μM erastin or 10 μM sulfasalazine. d, e Measurement of the NADP+/NADPH ratio in T98G cells co-treated with 1 mM H2O2 and 5 μM erastin (d) or 10 μM sulfasalazine (SAS) (e). f Protein levels of GPX1 in SLC7A11-low and -high 786-O cells were measured using western blotting. Vinculin was used as the loading control. g Cell death in response to treatment with 1 mM H2O2 for 6 h in sgCtrl or sgGPX1 infected SLC7A11-low and -high 786-O cells measured using PI staining. hj Measurement of the NADP + /NADPH ratio (h), relative GSSG level (i), and GSSG/GSH ratio (j) in sgCtrl or sgGPX1 infected SLC7A11-low and -high 786-O cells. k Protein levels of Flag-triphosphopyridine nucleotide oxidase (TPNOX) in SLC7A11-low and -high 786-O cells. Vinculin was used as the loading control. l Measurement of the NADP+/NADPH ratio in SLC7A11-low and -high 786-O cells with empty vector (EV) or TPNOX overexpression under vehicle or 1 mM H2O2 treatment. m Cell death in response to treatment with 1 mM H2O2 for 6 h in SLC7A11-low and -high 786-O cells with EV or TPNOX overexpression measured using PI staining. n Cell death in response to treatment with 1 mM H2O2 treatment or glucose (Glc-) starvation for 6 h with or without 2 mM 2-deoxyglucose (2-DG) in SLC7A11-high 786-O cells measured using PI staining. o Cell death in response to treatment with 1 mM H2O2 or glucose starvation for 24 h with or without 2 mM 2-DG in T98G cells measured using PI staining. Data were presented as mean ± SD; n  =  3. n indicates independent repeats. P value was determined by two-tailed unpaired Student’s t test. n.s. not significant. Source data are provided as a Source Data file.
Fig. 5
Fig. 5. High overexpression of SLC7A11 promotes primary tumor growth but suppresses tumor metastasis.
a Measurement of tumor volumes of indicated 786-O xenograft tumors after subcutaneous injection (n  =  8 mice). b Schematic showing the method of intracardiac injection in mice. c Quantification of photon flux (photons per second) in mice normalized to day 0 after intracardiac injection of indicated 786-O cells (n = 9 mice). d Images of bioluminescence in mice 5 weeks after intracardiac injection of indicated 786-O cells (left) and statistical analysis of the whole-body photon flux (photons per second) (right) (n = 9 mice). e Representative images of liver metastasis from SLC7A11-low, -moderate, and -high 786-O cells. f Representative images of hematoxylin and eosin (H&E) and immunohistochemical staining (SLC7A11) of livers with tumor metastasis derived from indicated 786-O cells. Scale bars, 20 μm. “T” stands for tumor cells. g Quantification of photon flux in mice normalized to day 0 after intracardiac injection of SLC7A11-low 786-O cells with PBS and -high 786-O cells treated with PBS, NAC, or Trolox (n = 4 mice for Low + PBS and High + Trolox groups, n = 5 mice for High + PBS and High + NAC groups). h Quantification of photon flux in mice normalized to day 0 after intracardiac injection of indicated H1299 cells (n = 7 mice). i Images of bioluminescence in mice 30 min after intracardiac injection of indicated H1299 cells (left) and statistical analysis of whole-body photon flux (right). (n = 7 mice). j Representative images of liver metastasis from SLC7A11-low, -moderate, and -high H1299 cells. k Analysis of SLC7A11 expression levels between breast primary tumors and circulating tumor cells (CTCs) from matched patients with stage II-III breast cancer (GSE111842; n = 12 for primary tumors and n = 16 for CTCs). l Analysis of SLC7A11 expression in estrogen receptor–positive (ER+) breast primary tumors (PTs; from The Cancer Genome Atlas) and CTCs (GSE75367 and GSE86978; n = 1015 for PTs and n = 99 for CTCs). Data were presented as mean ± SD. P value was determined by two-tailed unpaired Student’s t test. n.s. not significant. Source data are provided as a Source Data file.
Fig. 6
Fig. 6. Working model depicting how different expression levels of SLC7A11 dictate differential responses to oxidative stress in cancer cells.
a SLC7A11 imports cystine into cells to produce GSH, which can detoxify H2O2. However, both the reduction of cystine to cysteine and that of GSSG to GSH consume NADPH. b In cells with moderate expression of SLC7A11, the beneficial effect of GSH to detoxify H2O2 appears to be stronger than the NADPH-depleting effect of cystine reduction, resulting in decreased sensitivity to H2O2. c In cells with high expression of SLC7A11 and high cystine uptake, H2O2 treatment leads to drastic accumulation of intracellular cystine and other disulfide molecules and NADPH depletion, which overrides the beneficial effect of GSH and triggers rapid disulfidptosis. This explains the increased sensitivity to H2O2 in SLC7A11-high cells. NADPH nicotinamide adenine dinucleotide phosphate, GSH reduced glutathione, GSSG glutathione disulfide.

References

    1. Combs JA, DeNicola GM. The non-essential amino acid cysteine becomes essential for tumor proliferation and survival. Cancers (Basel) 2019;11:678. - PMC - PubMed
    1. Bonifacio VDB, Pereira SA, Serpa J, Vicente JB. Cysteine metabolic circuitries: druggable targets in cancer. Br. J. Cancer. 2021;124:862–879. - PMC - PubMed
    1. Chio IIC, Tuveson DA. ROS in cancer: the burning question. Trends Mol. Med. 2017;23:411–429. - PMC - PubMed
    1. Tasdogan A, Ubellacker JM, Morrison SJ. Redox regulation in cancer cells during metastasis. Cancer Discov. 2021;11:2682–2692. - PMC - PubMed
    1. Hayes JD, Dinkova-Kostova AT, Tew KD. Oxidative stress in cancer. Cancer Cell. 2020;38:167–197. - PMC - PubMed

Publication types

MeSH terms