. 2023 Jun 20;14(1):3659.
doi: 10.1038/s41467-023-39436-y.

The vacuolar iron transporter mediates iron detoxification in Toxoplasma gondii

Affiliations

The vacuolar iron transporter mediates iron detoxification in Toxoplasma gondii

Dana Aghabi et al. Nat Commun. .

Abstract

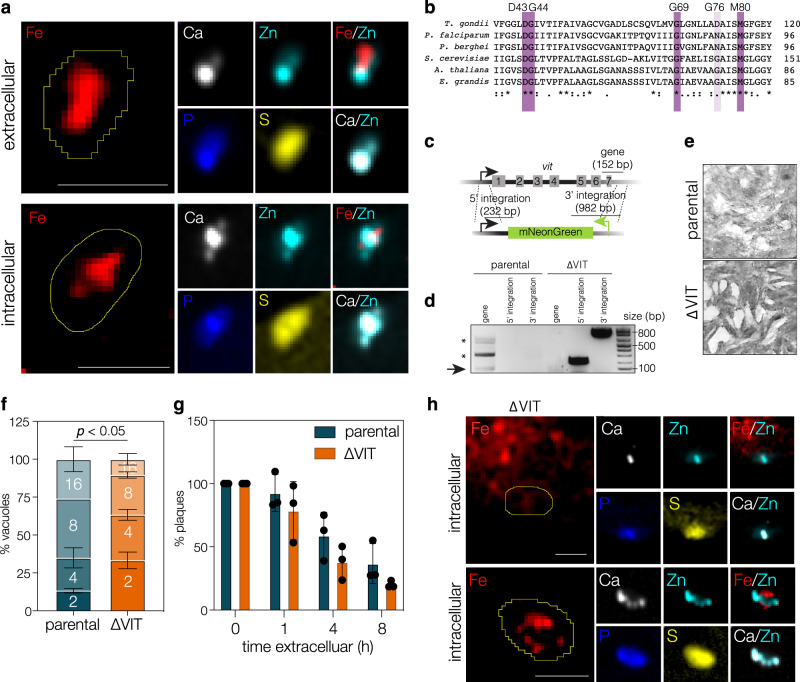
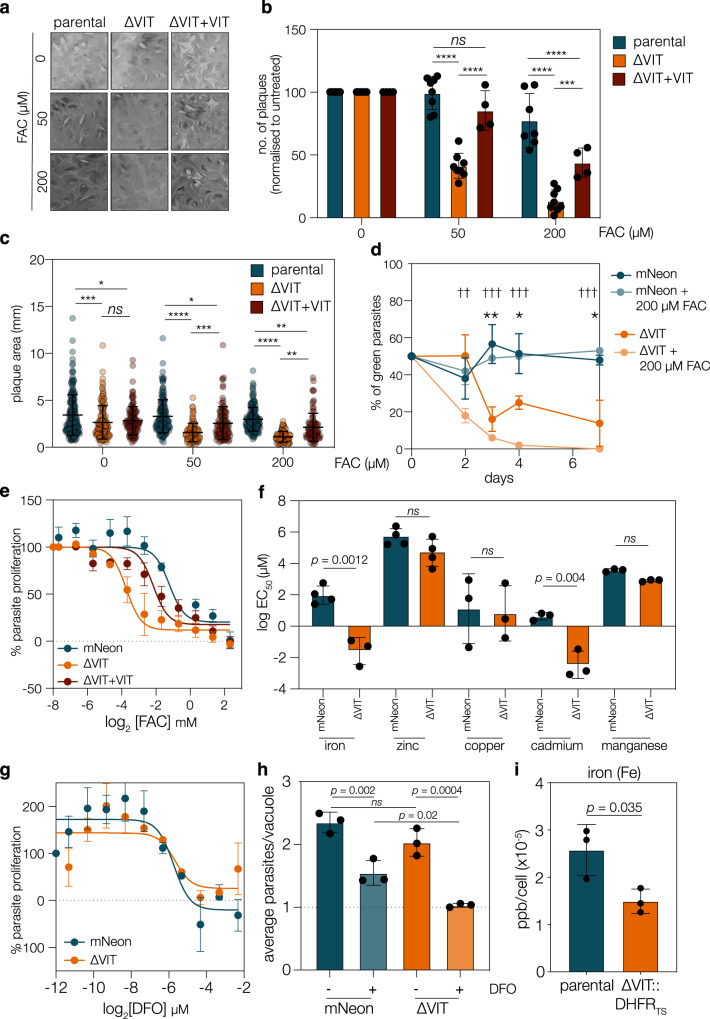
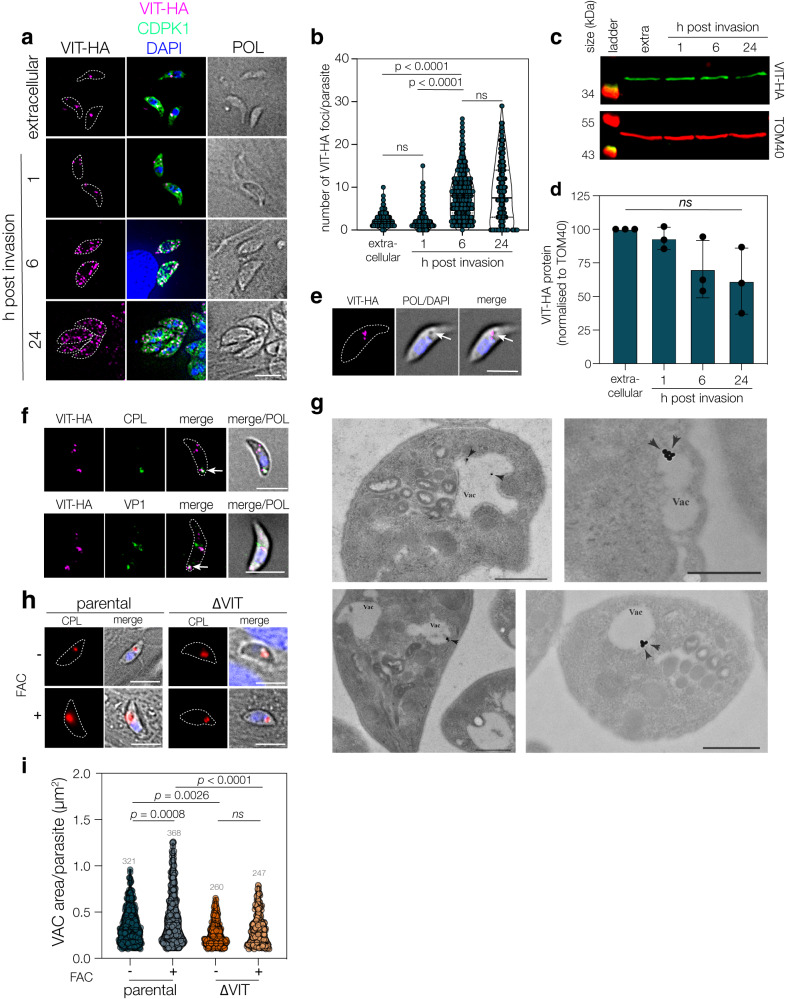
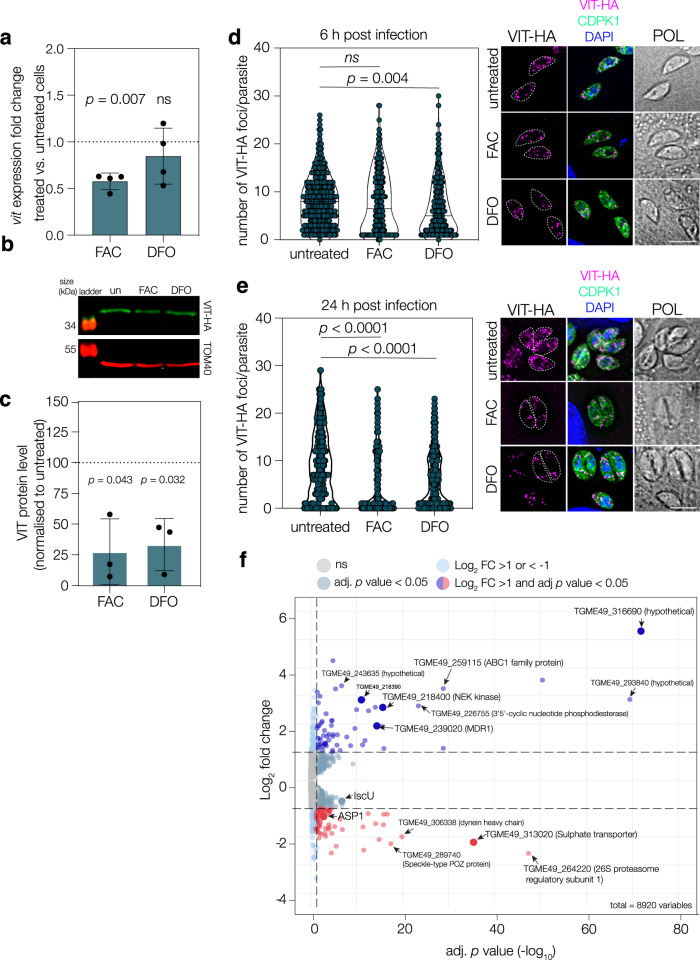
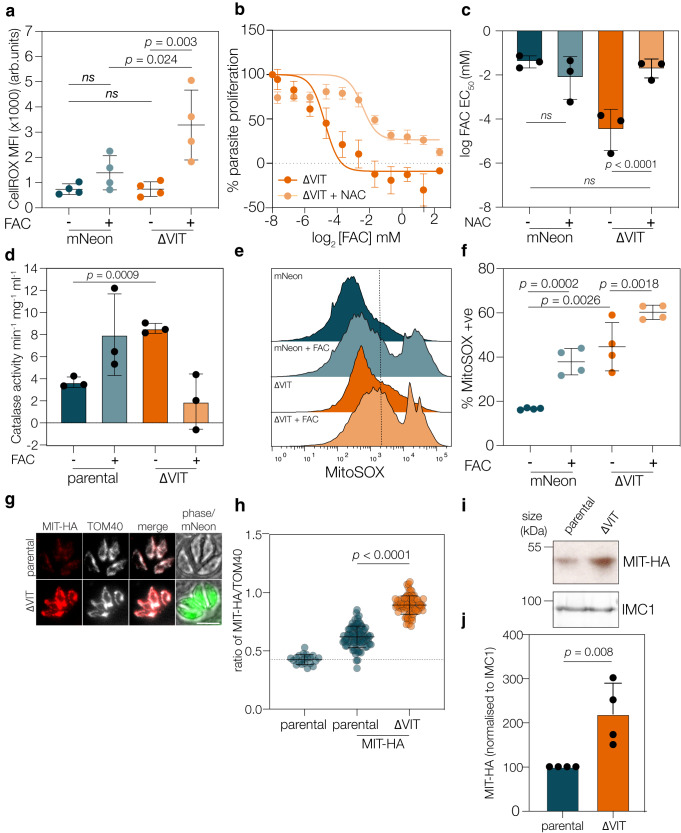
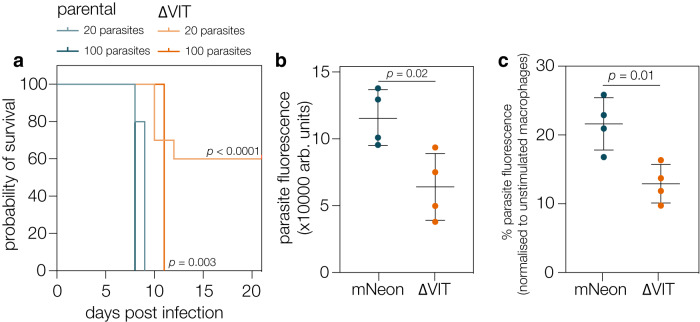
Iron is essential to cells as a cofactor in enzymes of respiration and replication, however without correct storage, iron leads to the formation of dangerous oxygen radicals. In yeast and plants, iron is transported into a membrane-bound vacuole by the vacuolar iron transporter (VIT). This transporter is conserved in the apicomplexan family of obligate intracellular parasites, including in Toxoplasma gondii. Here, we assess the role of VIT and iron storage in T. gondii. By deleting VIT, we find a slight growth defect in vitro, and iron hypersensitivity, confirming its essential role in parasite iron detoxification, which can be rescued by scavenging of oxygen radicals. We show VIT expression is regulated by iron at transcript and protein levels, and by altering VIT localization. In the absence of VIT, T. gondii responds by altering expression of iron metabolism genes and by increasing antioxidant protein catalase activity. We also show that iron detoxification has an important role both in parasite survival within macrophages and in virulence in a mouse model. Together, by demonstrating a critical role for VIT during iron detoxification in T. gondii, we reveal the importance of iron storage in the parasite and provide the first insight into the machinery involved.


Conflict of interest statement

The authors declare no competing interests.

Figures

Fig. 1
Fig. 1. Iron localisation and construction and analysis of a ΔVIT parasite line.
a X-ray fluorescence microscopy of extracellular and intracellular T. gondii. Limited overlap between Fe and Zn was observed, however overlap between Zn, Ca and P was observed in both intracellular and extracellular parasites. Numbers indicate Pearson’s correlation between channels. Line indicates the outline of the parasites. Representative of 3-4 parasites. Scale bar 5 μm. b Alignment of VIT using Clustal Omega from T. gondii (TGGT1_266800), P. falciparum (PF3D7_1223700), P. berghei (PBANKA_1438600), S. cerevisiae (ScCCC1), A. thaliana (AtVIT1) and E. grandis (EgVIT1). Identity (*) and similarity (.,:) indicated. Key conserved residues for iron binding highlighted in purple. c Schematic indicating the method used to replace the endogenous vit gene with the mNeonGreen cassette. d PCR reactions confirming the replacement of the endogenous gene, expected sizes indicated on schematic. *represents secondary bands, possibly unspecific. e Plaque assay demonstrating that the ΔVIT line is viable. Representative of two independent experiments. f Quantification of number of parasites/vacuole at 24 h post infection. Results are the mean of n = 3 independent biological replicates, ±SD. p value from multiple two tailed t tests, corrected by Holm-Sidak, p = 0.0005 at 2-cell stage and p = 0.0037 at 8-cell stage. g Quantification of extracellular survival, normalised to 0 h. Bars are the mean of n = 3 independent biological replicates, ±SD. h X-ray fluorescence microscopy examining elemental composition of intracellular ΔVIT parasites. No change was seen in Zn, Ca, P or S in ΔVIT cells compared to intracellular parental parasites, however, Fe appeared potentially mislocalised. Numbers indicate Pearson’s correlation between channels. Line indicates the outline of the parasites. Representative of 3–4 parasites. Scale bar 5 μm.
Fig. 2
Fig. 2. ΔVIT parasites are more susceptible to iron overload.
a Plaque assay with indicated concentrations of FAC (ferric ammonium chloride). ΔVIT parasites more susceptibile to exogenous iron, somewhat complemented by re-expression of VIT. b Quantification of number of plaques (normalised to the untreated) for parental, ΔVIT and ΔVIT + VIT parasites after 0, 50 or 200 μM FAC treatment. Results from 3 (ΔVIT + VIT), 6 (ΔVIT) or 8 (parental) independent experiments, bar at mean ± SD, p values from two-way ANOVA, Tukey corrected for multiple comparisons. ***p = 0.0002, ****p < 0.0001. c Plaque area for experiments above, p values from one-way ANOVA, Tukey corrected for multiple comparisons d tdTomato parasites were mixed with mNeon and ΔVIT parasites in a 1:1 ratio and untreated or treated with 200 μM FAC. ΔVIT parasites were significantly outcompeted by 3 days post infection, or 2 days in the presence of excess iron. Points are the mean of n = 4, ±SD. **p = 0.001 **p = 0.003, ***p = 0.0006, t test between mNeon and ΔVIT, †† p = 0.001, ††† p < 0.0001, t test between mNeon +200 μM FAC and ΔVIT + 200 μM FAC, all two tailed t test, corrected for multiple comparisons by two-stage step-up (Benjamini, Krieger, and Yekutieli) e Dose-response curve showing ΔVIT parasites more sensitive to FAC that the parental, complemented line shows partial rescue. Points are the mean of n = 4 (mNeon) or 3 (ΔVIT and ΔVIT + VIT) independent experiments, ± SEM. f Graph showing mean EC50 for indicated metals for mNeon and ΔVIT parasites, each point represents a biological replicate, performed in triplicate. Bars at mean, ±SD. p values from two tailed t test. g ΔVIT parasites did not show any significant change in the EC50 upon DFO treatment. Results are n = 3, ± SEM. h mNeon and ΔVIT parasites were allowed to invade HFF cells untreated, or pretreated with DFO for 24 h. At 14 h post invasion, average parasite/vacuole were quantified. Results mean of n = 3 ± SD, at least 100 vacuoles counted/experiment. p values from one way ANOVA with Holm-Sidak correction. i ICP-MS quantification from parental and ∆VIT::DHFRTS parasites. Bars are at the mean of n = 3, ±SD, p value from two tailed t test.
Fig. 3
Fig. 3. VIT has a dynamic localisation which alters through the lytic cycle.
a IFA of VIT-HA showing a dynamic localisation through the lytic cycle, VIT-HA exists at a single point in extracellular and 1 h post-invasion parasites before fragmenting at 6–24 h post invasion to a few small foci throughout the parasite. POL polarised light. Scale bar 5 μm. b Violin plot of number of foci/parasite from 3 independent replicates, 100 parasites/replicate. Bars at mean and quartiles. p values from one way ANOVA with Holm-Sidak correction. c Western blot showing VIT-HA at indicated time points, TOM40 used as a loading control. d Quantification of VIT-HA levels from three independent experiments, bar at mean ± SD, ns no significant change. e Extracellular VIT-HA parasites demonstrating co-localisation of VIT-HA with a vacuole visible by phase contrast (arrow). Representative of two independent experiments. Scale bar 5 μm. f VIT-HA overlaps with the PLVAC markers CPL and VP1 in extracellular parasites. Representative of three independent experiments. g Extracellular VIT-HA parasites imaged by immunoelectron microscopy. VIT-HA signal was frequently seen at the vacuole (VAC). Scale bar 500 nm. Representative of two independent experiments. h Parental and ΔVIT parasites, allowed to invade and treated for 1 h with excess FAC, were stained with anti-CPL, a marker for the VAC. Parental, but not ΔVIT parasites showed a swelling of the VAC. Scale bar 5 μm. i Violin plot of area of the PLVAC (as assessed by CPL staining) from the above experiment. Results of two independent replicates, n parasites indicated above plot, bar at mean ± quartiles. p values from one way ANOVA with Holm-Sidak correction.
Fig. 4
Fig. 4. VIT expression is regulated by the changes in iron levels.
a qRT PCR on vit transcripts after treatment with FAC or DFO, normalised to actin. Points represent 4 independent experiments, bars at mean ± SD. p values from two tailed one sample t-test. b Western blot showing levels of VIT-HA after 24 h treatment with 100 μM DFO or 5 mM FAC. TOM40 used as a loading control. c Quantification of VIT-HA levels from three independent experiments, bar at mean ± SD, p values from one sample two tailed t test. d VIT-HA foci at 6 h post invasion after treatment with FAC or DFO. There was no significant change upon FAC treatment, however, there was a significant decrease in the number of foci upon DFO treatment. POL polarised light. Results from 3 independent experiments, n = 300 parasites. p values from one way ANOVA with Tukey correction. e As above, but quantified at 24 h post invasion. There was a significant decrease in the number of foci after treatment with both FAC and DFO, p values from one way ANOVA with Tukey correction. Results from 3 independent experiments, n = 300 parasites. p values from one way ANOVA with Tukey correction. f Volcano plot from RNAseq data comparing the parental line to ΔVIT. Adjusted p values from Wald test with Benjamini and Hochberg correction. See text for more details.
Fig. 5
Fig. 5. Iron overload in absence of VIT leads to ROS accumulation.
a mNeon and ΔVIT parasites were treated with FAC and CellROX Deep Red fluorescence quantified using flow cytometry. FAC-treated parental cells had no significant effect on CellROX fluorescence, however, in ΔVIT parasites, CellROX was significantly (p = 0.004, one way ANOVA with Sidak correction) increased. Each point represents geometric mean fluorescence of over 10,000 cells from n = 4, ns not significant. Bars are at mean, ±SD. b Treatment with NAC (5 mM) rescued ΔVIT parasite hypersensitivity to FAC. Points are the mean of n = 3, ±SEM. c Graph showing the mean EC50 for FAC of mNeon and ΔVIT parasites, with or without NAC treatment. Each point represents an individual experiment, bars at the mean of n = 3, ±SD. p values from two sided extra sum of square F test. d ΔVIT parasites had significantly higher catalase activity compared to the parental line. Each point represents an independent experiment, n = 3, bar at mean ± SD. p value from one way ANOVA with Sidak correction. e mNeon and ΔVIT parasites were treated as in (a), and MitoSOX fluorescence quantified. Overlapping histogram from a single experiment showing change in fluorescence distribution. f Percentage of cells MitoSOX positive from four independent experiments, bars at the mean ± SD. p value from one way ANOVA with Tukey correction. g Immunofluorescence showing localisation and expression of parental and ΔVIT parasites endogenously expressing MIT-HA. Scale bar 5 um. h Quantification of MIT-HA signal as a ratio of TOM40. Points represent individual vacuoles from n = 3, bar at mean ± SD. p value from one way ANOVA with Tukey correction. i Western blot confirming the increased expression of MIT-HA in the ΔVIT parasites compared to the parental line, IMC1 used as loading control. Representative of 4 independent experiments. j Quantification of MIT-HA expression, normalised to loading control. Bar at mean ± SD, n = 3 individual biological replicates. p value from two tailed one sample t test.
Fig. 6
Fig. 6. VIT contributes to parasite survival in macrophages and for pathogenesis in vivo.
a 10 mice were infected with 20 or 100 tachyzoites of the indicated strain and survival monitored over the course of the experiment. p values from Log-rank (Mantel–Cox) test. b mNeon and ΔVIT parasites were used to infect macrophages at an MOI of 5 and fluorescence (arbitrary units) monitored after 72 h. Results are the mean of n = 4 independent biological replicates, performed in triplicate, ±SD. p values from two tailed t test. c After normalisation of the fluorescence in the unstimulated macrophages (from b) there was a significant decrease in survival of the ΔVIT parasites in stimulated (IFNy/LPS) macrophages. Results are the mean of n = 4 independent biological replicates, performed in triplicate, ±SD. p values from two tailed t test.

References

    1. Stelzer S, et al. Toxoplasma gondii infection and toxoplasmosis in farm animals: Risk factors and economic impact. Food Waterborne Parasitol. 2019;15:e00037. doi: 10.1016/j.fawpar.2019.e00037. - DOI - PMC - PubMed
    1. Al-sandaqchi AT, et al. Metallome of cerebrovascular endothelial cells infected with Toxoplasma gondii using μ-XRF imaging and inductively coupled plasma mass spectrometry. Metallomics. 2018;10:1401–1414. doi: 10.1039/C8MT00136G. - DOI - PubMed
    1. Kloehn J, Harding CR, Soldati-Favre D. Supply and demand—heme synthesis, salvage and utilization by Apicomplexa. FEBS J. 2021;288:382–404. doi: 10.1111/febs.15445. - DOI - PubMed
    1. Bergmann A, et al. Toxoplasma gondii requires its plant-like heme biosynthesis pathway for infection. PLOS Pathog. 2020;16:e1008499. doi: 10.1371/journal.ppat.1008499. - DOI - PMC - PubMed
    1. Aw YTV, et al. A key cytosolic iron–sulfur cluster synthesis protein localizes to the mitochondrion of Toxoplasma gondii. Mol. Microbiol. 2021;115:968–985. doi: 10.1111/mmi.14651. - DOI - PubMed

Publication types

Substances