. 2023 Jun 20;14(1):3660.
doi: 10.1038/s41467-023-39202-0.

Imputation of ancient human genomes

Affiliations

Imputation of ancient human genomes

Bárbara Sousa da Mota et al. Nat Commun. .

Abstract

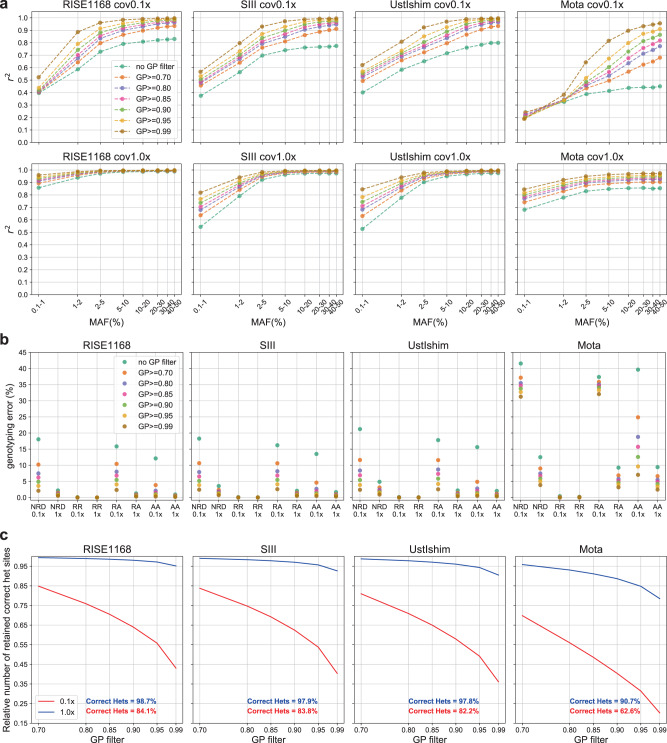
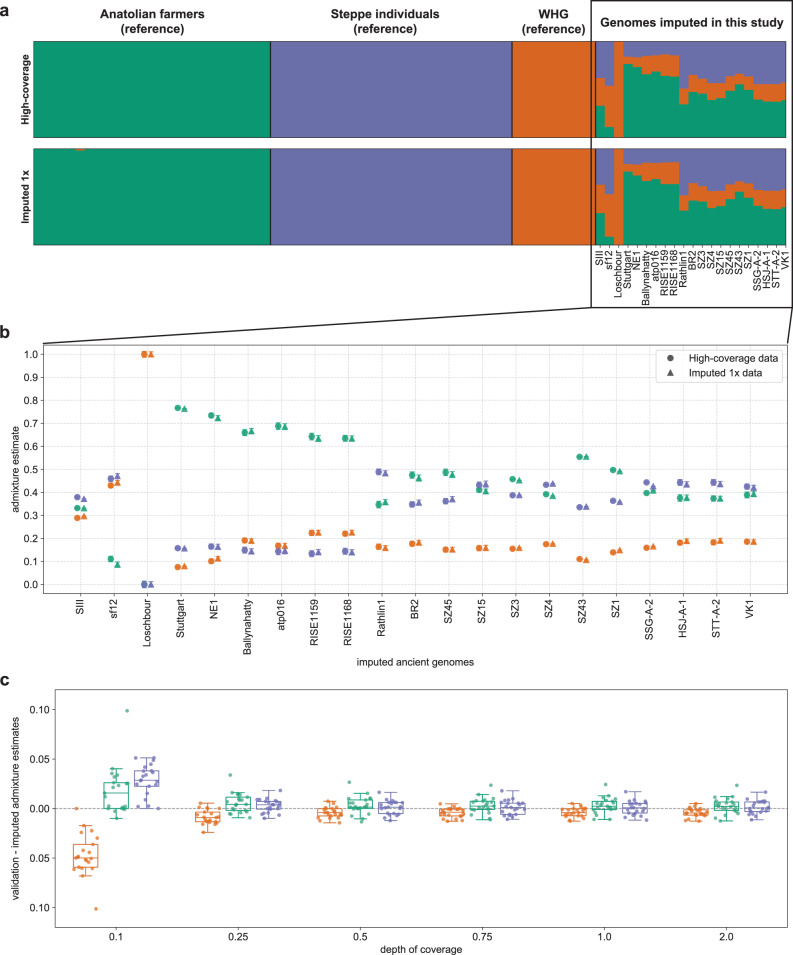
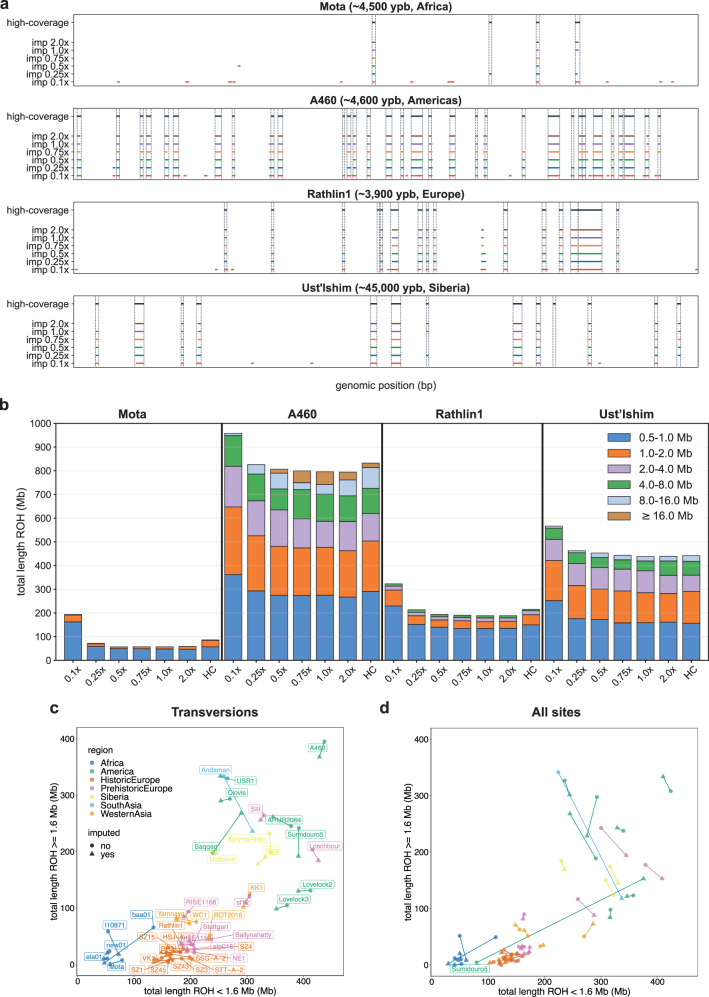
Due to postmortem DNA degradation and microbial colonization, most ancient genomes have low depth of coverage, hindering genotype calling. Genotype imputation can improve genotyping accuracy for low-coverage genomes. However, it is unknown how accurate ancient DNA imputation is and whether imputation introduces bias to downstream analyses. Here we re-sequence an ancient trio (mother, father, son) and downsample and impute a total of 43 ancient genomes, including 42 high-coverage (above 10x) genomes. We assess imputation accuracy across ancestries, time, depth of coverage, and sequencing technology. We find that ancient and modern DNA imputation accuracies are comparable. When downsampled at 1x, 36 of the 42 genomes are imputed with low error rates (below 5%) while African genomes have higher error rates. We validate imputation and phasing results using the ancient trio data and an orthogonal approach based on Mendel's rules of inheritance. We further compare the downstream analysis results between imputed and high-coverage genomes, notably principal component analysis, genetic clustering, and runs of homozygosity, observing similar results starting from 0.5x coverage, except for the African genomes. These results suggest that, for most populations and depths of coverage as low as 0.5x, imputation is a reliable method that can improve ancient DNA studies.


Conflict of interest statement

The authors declare no competing interests.

Figures

Fig. 1
Fig. 1. Methodology and individual samples’ origin and age.
a Overview of the procedure we followed., b Geographical origin and age in years before present (ybp) of the 43 individual samples used in this study as well as the different populations represented in the 1000 Genomes reference panel (ACB: African Caribbean in Barbados, ASW: African ancestry in Southwest USA, BEB: Bengali from Bangladesh, CDX: Chinese Dai in Xishuangbanna, China, CEU: Utah residents with Northern and Western European ancestry, CHB: Han Chinese in Beijing, China, CHS: Southern Han Chinese, CLM: Colombian in Medellin, Colombia, ESN: Esan in Nigeria, FIN: Finnish in Finland, GBR: British in England and Scotland, GIH: Gujarati Indian from Houston, Texas, GWD: Gambian in Western Divisions in the Gambia, IBS: Iberian populations in Spain, ITU: Indian Telugu from the UK, JPT: Japanese in Tokyo, Japan, KHV: Kinh in Ho Chi Minh City, Vietnam, LWK: Luhya in Webuye, Kenya, MSL: Mende in Sierra Leone, MXL: Mexican ancestry in Los Angeles, California, PEL: Peruvian in Lima, Peru, PJL: Punjabi from Lahore, Pakistan, PUR: Puerto Rican in Puerto Rico, STU: Sri Lankan Tamil from the UK, TSI: Toscani in Italy, YRI: Yoruba in Ibadan, Nigeria). WGS: whole genome sequencing; DoC: depth of coverage; PC: principal component; ROH: runs of homozygosity. Made with Natural Earth. Free vector and raster map data @naturalearthdata.com.
Fig. 2
Fig. 2. Imputation quality assessment for 1x ancient genomes and genetic distance to 1000 Genomes reference panel.
a Imputation accuracy (r2) as a function of minor allele frequency (MAF) for the 42 high-coverage genomes together downsampled to different depths of coverage (top left) and for individual 1x genomes (remaining plots). Depending on ancestry, MAF was specified from the reference populations expected to be closer to the individual in question, whenever possible, as listed in Supplementary Table 1. Individuals were put in categories that roughly reflect their place of origin and/or time. b Allelic pairwise differences between each ancient high-coverage genome (x-axis) and each of the 2504 individuals in 1000 Genomes reference panel, colored by continental group. c Resulting non-reference discordance (NRD) from imputing 42 ancient genomes downsampled to 1x. In plots b and c, individual samples are ordered by sample age within each category (oldest to the left).
Fig. 3
Fig. 3. Imputation and phasing accuracy for the Koszyce trio.
a Mendel error rate across the 22 autosomes is counted when the parental and offspring genotypes violate Mendel transmission rules, excluding sites at which all three non-imputed genomes are REF/REF. b Switch error rates averaged over the three genomes. A switch error is counted between two consecutive heterozygous genotypes when the reported haplotypes are not consistent with those derived from the trio.
Fig. 4
Fig. 4. Effects of applying different thresholds when filtering for genotype probability (GP) in the case of four imputed 1x ancient genomes (RISE1168, , SIII, Ust’-Ishim and Mota).
a Imputation accuracy. b Genotype discordance between imputed and non-imputed genomes for homozygous reference allele (RR), heterozygous (RA) and homozygous alternative allele (AA) sites, and also the non-reference discordance (NRD). c Proportion of correctly imputed heterozygous sites retained for 0.1x and 1.0x data for each of the four genomes. The percentage of correctly imputed heterozygous sites for 0.1x and 1.0x before GP filtering are represented in red and blue, respectively, in (c).
Fig. 5
Fig. 5. Imputation accuracy, r2, as a function of minor allele frequency (MAF) for three genomes sequenced with a 1240k capture.
From top to bottom: BOT2016, Stuttgart and I10871. We evaluated imputation accuracy at all variant sites in 1000 Genomes (first column), at the intersection of the 1240 K array and the 1000 Genomes panel (second column), and at the sites only found in 1000 Genomes (third column). The capture genomes were downsampled to coverages between 0.1x and 2.0x, as measured on the 1240 K sites.
Fig. 6
Fig. 6. Principal component analysis (PCA) of imputed and high-coverage ancient genetic data, and present-day data in 1000 Genomes reference panel.
a Projections for 1x imputed, high-coverage and present-day data along the first two principal components, where 1000 Genomes individuals are plotted in gray and population labels are shown in the average location of the individuals from the same population, ancient individuals are colored by region and/or epoch, with the high-coverage and imputed individuals represented by full circles and triangles, respectively; the plot on the left contains the coordinates of the whole data set and the plot on the right shows the coordinates of European modern individuals as well as of the European-labeled ancient individuals that cluster with these. b Boxplots (where horizontal lines represent, from bottom to top, the first quartile, the median and the third quartile, and the whiskers lengths are 1.5 times the interquartile range) of the normalized differences in coordinates between validation and corresponding 1x imputed genomes for the first 10 principal components and resulting p values from testing whether differences are significantly different from 0 (n = 42 independent individual samples, two-sided t-test, no adjustments were made for multiple comparison); individual data points are overlaid and colored according to the region and/or epoch as in the previous plot. c −log10 p values obtained when testing whether differences between imputed and validation data are significantly different across the six depths of coverage and for the first four principal components (n = 42 independent individual samples, two-sided t-test, no adjustments were made for multiple comparison); the red dashed line indicates a p value of 0.01.
Fig. 7
Fig. 7. Unsupervised admixture analyses of European ancient individuals with three clustering populations, where Anatolian farmers, Steppe individuals and Western Hunter-Gatherers (WHG) are split into the three clusters.
a Resulting admixture proportions and clusters for the reference and the 21 European individuals in this study, with validation results on top and imputed 1x below. b Admixture estimates for each of the three clusters obtained with imputed 1x (triangles) and validation (full circles) data for each of the 21 individuals, where error bars represent one standard error of the estimates. c boxplots (where horizontal lines represent, from bottom to top, the first quartile, the median and the third quartile, and the whiskers lengths are 1.5 times the interquartile range) of the differences between the values of ancestry components obtained with the high-coverage and imputed data across all depths of coverage (n = 21 independent European individual samples).
Fig. 8
Fig. 8. Runs of homozygosity (ROH) estimates for the high-coverage and corresponding imputed genomes.
a ROH locations in chromosome 10 found using transversions only with high-coverage and imputed genomes, in the case of four ancient individuals, namely, Mota (~4500 ybp (years before present), Africa), A460 (~4600 ybp, Americas), Rathlin1 (~3900 ybp, Europe), Ust’-Ishim (~45,000 ybp, Siberia). b Total length of ROH discriminated by individual ROH length categories, estimated for imputed and high-coverage genomes (HC) using transversion sites for the four aforementioned individuals. c Total length of long (≥1.6 Mb) vs. small (<1.6 Mb) ROH segments for validation (full circles) and 1x imputed (triangles) genomes using transversion sites only and d using transversions and transitions.

References

    1. Briggs AW, et al. Patterns of damage in genomic DNA sequences from a Neandertal. Proc. Natl Acad. Sci. USA. 2007;104:14616–14621. doi: 10.1073/pnas.0704665104. - DOI - PMC - PubMed
    1. Peyrégne S, Prüfer K. Present-day DNA contamination in ancient DNA datasets. BioEssays. 2020;42:1–11. doi: 10.1002/bies.202000081. - DOI - PubMed
    1. Patterson N, et al. Ancient admixture in human history. Genetics. 2012;192:1065–1093. doi: 10.1534/genetics.112.145037. - DOI - PMC - PubMed
    1. Günther, T. & Jakobsson, M. Population genomic analyses of DNA from ancient remains. In: Handbook of Statistical Genomics1, 295–324 (Wiley, 2019).
    1. Ringbauer H, Novembre J, Steinrücken M. Parental relatedness through time revealed by runs of homozygosity in ancient DNA. Nat. Commun. 2021;12:5425. doi: 10.1038/s41467-021-25289-w. - DOI - PMC - PubMed

Publication types