. 2023 Oct;85(7):2356-2385.
doi: 10.3758/s13414-023-02710-8. Epub 2023 Jun 20.

Paradoxical evidence weighting in confidence judgments for detection and discrimination

Affiliations

Paradoxical evidence weighting in confidence judgments for detection and discrimination

Matan Mazor et al. Atten Percept Psychophys. 2023 Oct.

Abstract

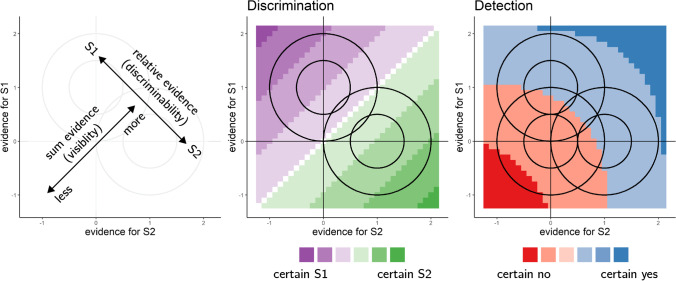
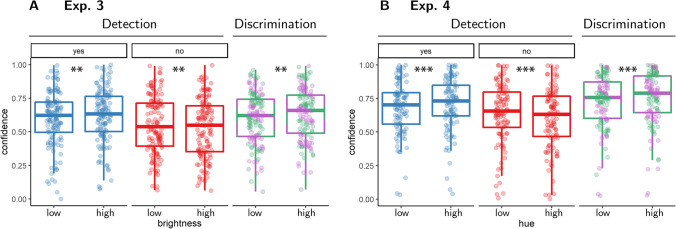
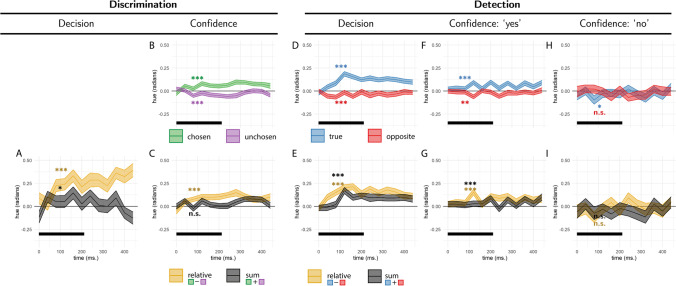
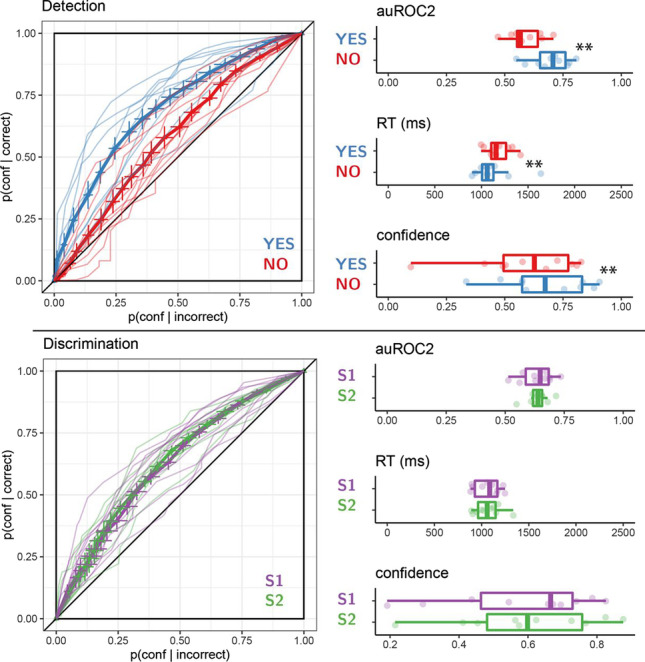
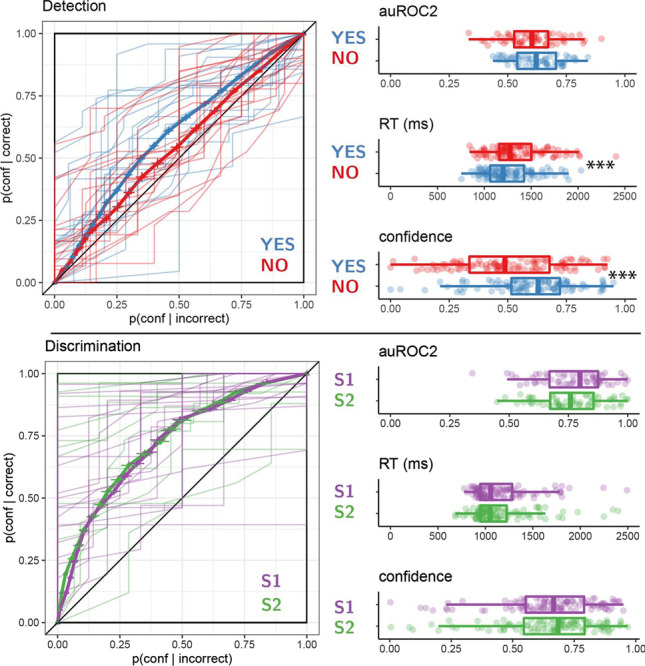
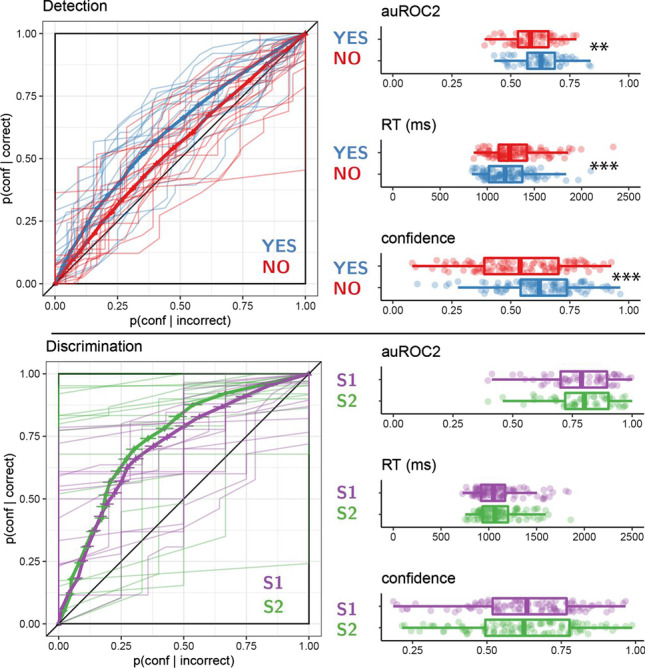
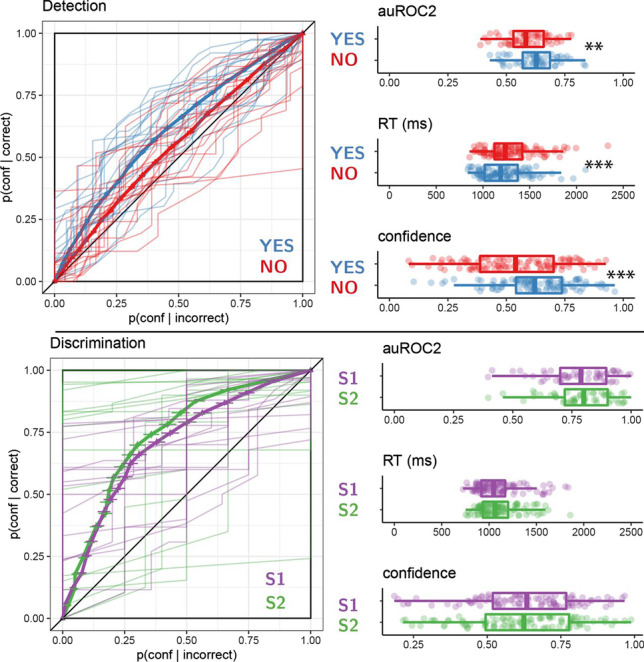
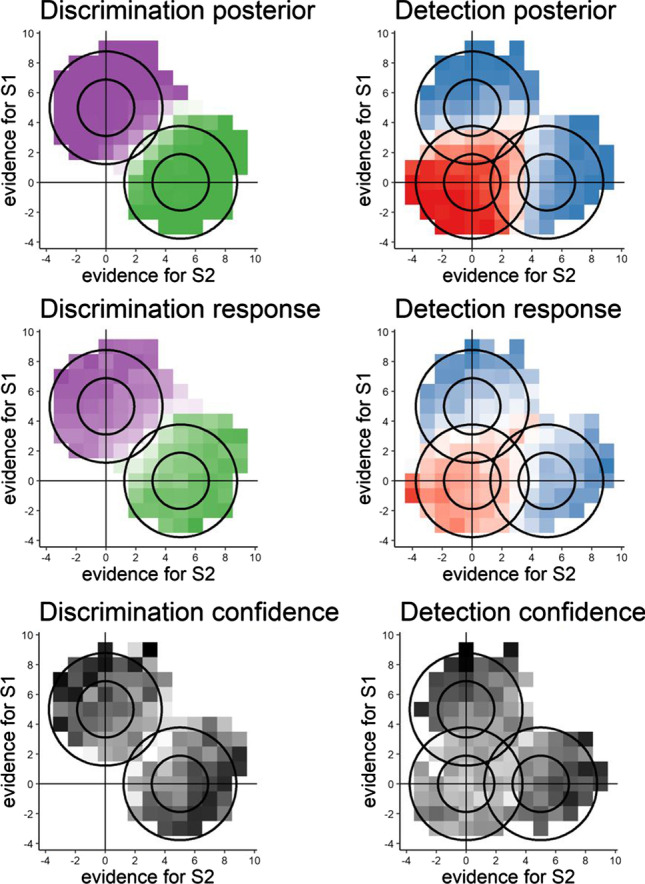
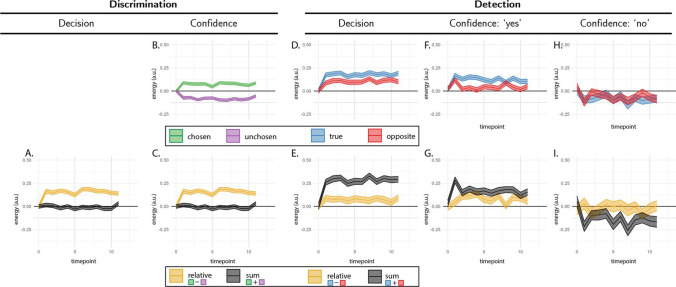
When making discrimination decisions between two stimulus categories, subjective confidence judgments are more positively affected by evidence in support of a decision than negatively affected by evidence against it. Recent theoretical proposals suggest that this "positive evidence bias" may be due to observers adopting a detection-like strategy when rating their confidence-one that has functional benefits for metacognition in real-world settings where detectability and discriminability often go hand in hand. However, it is unknown whether, or how, this evidence-weighting asymmetry affects detection decisions about the presence or absence of a stimulus. In four experiments, we first successfully replicate a positive evidence bias in discrimination confidence. We then show that detection decisions and confidence ratings paradoxically suffer from an opposite "negative evidence bias" to negatively weigh evidence even when it is optimal to assign it a positive weight. We show that the two effects are uncorrelated and discuss our findings in relation to models that account for a positive evidence bias as emerging from a confidence-specific heuristic, and alternative models where decision and confidence are generated by the same, Bayes-rational process.

Keywords: Confidence; Detection; Metacognition.


Conflict of interest statement

The authors have no conflicting interests to declare.

Figures

Fig. 1
Fig. 1
Discrimination and detection in a two-dimensional signal detection theory (SDT) model. Left: In a two-dimensional SDT model, evidence e is sampled from one of two Gaussian distributions (here, centered at [0,1] and [1,0]). We define relative evidence as eS1 − eS2 and sum evidence as eS1 + eS2. Circles represent contours of two-dimensional distributions. Center and Right: Decision and confidence accuracy are maximized when based on a log-likelihood ratio for the two stimulus categories. Center: In discrimination, this yields optimal decision and confidence criteria that are based on relative evidence (distance from the main diagonal), irrespective of sum evidence. Right: In detection, this yields optimal decision and confidence that are based on a nonlinear interaction between relative and sum evidence. The third circle centred at (0,0) represents the two-dimensional distribution of percepts in the absence of stimuli. (Colour figure online)
Fig. 2
Fig. 2
Computational models. Upper panel: True world model. Stimuli span 12 time points, each comprising values from two sensory channels (here, presented as luminance values). In discrimination blocks, values in one channel are sampled from the noise distribution (red), and values in the other channel are sampled from the signal distribution (blue). In detection blocks, on half of the trials, all values are sampled from the noise distribution (red). Vanilla model: On each time point, participants perceive both channels, corrupted by sensory noise that is sampled from a normal distribution. They then update their beliefs accordingly. Firing rate model: Sensory samples are sampled from a Poisson distribution. Random attention model: Agents only attend one channel at a time. The attended channel is chosen at random per time point, with a strong bias which is consistent within a trial. Goal-directed attention model: Channels that are likely to include signal (as determined by previous samples) are more likely to be attended. (Colour figure online)
Fig. 3
Fig. 3
Simulated predictions for the reverse correlation analysis, derived from the four models. A Effects of relative (orange markers) and sum (black markers) evidence on discrimination decisions. B Effects of evidence for the chosen (green markers) and unchosen (purple markers) alternatives on discrimination confidence. C Effects of sum and relative evidence (defined with respect to participants’ decisions) on discrimination confidence. D, F, and H Effects of evidence in the signal channel (blue markers) and in the nonsignal channel (red markers) on detection decisions, confidence in yes responses, and confidence in no responses, respectively. E, G, and I Effects of relative evidence (orange markers) and sum evidence (black markers) on detection decisions, confidence in yes responses, and confidence in no responses, respectively. For scale, grid lines are plotted in common arbitrary units
Fig. 4
Fig. 4
Task design for Experiment 1. In both discrimination and detection blocks, participants viewed 700 ms of a random dot motion array, after which they made a keyboard response to indicate their decision (motion direction in discrimination, signal absence or presence in detection), followed by a continuous confidence report using the mouse. Five participants viewed vertically moving dots and indicated their detection responses on a horizontal scale, and five participants viewed horizontally moving dots and indicated their detection responses on a vertical scale
Fig. 5
Fig. 5
Reverse correlation, Exp. 1. A Effects of relative (orange curve) and sum (black curve) evidence on discrimination decisions. Note that relative evidence here is defined with respect to the true direction of motion, not participants’ decisions. B Effects of evidence for the chosen (green curve) and unchosen (purple curve) alternative on discrimination confidence. C Effects of sum and relative evidence (defined with respect to participants’ decisions) on discrimination confidence. D, F and H Effects of evidence for the true direction of motion (blue curve) and for the opposite direction of motion (red curve) on detection decisions, confidence in yes responses, and confidence in no responses, respectively. E, G, and I Effects of relative evidence (orange curve) and sum evidence (black curve) on detection decisions, confidence in yes responses, and confidence in no responses, respectively. The first 300 ms of the trial are marked in black. All nine panels are presented at the same scale, in arbitrary motion-energy units. Stars represent significance in a two-sided t test for the first 300 ms of the trial: *p < .05, **p < .01, ***p < .001. (Colour figure online)
Fig. 6
Fig. 6
Task design for Experiment 2. In both tasks, participants viewed two flickering patches for 480 ms, after which they made a keyboard response to indicate which of the patches was brighter (discrimination) or whether any of the patches was brighter than the background (detection). (Colour figure online)
Fig. 7
Fig. 7
Reverse correlation, Exp. 2. Same conventions as in Fig. 5. (Colour figure online)
Fig. 8
Fig. 8
Reverse correlation, Exp. 3. Same conventions as in Fig. 5. (Colour figure online)
Fig. 9
Fig. 9
Difference in confidence between standard and higher evidence (luminance and hue) trials for the three response categories (detection ‘yes’ and ‘no’ responses, and discrimination responses) in Exps. 3 and 4. Box edges and central lines represent the 25, 50, and 75 quantiles. Whiskers cover data points within four interquartile ranges around the median. Stars represent significance in a two-sided t test: **p < .01, ***p < .001. (Colour figure online)
Fig. 10
Fig. 10
Reverse correlation, Exp. 4. Same conventions as in Fig. 5. (Colour figure online)
Fig. A1
Fig. A1
Behavioural asymmetries in metacognitive sensitivity, response time, and overall confidence in detection (upper panel) and discrimination (lower panel), in Exp. 1. Left: Response conditional Type 2 ROC curves for the two tasks and four responses in Exp. 1. The area under the Type 2 ROC curve is a measure of metacognitive sensitivity, and the difference in areas between the two responses a measure of metacognitive asymmetry. Single-subject curves are presented in low opacity. Right: Distributions of the area under the Type 2 ROC curve, median response time, and mean confidence for the four responses, across participants. Box edges and central lines represent the 25, 50, and 75 quantiles. Whiskers cover data points within four interquartile ranges around the median. Stars represent significance in a two-sided t test: **p < .01, ***p < .001. (Colour figure online)
Fig. A2
Fig. A2
Behavioural asymmetries in metacognitive sensitivity, response time, and overall confidence, in Exp. 2. Same conventions as in Fig. A1. (Colour figure online)
Fig. A3
Fig. A3
Behavioural asymmetries in metacognitive sensitivity, response time, and overall confidence, in Exp. 3. Same conventions as in Fig. A1. (Colour figure online)
Fig. A4
Fig. A4
Behavioural asymmetries in metacognitive sensitivity, response time, and overall confidence, in Exp. 4. Same conventions as in Fig. A1. (Colour figure online)
Fig. A5
Fig. A5
Top row: Posterior probability of stimulus category given perceptual evidence for discrimination (left) and detection (right). Middle row: Decision probability as a function of perceptual evidence. Bottom row: Mean confidence in correct responses as a function of perceptual evidence. (Colour figure online)
Fig. A6
Fig. A6
Reverse correlation kernels derived from simulation of the vanilla model. Same conventions as Fig. 5. (Colour figure online)
Fig. A7
Fig. A7
Reverse correlation kernels derived from simulation of the firing rate model. Same conventions as Fig. 5. (Colour figure online)
Fig. A8
Fig. A8
Reverse correlation kernels derived from simulation of the guided attention model. Same conventions as Fig. 5. (Colour figure online)
Fig. A9
Fig. A9
Reverse correlation kernels derived from simulation of the random attention model. Same conventions as Fig. 5. (Colour figure online)
Fig. A10
Fig. A10
Decision and confidence pseudo-discrimination kernels, Experiment 1. Upper left: Motion energy in the ‘chosen’ (green) and ‘unchosen’ (purple) direction as a function of time. Bottom left: A subtraction between energy in the ‘chosen’ and ‘unchosen’ directions. Upper right: Confidence effects for motion energy in the ‘chosen’ (green) and ‘unchosen’ (purple) directions. Lower right: A subtraction between confidence effects in the ‘chosen’ and ‘unchosen’ directions. Shaded areas represent the mean ±1 standard error. The first 300 ms of the trial are marked in yellow. (Colour figure online)
Fig. A11
Fig. A11
Decision and confidence pseudodiscrimination kernels, Experiment 2. Upper left: Luminance in the ‘chosen’ (green) and ‘unchosen’ (purple) stimulus as a function of time and spatial position. Bottom left: Decision kernel averaged across the four spatial positions. Upper right: Confidence effects for motion energy in the ‘chosen’ (green) and ‘unchosen’ (purple) stimuli. Bottom right: Confidence effects averaged across the four spatial positions. Shaded areas represent the mean ±1 standard error. The first 300 ms of the trial are marked in yellow. (Colour figure online)

Similar articles

Cited by

References

    1. Adelson EH, Bergen JR. Spatiotemporal energy models for the perception of motion. Journal of the Optical Society of America A. 1985;2(2):284–299. doi: 10.1364/JOSAA.2.000284. - DOI - PubMed
    1. De Leeuw JR. jsPsych: A JavaScript library for creating behavioral experiments in a web browser. Behavior Research Methods. 2015;47(1):1–12. doi: 10.3758/s13428-014-0458-y. - DOI - PubMed
    1. Fechner, G. T., & Adler, H. E. (1860). Elemente der psychophysik [Elements of psychophysics]. Breitkopf and Ha Rtel.
    1. Kellij S, Fahrenfort J, Lau H, Peters MA, Odegaard B. An investigation of how relative precision of target encoding influences metacognitive performance. Attention, Perception, & Psychophysics. 2021;83(1):512–524. doi: 10.3758/s13414-020-02190-0. - DOI - PMC - PubMed
    1. Koizumi A, Maniscalco B, Lau H. Does perceptual confidence facilitate cognitive control? Attention, Perception, & Psychophysics. 2015;77(4):1295–1306. doi: 10.3758/s13414-015-0843-3. - DOI - PubMed

LinkOut - more resources