. 2023 Jun 20;80(7):185.
doi: 10.1007/s00018-023-04833-5.

DIS3L2 knockdown impairs key oncogenic properties of colorectal cancer cells via the mTOR signaling pathway

Affiliations

DIS3L2 knockdown impairs key oncogenic properties of colorectal cancer cells via the mTOR signaling pathway

Juan F García-Moreno et al. Cell Mol Life Sci. .

Abstract

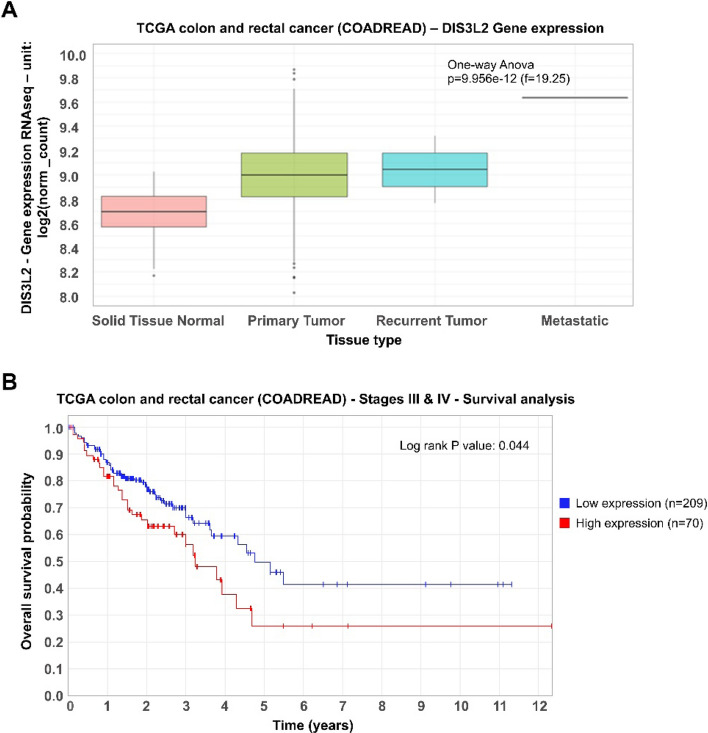
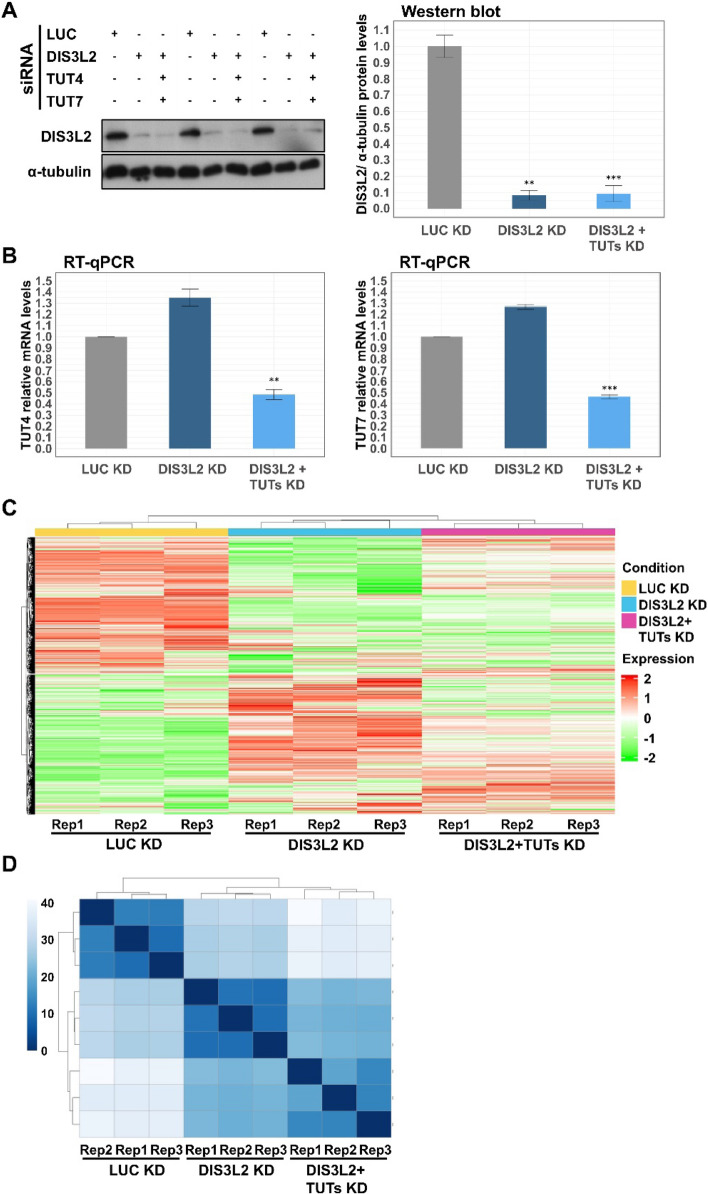
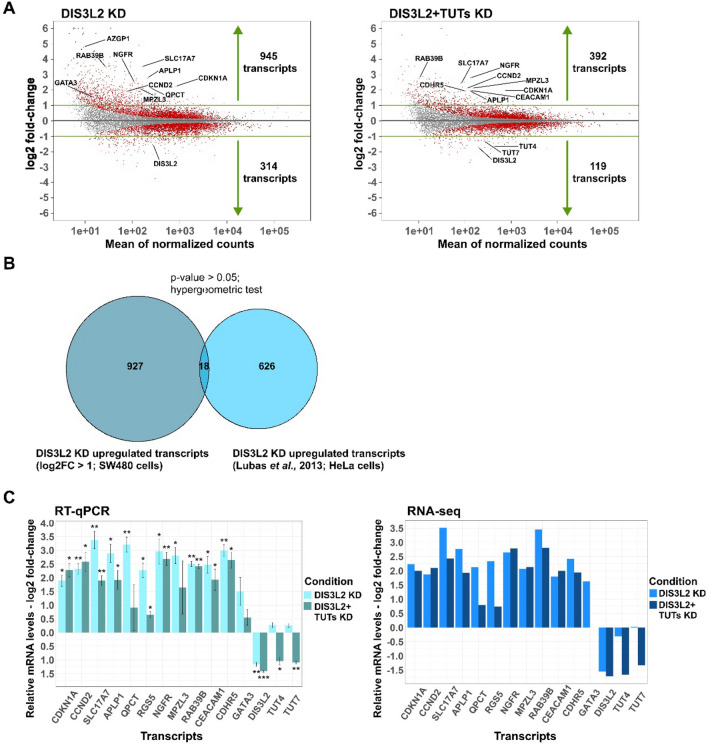
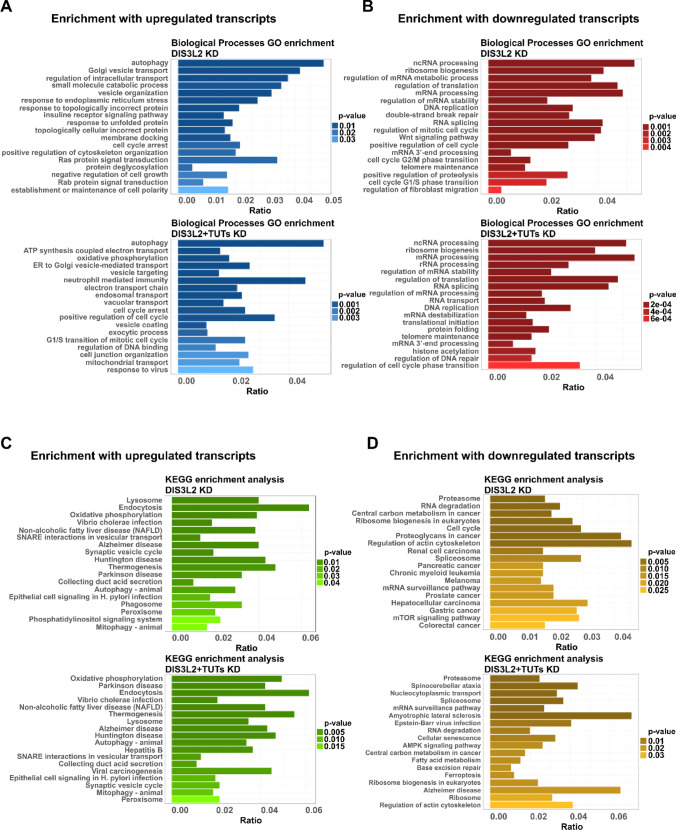
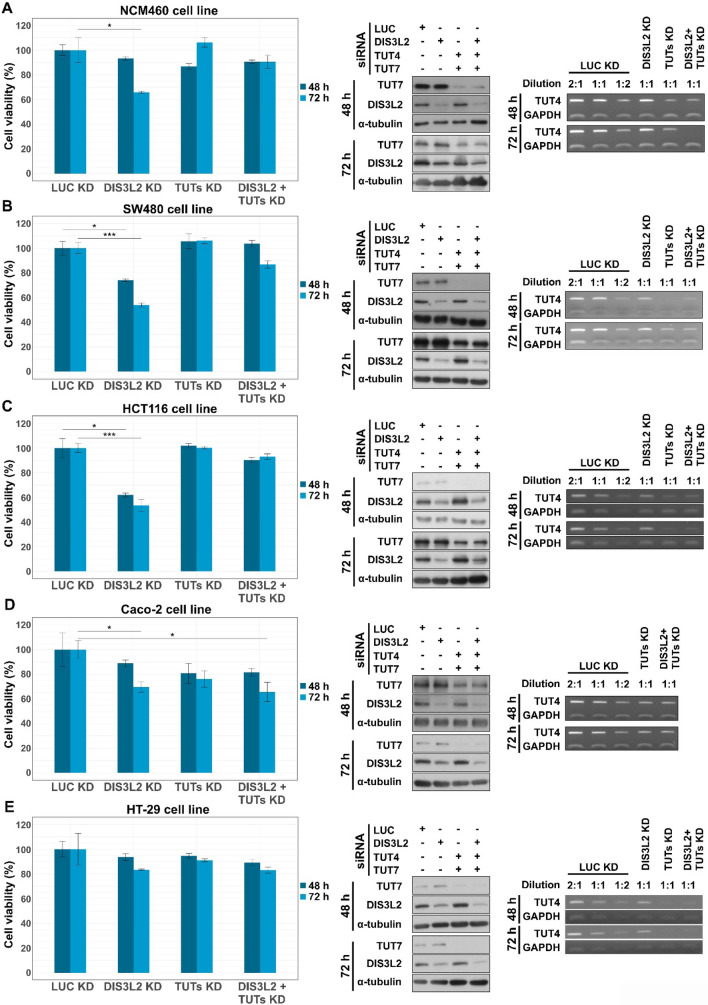
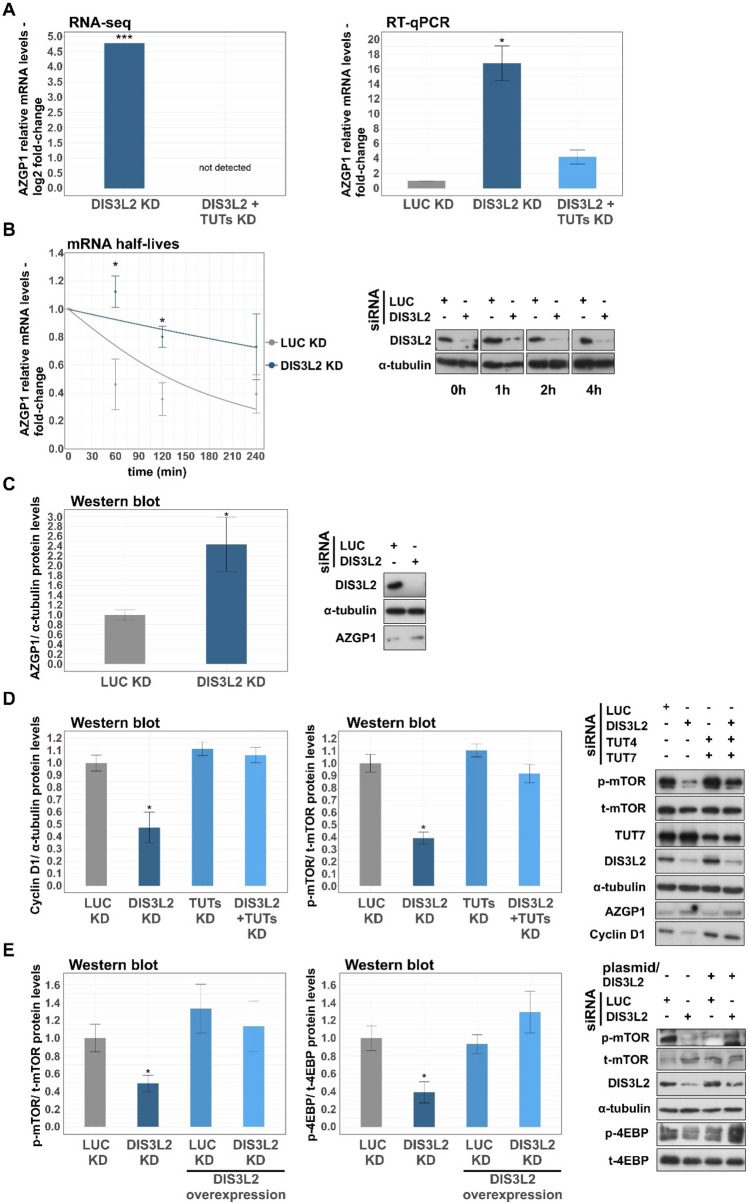
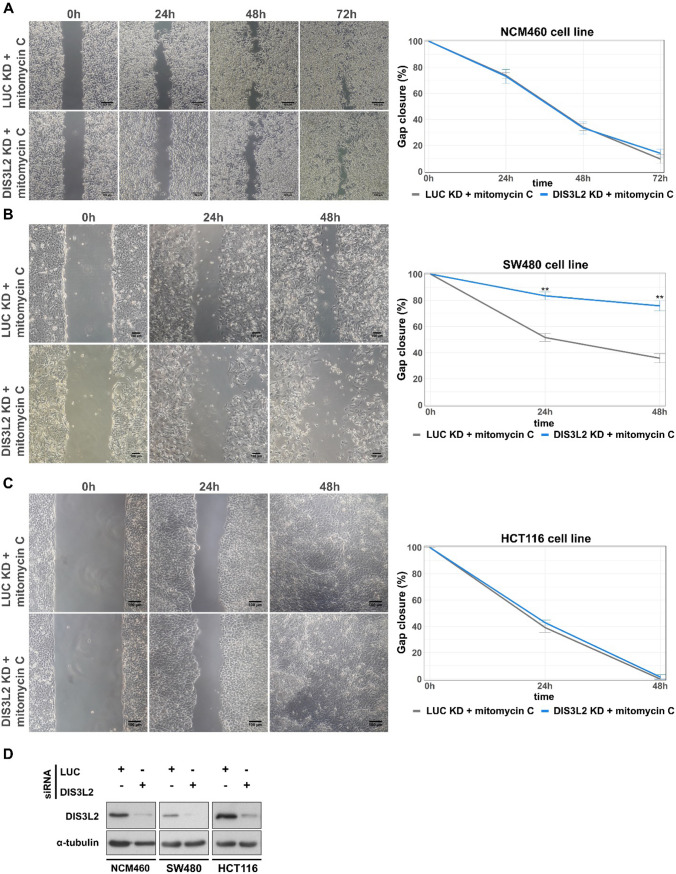
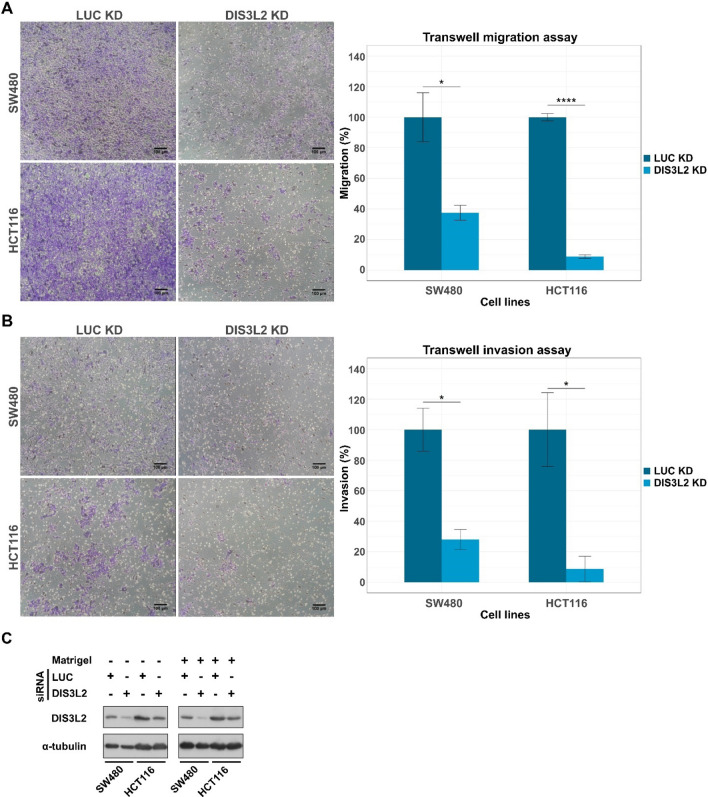
DIS3L2 degrades different types of RNAs in an exosome-independent manner including mRNAs and several types of non-coding RNAs. DIS3L2-mediated degradation is preceded by the addition of nontemplated uridines at the 3'end of its targets by the terminal uridylyl transferases 4 and 7. Most of the literature that concerns DIS3L2 characterizes its involvement in several RNA degradation pathways, however, there is some evidence that its dysregulated activity may contribute to cancer development. In the present study, we characterize the role of DIS3L2 in human colorectal cancer (CRC). Using the public RNA datasets from The Cancer Genome Atlas (TCGA), we found higher DIS3L2 mRNA levels in CRC tissues versus normal colonic samples as well as worse prognosis in patients with high DIS3L2 expression. In addition, our RNA deep-sequencing data revealed that knockdown (KD) of DIS3L2 induces a strong transcriptomic disturbance in SW480 CRC cells. Moreover, gene ontology (GO) analysis of significant upregulated transcripts displays enrichment in mRNAs encoding proteins involved in cell cycle regulation and cancer-related pathways, which guided us to evaluate which specific hallmarks of cancer are differentially regulated by DIS3L2. To do so, we employed four CRC cell lines (HCT116, SW480, Caco-2 and HT-29) differing in their mutational background and oncogenicity. We demonstrate that depletion of DIS3L2 results in reduced cell viability of highly oncogenic SW480 and HCT116 CRC cells, but had little or no impact in the more differentiated Caco-2 and HT-29 cells. Remarkably, the mTOR signaling pathway, crucial for cell survival and growth, is downregulated after DIS3L2 KD, whereas AZGP1, an mTOR pathway inhibitor, is upregulated. Furthermore, our results indicate that depletion of DIS3L2 disturbs metastasis-associated properties, such as cell migration and invasion, only in highly oncogenic CRC cells. Our work reveals for the first time a role for DIS3L2 in sustaining CRC cell proliferation and provides evidence that this ribonuclease is required to support the viability and invasive behavior of dedifferentiated CRC cells.

Keywords: AZGP1; Cell migration; Cell viability; Colorectal cancer; DIS3L2; mTOR.


Conflict of interest statement

The authors declare that they have no conflict of interest.

Figures

Fig. 1
Fig. 1
DIS3L2 is overexpressed in colorectal cancer (CRC) tissues and its upregulation correlates with poorer prognosis in patients with advanced CRC (stages III and IV). A Boxplot represents DIS3L2 mRNA levels in CRC tissues versus non-tumorigenic colonic samples, according to transcriptomic datasets from The Cancer Genome Atlas (TCGA). B Kaplan–Meier plot for high versus low DIS3L2 gene expression in patients affected by CRC (cut-off value: 3.2 FPKM), according to clinical and transcriptomic data from TCGA database
Fig. 2
Fig. 2
Knockdown (KD) of DIS3L2 largely affects the transcriptome of SW480 cells. A Western blot analysis for DIS3L2 and α–tubulin (loading control) to monitor DIS3L2 KD efficiencies from lysates used in the RNA-seq sample preparation; bar plot represents DIS3L2 protein levels after normalizing to α–tubulin, and to siLUC-treated cells (control condition), arbitrarily set to 1. B TUT4 (on the left) and TUT7 (on the right) mRNA levels normalized to glyceraldehyde-3-phosphate dehydrogenase (GAPDH; internal control) mRNA and determined by RT-qPCR to check TUTs KD efficiencies from lysates used in the RNA-seq sample preparation. Bar plots represent fold-change of each gene in each experimental condition, relative to mRNA levels from siLUC-treated cells, arbitrarily set to 1. C Heatmap of all genes detected by the RNA-seq, with a minimum of 11 counts in at least one sample. Genes are represented in the vertical axis, conditions in the horizontal axis and expression values are displayed as a Z-score (mean = 0) across samples. Color saturation represents the magnitude of deviation from the median (green and red color saturation correspond to values that are lower and greater than the row mean, respectively). D Sample-to-sample distance heatmap calculated after estimation of stabilized variance of normalized counts of gene expression across replicates. Square color saturation indicates relationship between transcriptomes of all RNA-seq samples. n = 3, asterisks (*) indicate statistical significance relative to protein levels (A) or mRNA levels (B) in control conditions (LUC KD): p < 0.05 (*), p < 0.01 (**) and p < 0.001 (***)
Fig. 3
Fig. 3
Depletion of DIS3L2 leads to more differentially expressed genes (DEGs) than DIS3L2 + TUTs knockdown (KD). A MA plot for visual representation of gene expression changes when comparing LUC KD (control condition) versus either DIS3L2 KD (left) or DIS3L2 + TUTs KD (right). Differentially expressed genes (DEGs) identified by DESeq 2 with adjusted p value < 0.05 (Wald test) are represented as red points. B Overlap analysis of DIS3L2-dependent mRNA targets obtained from our RNA-seq in SW480 cells (left circle) and from Lubas et al. transcriptomic analysis in HeLa cells (right circle). The overlap between circles represents the number of transcripts that are upregulated upon DIS3L2 knockdown (KD) in both gene sets (18). Statistical significance of this overlap is estimated by a hypergeometric test (p value < 0.05). C Validation of RNA-seq experiment; comparison of mRNA fold-changes of a set of selected transcripts (CDKN1A, CCND2, SLC17A7, APLP1, QPCT, RGS5, NGFR, MPZL3, RAB39B, CEACAM1, CDHR5, GATA3, DIS3L2, TUT4 and TUT7) by RT-qPCR (left) and RNA-seq (right). n = 3, asterisks (*) indicate statistical significance relative to mRNA levels in control conditions (LUC KD): p < 0.05 (*), p < 0.01 (**) and p < 0.001 (***)
Fig. 4
Fig. 4
Upregulated mRNAs after depletion of DIS3L2 or DIS3L2 + TUTs, are enriched in GO terms associated with cell cycle regulation. A Histograms show gene ontology (GO) analysis of biological processes enriched in the pool of upregulated transcripts either after DIS3L2 knockdown (KD) (top) or after DIS3L2 + TUTs KD (bottom). B GO enrichment for biological processes in the pool of downregulated transcripts either after DIS3L2 KD (top) or after DIS3L2 + TUTs KD (bottom). C Histogram displaying KEGG pathways enriched in the pool of upregulated transcripts after DIS3L2 KD (top) and DIS3L2 + TUTs KD (bottom). D KEGG pathways enrichment in the pool of downregulated transcripts either after DIS3L2 KD (top) or after DIS3L2 + TUTs KD (bottom). GO and KEGG terms are ranked by p value; ratio in x-axis of all plots is calculated by the number of transcripts enriched for each GO/KEGG term versus total number of up- or downregulated genes for each KD condition, respectively
Fig. 5
Fig. 5
DIS3L2 knockdown (KD) significantly impairs cell viability of SW480 and HCT116 cell lines. Bar plots represent MTT assays performed in non-transformed NCM460 colonocytes (A) and colorectal cancer cell lines SW480 (B), HCT116 (C), Caco-2 (D) and HT-29 (E). MTT assays were performed 48 h and 72 h after mock transfection with siLUC (control condition) or transfection with siDIS3L2, siTUTs 4/7, or the double KD with siDIS3L2 + siTUTs 4/7. Representative Western blots and semi-qPCRs of KD efficiencies in all cell lines are displayed on the right side of each bar plot. α–tubulin and GAPDH were used as internal controls in Western blot and semi-qPCR analysis, respectively. n = 4, statistical significance relative to mock conditions are indicated as: (*) p < 0.05, (**) p < 0.01, and (***) p < 0.001
Fig. 6
Fig. 6
Loss of DIS3L2 expression upregulates AZGP1 mRNA and protein levels and inhibits the mTOR signaling pathway. A AZGP1 mRNA levels normalized to glyceraldehyde-3-phosphate dehydrogenase (GAPDH; internal control) mRNA and determined by RNA-seq (left) and RT-qPCR (right) in SW480 cells treated with siRNAs targeting LUC (control condition), DIS3L2 or DIS3L2 + TUTs. B mRNA stability of AZGP1 in SW480 cells transfected with siRNAs targeting LUC (control condition) and DIS3L2. The mRNA levels were determined by RT-qPCR at various time points (0, 60, 120, 240 min) after DRB treatment. AZGP1 mRNA decay rates were plotted by normalizing the mRNA level of each time point to that of 0 h in each condition; statistical significance is relative to mock condition at each time point. C Bar plot representing AZGP1 protein levels determined by Western blot in siLUC- and siDIS3L2-treated SW480 cells. On the right, a representative Western blot analysis for DIS3L2, AZGP1 and α–tubulin (loading control). D Bar plots representing Cyclin D1 and p/t-mTOR protein levels determined by Western blot in SW480 depleted from DIS3L2 or DIS3L2 + TUTs, after normalizing to protein levels of siLUC-treated cells. Representative Western blot analysis for phospho-Ser2448-mTOR (p-mTOR), total-mTOR (t-mTOR), TUT7, DIS3L2, AZGP1, Cyclin D1 and α–tubulin (loading control) to monitor the impact of DIS3L2 depletion in the mTOR signaling pathway in SW480 cells. E Bar plots representing p/t-mTOR and p/t-4EBP protein levels determined by Western blot in SW480 cells treated with siRNAs targeting LUC (control condition) or DIS3L2 with or without DIS3L2 overexpression. Representative Western blot analysis for p-mTOR, t-mTOR, DIS3L2, phosphor-Ser-112-4EBP (p-4EBP), total-4EBP (t-4EBP) and α-tubulin. n ≥ 3, statistical significance relative to mock condition are indicated as: (*) p < 0.05, (**) p < 0.01, and (***) p < 0.001
Fig. 7
Fig. 7
Migration of SW480 cells is impaired by DIS3L2 depletion. Representative images of wound-healing assays conducted in normal colonic NCM460 cells (A) and colorectal cancer cell lines SW480 (B) and HCT116 (C), after mock (siLUC) or DIS3L2 depletion (siDIS3L2). Line plots represent gap closure (%) after scratching at the indicated time points. D Representative Western blot analysis for DIS3L2 and α–tubulin (loading control) to monitor DIS3L2 KD efficiencies in each cell line. n = 4, statistical significance relative to mock condition are indicated as: (*) p < 0.05, (**) p < 0.01, and (***) p < 0.001
Fig. 8
Fig. 8
Knockdown of DIS3L2 reduces chemotactic migration and invasion of colorectal cancer SW480 and HCT116 cells. A Representative images of transwell migration assays performed in SW480 (top) and HCT116 (bottom) cell lines after mock (siLUC) or DIS3L2 depletion (siDIS3L2). Bar plots represent the quantification of the number of cells migrating to the lower compartment, expressed in % of control condition. B Representative images of transwell invasion assays performed in Matrigel-coated chambers. SW480 (top) and HCT116 (bottom) cells were treated as in (A). Bar plots represent the quantification of the number of cells invading through the matrix to the lower compartment, expressed in % of control condition. C Representative Western blot analysis for DIS3L2 and α–tubulin (loading control) to monitor DIS3L2 KD efficiencies in each cell line. n = 3, statistical significance relative to mock condition are indicated as: (*) p < 0.05, (**) p < 0.01, and (***) p < 0.001

Similar articles

Cited by

References

    1. Astuti D, Morris MR, Cooper WN, et al. Germline mutations in DIS3L2 cause the Perlman syndrome of overgrowth and Wilms tumor susceptibility. Nat Genet. 2012;44:277–284. doi: 10.1038/ng.1071. - DOI - PubMed
    1. Mamolen M, Smith A, Andrulis ED. Drosophila melanogaster Dis3 N-terminal domains are required for ribonuclease activities, nuclear localization and exosome interactions. Nucleic Acids Res. 2010 doi: 10.1093/nar/gkq295. - DOI - PMC - PubMed
    1. Schaeffer D, Tsanova B, Barbas A, et al. The exosome contains domains with specific endoribonuclease, exoribonuclease and cytoplasmic mRNA decay activities. Nat Struct Mol Biol. 2009 doi: 10.1038/nsmb.1528. - DOI - PMC - PubMed
    1. Schneider C, Leung E, Brown J, Tollervey D. The N-terminal PIN domain of the exosome subunit Rrp44 harbors endonuclease activity and tethers Rrp44 to the yeast core exosome. Nucleic Acids Res. 2009 doi: 10.1093/nar/gkn1020. - DOI - PMC - PubMed
    1. Malecki M, Viegas SC, Carneiro T, et al. The exoribonuclease Dis3L2 defines a novel eukaryotic RNA degradation pathway. EMBO J. 2013 doi: 10.1038/emboj.2013.63. - DOI - PMC - PubMed