. 2023 Jun 20;21(1):401.
doi: 10.1186/s12967-023-04232-1.

NIPSNAP1 directs dual mechanisms to restrain senescence in cancer cells

Affiliations

NIPSNAP1 directs dual mechanisms to restrain senescence in cancer cells

Enyi Gao et al. J Transl Med. .

Abstract

Background: Although the executive pathways of senescence are known, the underlying control mechanisms are diverse and not fully understood, particularly how cancer cells avoid triggering senescence despite experiencing exacerbated stress conditions within the tumor microenvironment.

Methods: Mass spectrometry (MS)-based proteomic screening was used to identify differentially regulated genes in serum-starved hepatocellular carcinoma cells and RNAi employed to determine knockdown phenotypes of prioritized genes. Thereafter, gene function was investigated using cell proliferation assays (colony-formation, CCK-8, Edu incorporation and cell cycle) together with cellular senescence assays (SA-β-gal, SAHF and SASP). Gene overexpression and knockdown techniques were applied to examine mRNA and protein regulation in combination with luciferase reporter and proteasome degradation assays, respectively. Flow cytometry was applied to detect changes in cellular reactive oxygen species (ROS) and in vivo gene function examined using a xenograft model.

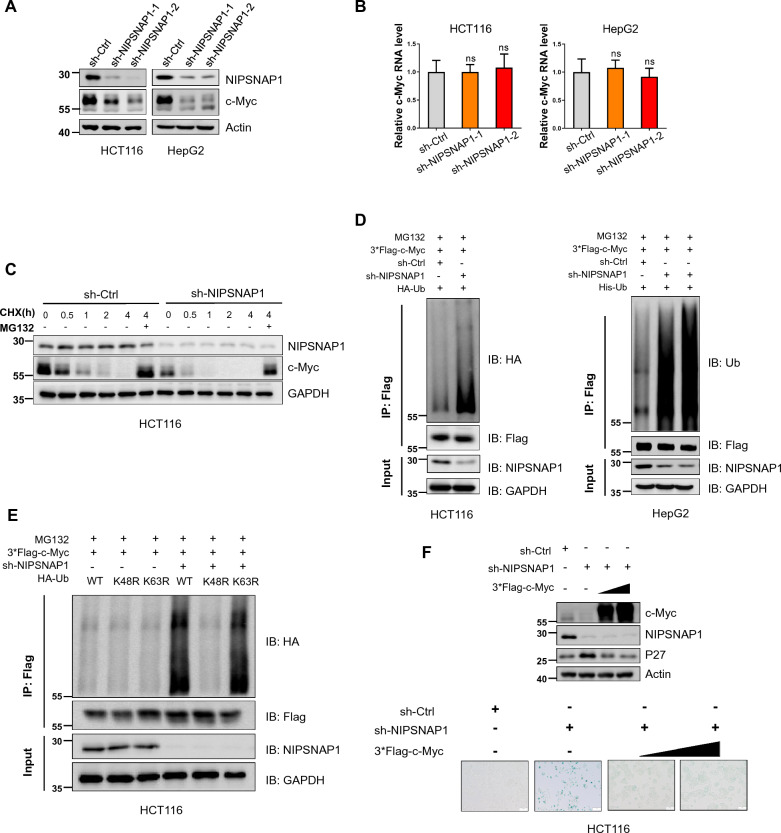
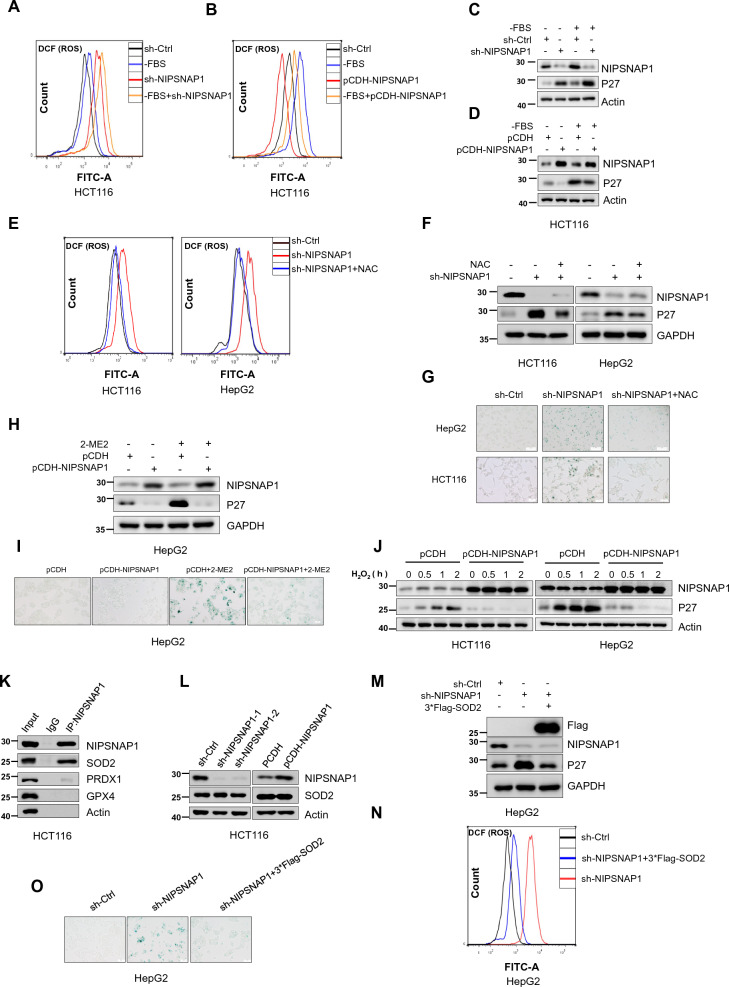
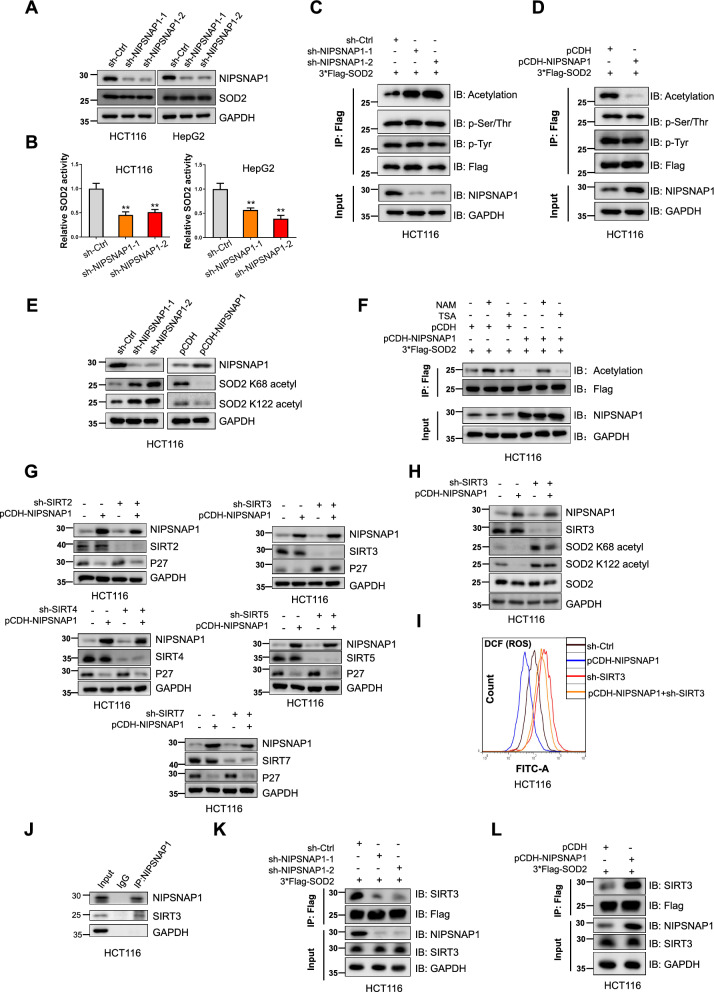
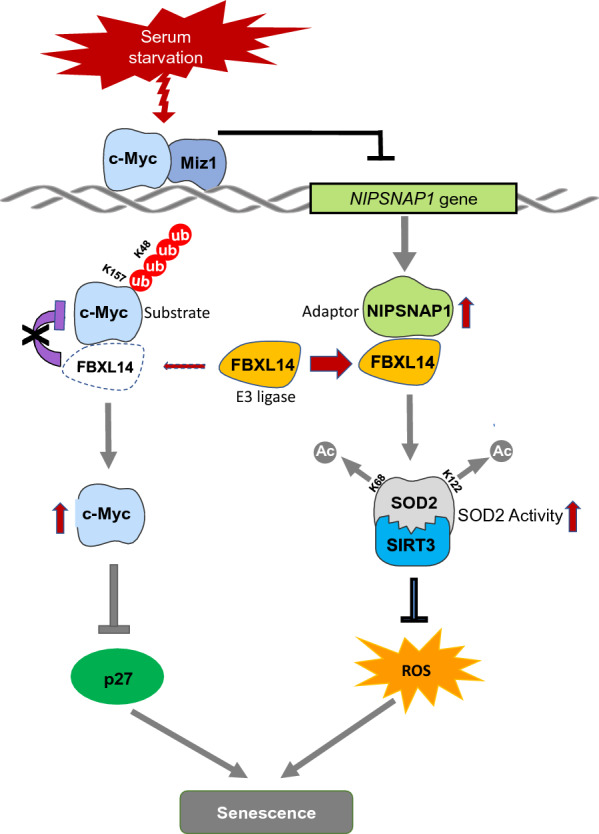
Results: Among the genes induced by serum deprivation, NIPSNAP1 was selected for investigation. Subsequent experiments revealed that NIPSNAP1 promotes cancer cell proliferation and inhibits P27-dependent induction of senescence via dual mechanisms. Firstly, NIPSNAP1 maintains the levels of c-Myc by sequestering the E3 ubiquitin ligase FBXL14 to prevent the proteasome-mediated turnover of c-Myc. Intriguingly, NIPSNAP1 levels are restrained by transcriptional repression mediated by c-Myc-Miz1, with repression lifted in response to serum withdrawal, thus identifying feedback regulation between NIPSNAP1 and c-Myc. Secondly, NIPSNAP1 was shown to modulate ROS levels by promoting interactions between the deacetylase SIRT3 and superoxide dismutase 2 (SOD2). Consequent activation of SOD2 serves to maintain cellular ROS levels below the critical levels required to induce cell cycle arrest and senescence. Importantly, the actions of NIPSNAP1 in promoting cancer cell proliferation and preventing senescence were recapitulated in vivo using xenograft models.

Conclusions: Together, these findings reveal NIPSNAP1 as an important mediator of c-Myc function and a negative regulator of cellular senescence. These findings also provide a theoretical basis for cancer therapy where targeting NIPSNAP1 invokes cellular senescence.

Keywords: Acetylation; Cellular senescence; FBXL14; NIPSNAP1; ROS; SIRT3; SOD2; c-Myc.


Conflict of interest statement

The authors declare no competing interests.

Figures

Fig. 1
Fig. 1
Screening identifies upregulation of NIPSNAP1 following serum deprivation promotes cell growth and inhibits cellular senescence. A HCT1116 cells were subjected to serum starvation for 0, 24 and 48 h before conducting qPCR measurements of 15 candidate proteins determined from MS analysis. B Clonogenic growth of HCT116 cells after 2 weeks of culture following lentiviral shRNA-mediated knockdown of selected candidate genes from A compared with an empty vector control (sh-Ctrl). C, D sh-Ctrl or two independent shRNAs targeting NIPSNAP1 (sh-NIPSNAP1-1 and sh-NIPSNAP1-2) or D after transduction with the pCDH empty vector or NIPSNAP1 overexpression vector pCDH-NIPSNAP1 was used to transduce HepG2 cells for 48 h, and DNA synthesis determined using EdU incorporation for 4 h in C HepG2 cells transduced with. Representative images showing nuclei (Hoechst staining, blue) or incorporated EdU (red) (left) were subjected to image analysis to determine comparative DNA synthesis rates (right) (bar = 100 µm). E Flow cytometric-based determination of cell cycle phases in HCT116 cells transduced with sh-Ctrl or sh-NIPSNAP1 cultured with or without serum (FBS) for 24 h. F Western blotting measuring the cellular levels of Ki67 and P27 in HCT116 cells treated with shRNAs as per E. Actin was used throughout as a loading control. G Detection of SA-β-gal staining in HCT116 and HepG2 cells transduced with sh-Ctrl or two independent-shRNAs targeting NIPSNAP1. Representative light micrographs (left) and the percentage of SA-β-gal-positive cells (right) (bar = 50 µm). H Senescence-associated heterochromatin foci (SAHFs) decorated by immunofluorescence (IF) staining against H3K9me3 (green) in HepG2 cells (left) transduced with sh-Ctrl or two independent-shRNAs targeting NIPSNAP1. DAPI counterstaining of nuclei is shown in blue (bar = 10 µm). Quantitation of SAHF/cell (right). I Senescence-associated secretory phenotype in HCT116 cells treated as per G. Secreted levels of IL-6 and IL-8 in culture supernatants were determined by ELISA. J Western blotting analysis of P27, P21, P16, and P15 levels in HCT116 and HepG2 cells after 48 h transduction with sh-Ctrl or two independent-shRNAs targeting NIPSNAP1. K HCT116 (P53−/−) cells were transduced with sh-Ctrl or two independent-shRNAs targeting NIPSNAP1 before analysis of P27 and c-Myc levels by Western blot. L SA-β-gal staining in HCT116 (P53−/−) cells as per G after NIPSNAP1 knockdown. A, C, D, GI and L are mean ± SD; n = 3 independent experiments, two-tailed Student’s t test, Images in B, E, F, J and K represents three independent experiments (*P < 0.05; **P < 0.01, ***p < 0.001)
Fig. 2
Fig. 2
NIPSNAP1 expression is transcriptionally repressed by c-Myc-Miz1 with de-repression in response to serum deprivation. A Relative NIPSNAP1 mRNA levels in HCT116 cells after transduction with sh-Ctrl, sh-SP1, sh-HIF1a, sh-c-Jun, sh-FOXO1 or sh-c-Myc lentiviruses determined by qPCR at 0, 24 and 48 h following FBS withdrawal. B Western blotting measurements of NIPSNAP1 and P27 levels in HCT116 cells treated with sh-Ctrl or sh-c-Myc lentiviruses at 0, 24 and 48 h following FBS withdrawal. Actin was used throughout as a loading control. C HCT116 cells were transduced with sh-Ctrl or sh-Miz1 lentiviruses at 0, 24 and 48 h following serum (FBS) withdrawal. Cell lysates were subjected to Western blotting against Miz1 or actin (top) or total RNA used for qPCR-based measurement of NIPSNAP1 mRNA (bottom). D HCT116 cells were transduced with sh-Ctrl or sh-c-Myc in combination with empty Flag-vector or the Flag-Miz1 overexpression vector. Cell lysates were subjected to Western blotting against Flag or c-Myc (top) or total RNA used for qPCR-based measurement of NIPSNAP1 mRNA (bottom). E Schematic illustrating the putative c-Myc binding sites (BSs) in the NIPSNAP1 promoter, termed c-Myc-BS1 (− 1929 to − 1921 bp) and c-Myc-BS2 (− 279 to − 272 bp), respectively. F ChIP assays targeting c-Myc (left) or Miz1 (right) and the corresponding control IgG samples performed in HCT116 cells. Primers targeting c-Myc-BS1 and c-Myc-BS2 were used along with negative and positive control primers against the GAPDH and LAST promoters, respectively, the latter a known target of c-Myc/Miz1. G Schematic illustrating the design of pGL3-based luciferase reporter constructs containing the wildtype (WT) or mutant c-Myc binding sites in the NIPSNAP1 promoter. H Luciferase reporter assays conducted in HCT116 cells measuring the activity of the WT NIPSNAP1 reporter construct after co-transfection of the empty 3*Flag-vector or 3*Flag-c-Myc overexpression vector. Relative luciferase activity (left) and Western blotting to confirm ectopic c-Myc expression. I Luciferase reporter assays were conducted as per H after transduction with sh-Ctrl or sh-c-Myc and co-transfection with either the wildtype (WT) or mutant (Mut) c-Myc reporter constructs. J Luciferase reporter assays were conducted as per H after transduction with sh-Ctrl or sh-Miz1 and co-transfection with the empty 3*Flag-vector or 3*Flag-c-Myc overexpression vector. Relative luciferase activity (left) and Western blotting to confirm Miz1 knockdown and ectopic c-Myc expression. K Luciferase reporter assays were conducted as per H after transduction with either the wildtype (WT) or mutant (Mut) c-Myc reporter constructs at 0, 24 and 48 h following serum (FBS) withdrawal. A, C, D and HK are mean ± SD; n = 3 independent experiments, two-tailed Student’s t test, Images in B and F represents three independent experiments (*P < 0.05; **P < 0.01, ***p < 0.001)
Fig. 3
Fig. 3
NIPSNAP1 promotes c-Myc protein stability as part of a mutual regulatory feedback loop. A Western blotting analysis of c-Myc levels in HCT116 and HepG2 cells after transduction with sh-Ctrl or two independent-shRNAs targeting sh-NIPSNAP1. Actin was used as a loading control throughout. B Parallel assays conducted in the cells from A measuring c-Myc mRNA levels using qPCR. C Cycloheximide (CHX) chase assays comparing the stability of c-Myc in HCT116 cells after transduction with sh-Ctrl or sh-NIPSNAP1 lentiviruses. The cells were pretreated with 50 mg/ml CHX for 0–4 h before analysis of NIPSNAP1 and c-Myc expression levels by Western blotting. As indicated, the effects of co-treating cells with or without 10 mM MG132 were determined at the 4 h timepoint. D Analysis of the polybiquitylation of ectopically expressed c-Myc. HCT116 (left) or HepG2 (right) cells were transduced with sh-Ctrl or sh-NIPSNAP1 before co-transfection with hemagglutinin (HA)-Ub and 3*Flag-c-Myc. Cell lysates (input) were subjected to Western blotting against NIPSNAP1 and a GAPDH loading control whereas anti-Flag immunoprecipitates (IPs) were blotted for anti-Ub or anti-HA as shown. E Ubiquitination analysis of 3*Flag-c-Myc measured as per D in HCT116 cells co-transfected without or with sh-NIPSNAP1 in combination with either HA-Ub WT, HA-Ub K48R, or HA-Ub K63R, respectively. F HCT116 cells transduced with sh-Ctrl or sh-NIPSNAP1 in combination with two different concentrations of 3*Flag-c-Myc were subjected to Western blotting to measure c-Myc, NIPSNAP1 and P27 (top) or SA-β-gal staining (bottom), respectively. B is mean ± SD; n = 3 independent experiments, two-tailed Student’s t test, Images in A and CF represents three independent experiments (*P < 0.05; **P < 0.01, ***p < 0.001)
Fig. 4
Fig. 4
NIPSNAP1 sequesters FBXL14 to inhibit c-Myc degradation. A Fast Silver Staining gel comparing anti-Flag immunoprecipitants from HCT116 cells transduced with either a control vector (pCDH) or Flag-tagged NIPSNAP1 construct (pCDH-NIPSNAP1-Flag). The highlighted bands denoted as FBXL14 and NIPSNAP1, respectively, were assigned based on mass spectrometry (MS/MS) analysis tabulated elsewhere as Additional file 8: Table S6. B Western blotting-based assessment of interactions between endogenous NIPSNAP1 and candidate ubiquitin modifiers detected in A and from the literature associated with c-Myc regulation. Only FBXL14 was recovered within NIPSNAP1 immunoprecipitates (IPs) from HCT116 cells. GAPDH was used as a loading control throughout. C Endogenous NIPSNAP1 is recovered within FBXL14 IPs from HCT116 cells conducted as per B. D Representative confocal images showing immunofluorescence staining against NIPSNAP1 (green), FBXL14 (red), and DAPI (blue) in HepG2 cells (bar = 20 µm). E Western blotting analysis of FBXL14 levels in HepG2 cells after transduction with sh-Ctrl or two independent-shRNAs targeting NIPSNAP1. F Western blotting analysis of the levels of Ki67, NIPSNAP1, c-Myc and P27 in HCT116 cells after transduction with sh-Ctrl or two independent-shRNAs targeting FBXL14. G Western blot analysis of HCT116 cells as per F after transduction with graded concentrations of FBXL14-MYC. Ectopic FBXL14 levels were detected with anti-Myc epitope antibodies. H Cycloheximide (CHX) chase assays comparing the stability of c-Myc in HCT116 cells after transduction with sh-Ctrl or sh-FBXL14 lentiviruses. The cells were pretreated with 50 mg/ml CHX for 0–24 h before analysis of FBXL14 and c-Myc expression levels by Western blotting. I Analysis of the effects of FBXL14 on the polybiquitylation of c-Myc. HCT116 cells were transduced with FBXL14-MYC and co-transfected with hemagglutinin (HA)-Ub and 3*Flag-c-Myc. Input samples or anti-Flag IPs were then subjected to Western blotting against HA, Flag and MYC, respectively. J Ubiquitination of 3*Flag-c-Myc measured as per I in cells co-transfected with FBXL14-MYC in combination with either HA-Ub WT, HA-Ub K48R, or HA-Ub K63R, respectively. K The stability of the indicated Flag-tagged lysine substitution mutants of c-Myc in the absence (empty vector) and presence of ectopically expressed FBXL14-MYC was measured in HCT116 cells. The expression of c-Myc and FBXL14 was revealed by Western blotting using antibodies against Flag and MYC, respectively. L Ubiquitylation assays performed in HCT116 cells after individually transfecting WT Flag-tagged c-Myc, or the indicated substitution mutants together with HA-Ub and FBXL14-MYC. Cell lysates (input) were subjected to Western blotting against MYC and a GAPDH loading control whereas anti-Flag immunoprecipitates (IPs) were blotted with anti-Flag and anti-HA, respectively
Fig. 5
Fig. 5
Dissecting interactions between NIPSNAP1, FBXL14 and c-Myc. A Western blotting analysis of the levels of NIPSNAP1, FBXL14, Ki67, c-Myc, and P27 in HepG2 cells subjected to transduction with sh-Ctrl (−) or sh-NIPSNAP1 alone or in combination with sh-FBXL14. GAPDH was used a loading control throughout. B Ubiquitylation assays performed in HCT116 cells transduced with sh-Ctrl, sh-FBXL14 or sh-NIPSNAP1 in combination with co-transfection with hemagglutinin (HA)-Ub and 3*Flag-c-Myc. Cell lysates (input) were subjected to Western blotting against NIPSNAP1 and FBXL14 whereas anti-Flag immunoprecipitates (IPs) were blotted with anti-Flag and anti-HA, respectively. C HCT116 cells were transduced with 3*Flag-c-Myc in combination with sh-Ctrl or sh-NIPSNAP1 before Western blotting analysis of cell lysates or anti-Flag immunoprecipitates against Flag, FBXL14 and NIPSNAP1, respectively. D Schematic illustrating the design of full-length Flag-tagged FBXL14 (FBXL14-WT) and overlapping truncated constructs (FBXL14-P1, -P2, -P3, P4 and P5, respectively; left). HCT116 cells were transfected with the indicated constructs and subjected to immunoprecipitation with anti-Flag antibodies before Western blotting against Flag and NIPSNAP1, respectively (right). E, F HepG2 cells were subjected to transduction with sh-Ctrl (−) or sh-NIPSNAP1 alone or in combination with sh-FBXL14 before assessment of cell proliferation using CCK-8 assays (E) and cellular senescence as SA-β-gal staining (F). E Is mean ± SD; n = 3 independent experiments, two-tailed Student’s t test, images in AD and F represents three independent experiments (*P < 0.05; **P < 0.01, ***p < 0.001)
Fig. 6
Fig. 6
NIPSNAP1 inhibits ROS-induced cellular senescence in a SOD2-dependent manner. AD HCT116 cells transduced with sh-Ctrl or sh-NIPSNAP1 or with pCDH or the pCDH-NIPSNAP1 overexpression vector were cultured with or without FBS for 24 h. ROS levels were determined using the DCF probe by flow cytometry (A, B). Cell lysates were subjected to Western blotting to measure NIPSNAP1 and P27 (C, D). E HCT116 and HepG2 cells transduced with sh-Ctrl or sh-NIPSNAP1 were cultured with or without the ROS scavenger NAC (4 mM) for 6 h. ROS levels were determined using the DCF probe by flow cytometry. F, G The cells from E were subject to parallel Western blotting analysis against NIPSNAP1, P27 and the GAPDH loading control (F) or subjected to SA-β-gal staining analysis (G), respectively. H, I HepG2 cells were transduced with pCDH or pCDH-NIPSNAP1 and cultured with or without the ROS activator 2-ME2 (10 mM) for 24 h. Cell lysates were subjected to Western blotting to measure NIPSNAP1 and P27 (H) or the cells subjected to SA-β-gal staining analysis (I). J HCT116 and HepG2 cells transduced with pCDH or pCDH-NIPSNAP1 were treated with 0.5 mM H2O2 for 0–2 h before analysis of NIPSNAP1 and P27 expression levels by Western blot. Actin was used as a loading control throughout. K Immunoprecipitation (IP) analyses against endogenous NIPSNAP1 undertaken in HCT116 cells examining interactions with SOD2, PRDX1 and GPX4. L Western blotting analysis of SOD2 levels in HCT116 cells after transduction with sh-Ctrl or two independent-shRNAs targeting (sh-NIPSNAP1-1 and -2, left), or after transduction with pCDH or the pCDH-NIPSNAP1 overexpression vector (right). MO HepG2 cells were transduced with sh-Ctrl or sh-NIPSNAP1 alone or in combination with 3*Flag-SOD2. Thereafter, the cells were subjected to Western blot analysis against Flag, NIPSNAP1 and P27 (M), the detection of ROS levels by flow cytometry using the DCF probe (N), and SA-β-gal staining (O) analysis, respectively. AO All data are representative of three independent experiments
Fig. 7
Fig. 7
NIPSNAP1 increases the antioxidant activity of SOD2 through SIRT3-mediated deacetylation. A, B HCT116 (left) and HepG2 (right) cells transduced with sh-Ctrl or two independent-shRNAs targeting (sh-NIPSNAP1-1 and -2, respectively) were subjected to Western blotting to measure NIPSNAP1 and SOD2 levels (A) or manganese superoxide dismutase (MnSOD) activity (B), respectively. C, D HCT116 cells transduced with sh-Ctrl or two independent-shRNAs targeting (sh-NIPSNAP1-1 and -2, respectively) (C) or with pCDH or the pCDH-NIPSNAP1 overexpression vector (D) were co-transfected with 3*Flag-SOD2. Thereafter, cell lysates were subjected to immunoprecipitation (IP) with anti-Flag antibodies followed by Western blot analysis against Flag, and generalized antibodies recognizing acetylated lysines, phosphorylated tyrosine (p-Tyr) or phosphorylated tyrosine/serine residues (p-Ser/Thr), respectively. Input samples were analyzed in parallel to confirm knockdown and overexpression efficiency, respectively. E HCT116 cells with knockdown (left) or overexpression of NIPSNAP1 (right) as per C, D were analyzed by Western blot to measure the levels of K68 and K122 acetylated SOD2. F HCT116 cells transduced with pCDH or pCDH-NIPSNAP1 were co-transfected with 3*Flag-SOD2 before culture with or without NAM (nicotinamide, 10 mM) or TSA (Trichostatin A, 1 μM). Thereafter, cell lysates were subjected to immunoprecipitation (IP) with anti-Flag antibodies followed by Western blot analysis against Flag, and generalized antibodies recognizing acetylated lysine. G HCT116 cells transduced with sh-SIRT2 or sh-SIRT3 or sh-SIRT4 or sh-SIRT5 or sh-SIRT7 in combination with pCDH-NIPSNAP1 were subjected to Western blot analysis against NIPSNAP1, SIRT isoforms or P27, respectively. H, I HCT116 cells transduced with sh-SIRT3 in combination with pCDH-NIPSNAP1 were subjected to Western blot analysis against NIPSNAP1, SIRT3, K68 and K122 acetylated and total SOD2, respectively (H) or to flow cytometric analysis of ROS levels (I). J Immunoprecipitation (IP) analyses undertaken in HCT116 cells examining interactions between endogenous NIPSNAP1 and SIRT3. K, L Immunoprecipitation (IP) analyses undertaken in HCT116 cells examining the effect of NIPSNAP1 knockdown (K) and overexpression (L) on interactions between SIRT3 and SOD2. HCT116 cells as per C and D were subjected to IP with anti-Flag antibodies followed by Western blot analysis to detect SOD2-3*Flag (anti-Flag) and SIRT3. Input samples were analyzed in parallel to confirm the effects of NIPSNAP1 knockdown and overexpression, respectively, and equal input levels of SIRT3. B Is mean ± SD; n = 3 independent experiments, two-tailed Student’s t test, Images in A and CL represents three independent experiments (*P < 0.05; **P < 0.01, ***p < 0.001)
Fig. 8
Fig. 8
NIPSNAP1 promotes cancer growth in vivo. AD Visual (A) and weight comparisons (B) of xenografts established over 4 weeks using HepG2 cells expressing sh-Ctrl versus sh-NIPSNAP1 (top) or pCDH versus pCDH-NIPSNAP1 (bottom). Tumor volumes were measured at the indicated time points (C) and with images showing representative in vivo luciferase imaging at 4 weeks (D) prior to humane sacrifice of the mice. E Western blotting analysis of lysates from the excised xenografts against NIPSNAP1, P27 and an actin loading control. F Photomicrographs of xenograft sections from A showing immunohistochemical (IHC) staining against Ki67, c-Myc, and K68 and K122 acetylated SOD2 (left). Stained sections were subjected to image analysis to calculate the relative proliferative index from Ki67 staining or alternatively the relative mean of integrated option density (IOD) (right). B, C and F is mean ± SD; n = 3 independent experiments, two-tailed Student’s t test, images in A, D and E represents three independent experiments (*P < 0.05; **P < 0.01, ***p < 0.001)
Fig. 9
Fig. 9
Model for NIPSNAP1-mediated regulation of cellular senescence. Schematic illustration of the proposed model depicting the dual mechanisms whereby NIPSNAP1 suppresses cellular senescence

Similar articles

Cited by

References

    1. Dimri G, Lee X, Basile G, Acosta M, Scott G, Roskelley C, Medrano E, Linskens M, Rubelj I, Pereira-Smith O. A biomarker that identifies senescent human cells in culture and in aging skin in vivo. Proc Natl Acad Sci USA. 1995;92:9363–9367. doi: 10.1073/pnas.92.20.9363. - DOI - PMC - PubMed
    1. Bell C, Lowe R, Adams P, Baccarelli A, Beck S, Bell J, Christensen B, Gladyshev V, Heijmans B, Horvath S, et al. DNA methylation aging clocks: challenges and recommendations. Genome Biol. 2019;20:249. doi: 10.1186/s13059-019-1824-y. - DOI - PMC - PubMed
    1. Aman Y, Schmauck-Medina T, Hansen M, Morimoto R, Simon A, Bjedov I, Palikaras K, Simonsen A, Johansen T, Tavernarakis N, et al. Autophagy in healthy aging and disease. Nat Aging. 2021;1:634–650. doi: 10.1038/s43587-021-00098-4. - DOI - PMC - PubMed
    1. Roninson IB. Tumor cell senescence in cancer treatment. Cancer Res. 2003;63:2705–2715. - PubMed
    1. Acosta JC, Gil J. Senescence: a new weapon for cancer therapy. Trends Cell Biol. 2012;22:211–219. doi: 10.1016/j.tcb.2011.11.006. - DOI - PubMed

Publication types

Substances