. 2023 Jun 20;18(1):39.
doi: 10.1186/s13024-023-00624-5.

Sex specific molecular networks and key drivers of Alzheimer's disease

Affiliations

Sex specific molecular networks and key drivers of Alzheimer's disease

Lei Guo et al. Mol Neurodegener. .

Abstract

Background: Alzheimer's disease (AD) is a progressive and age-associated neurodegenerative disorder that affects women disproportionally. However, the underlying mechanisms are poorly characterized. Moreover, while the interplay between sex and ApoE genotype in AD has been investigated, multi-omics studies to understand this interaction are limited. Therefore, we applied systems biology approaches to investigate sex-specific molecular networks of AD.

Methods: We integrated large-scale human postmortem brain transcriptomic data of AD from two cohorts (MSBB and ROSMAP) via multiscale network analysis and identified key drivers with sexually dimorphic expression patterns and/or different responses to APOE genotypes between sexes. The expression patterns and functional relevance of the top sex-specific network driver of AD were further investigated using postmortem human brain samples and gene perturbation experiments in AD mouse models.

Results: Gene expression changes in AD versus control were identified for each sex. Gene co-expression networks were constructed for each sex to identify AD-associated co-expressed gene modules shared by males and females or specific to each sex. Key network regulators were further identified as potential drivers of sex differences in AD development. LRP10 was identified as a top driver of the sex differences in AD pathogenesis and manifestation. Changes of LRP10 expression at the mRNA and protein levels were further validated in human AD brain samples. Gene perturbation experiments in EFAD mouse models demonstrated that LRP10 differentially affected cognitive function and AD pathology in sex- and APOE genotype-specific manners. A comprehensive mapping of brain cells in LRP10 over-expressed (OE) female E4FAD mice suggested neurons and microglia as the most affected cell populations. The female-specific targets of LRP10 identified from the single cell RNA-sequencing (scRNA-seq) data of the LRP10 OE E4FAD mouse brains were significantly enriched in the LRP10-centered subnetworks in female AD subjects, validating LRP10 as a key network regulator of AD in females. Eight LRP10 binding partners were identified by the yeast two-hybrid system screening, and LRP10 over-expression reduced the association of LRP10 with one binding partner CD34.

Conclusions: These findings provide insights into key mechanisms mediating sex differences in AD pathogenesis and will facilitate the development of sex- and APOE genotype-specific therapies for AD.

Keywords: APOE genotype; Alzheimer’s disease; Gene co-expression network; Key driver genes; LDL receptor related protein 10 (LRP10); Sex difference.


Conflict of interest statement

All authors declared no conflict of interest.

Figures

Fig. 1
Fig. 1
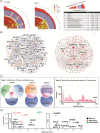
Comparison of Differential Gene Expressed Gene (DEG) Signatures between female AD and female control and between  male AD and male control. A Venn diagrams to show the numbers of DEGs identified in different groups of comparison: female AD versus female control (F_AD-F_Ctrl), male AD versus male control (M_AD-M_Ctrl), female AD versus male AD (F_AD-M_AD) and female control versus male control (F_Ctrl-M_Ctrl). Left: up-regulated DEGs; Right: down-regulated DEGs. B The most enriched functions/pathways for the DEGs identified between AD and the control in women (top) and men (middle), as well as between women and men (bottom). Functions/pathways in blue/red were enriched by the down/up-regulated genes in AD/women; X axes represented –log10 (false discovery rate: FDR). C Expression patterns of the top 15 DEGs identified in each of the four comparisons (AD versus control in each sex & female versus male in each diagnostic category). Colored bars on the left represented the DEGs identified in which comparison and whether there were overlaps among the different comparisons. Color bars on top represented the expression pattern of the genes in the corresponding sex/AD groups
Fig. 2
Fig. 2
Sex-specific Co-expression Network Modules of AD Para-hippocampal Brain Region. A The top 15 MEGENA modules (with specific module number provided in the table) most associated with AD, which were most enriched for DEGs identified between AD and the control as well as significantly correlated with AD clinical traits with multiple tracks illustrating the different properties of the modules, such as strength of correlation between modules and the neuropathological/cognitive traits and significance of module enrichment for TCGs. The table showed the traits for the tracks #1–13 (the outmost track is the overall score). The tracks #2–5 corresponded to the correlations between a module and four traits including CDR, Plaque Density, CERAD, and Braak stage. Tracks #6–13 corresponded to the enrichment of DEG signatures (based on the comparisons including Medium vs High Braak stage, Low vs High Braak stage, MCI versus AD by CDR, Normal control versus AD by CDR, Definite AD versus Normal Control by CERAD, Definite AD versus Possible AD by CERAD, High versus Low Plaque density, Medium versus Low Plaque density) in modules. B Modules that were most enriched for neuron (left) and microglia (right) marker genes in the female AD network. The pie chart of each node indicates whether it was a DEG identified between AD and the control (upper half) or between women and men (lower half). Warm colors in the pie chart represented the upregulation of the gene in AD/women; cool colors in the pie chart represented the downregulation of the gene in AD/women. Nodes with large sizes and labels were sex-biased AD-associated candidate genes identified in this study. C Procedure for identification of KND genes for female and male AD. A summary score for each KND gene was calculated based on multiple p values derived from module-traits correlation and module-DEG enrichment analyses. LRP10 was identified as the top female KND candidate gene in the PHG from the MSBB cohort using the most stringent selection criteria (Criterion 1) with the highest rank score of 0.94 among all female KND candidate genes (the range of 0–1). D The top KND genes for female AD (left) and male AD (right). These candidates had high network connectivities (y-axis) and high summary scores (x-axis) (Supplemental Tables 10–11)
Fig. 3
Fig. 3
LDLR-related protein 10 (LRP10) Identified and Validated as a Sex-specific Key Regulator of AD. A LRP10-centered 2-layer networks constructed with the female AD samples (Left) and the male AD samples (Right). The pie chart of each node indicates whether it is a DEG identified between AD and the control (upper half) or between women and men (lower half). Warm colors in the pie chart represent the upregulation of the gene in AD/women; cool colors in the pie chart represent the downregulation of the gene in AD/women. Genes with blue labels are AD risk genes from Alzgen. B Procedure of functional validation of LRP10. Levels of C lrp10 mRNA by qPCR analysis (data presented as log2FC) and D LRP10 protein by western blot (data presented as log2FC) were compared between AD versus control, male versus female, APOE4 carriers (APOE4+/-) versus non carriers (APOE3+/+) in the PHG human brain samples. ANOVA with post-hoc tests to determine group differences for multiple comparisons and independent-samples t-tests for paired comparisons. ****p < 0.0001; ***p < 0.001; *p < 0.05. E The correlation of qPCR analysis (lrp10 mRNA) versus western blot analysis (LRP10 protein) of the PHG human samples were shown
Fig. 4
Fig. 4
Characterization of AD-related Phenotypes in EFAD mice with LRP10 Over-expression (OE). A Novel Object Recognition (NOR) Studies: Preference index = (time exploring novel object)/(time exploring novel object + time exploring familiar object) and discrimination index = (time exploring novel object- time exploring familiar object)/(time exploring novel object + time exploring familiar object) in 8 groups of mice: scramble E4FAD female, LRP10 OE E4FAD female, scramble E4FAD male, LRP10 OE E4FAD male, scramble E3FAD female, LRP10 OE E3FAD female, scramble E3FAD male, and LRP10 OE E3FAD male. N = 9–15/group; *p < 0.05 with ANOVA tests. Y maze studies in 8 groups of mice: % spontaneous alternation percentage (SAP) = ({spontaneous alternation/(total number of arm entries -2)} × 100). N = 14–18/group; *p < 0.05 with ANOVA tests. B A representative image of brain section was shown with top panels scramble E4FAD female mouse brain and bottom panels LRP10 OE E4FAD female mouse brain (red: amyloid plaque staining; green: IBA1+ microglia). C Quantification of amyloid plaque burden in E4FAD female mouse hippocampus by density was measured by the size of all plaques (plaque area in mm2) in the brains of scramble (black scatter plot, each dot representing individual plaque) versus LRP10 OE (pink scatter plot) female E4FAD mice. Distribution of plaques measured by numbers of plaques in different sizes was compared between scramble versus LRP10 OE female E4FAD mouse brains as well. D Levels of IL6 and IL10 were compared between scramble versus LRP10 OE female E4FAD mice and data were presented as % of controls with the average of scramble E3FAD male mouse brain levels as 100%. N = 3–5/group; *p < 0.05 **p < 0.01 ***p < 0.001 by unpaired T-tests with Welch’s corrections
Fig. 5
Fig. 5
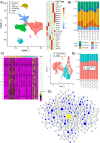
Cell-type Specific Changes in the LRP10 OE Mouse Brains. A UMAP visualization showing clustering of single cells (left) and expression patterns of the cell type marker genes in each cell type (right). B Cell type proportion analysis for six brain cell types in each experimental group. C Microglia subtypes were identified using the DAM marker genes (left). UMAP visualization showing clustering of homeostatic versus DAM subclusters (right). D Microglial subtype proportion analysis in each experimental group. E LRP10-centered gene co-expression network in the female AD human brains was enriched with DEGs identified between LRP10 OE versus control female E4FAD mouse brains. Blue nodes were the DEGs between female E4FAD mice with LRP10 OE versus control conditions. Diamond Nodes were the AD risk genes identified from previous GWAS studies
Fig. 6
Fig. 6
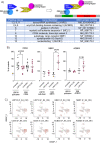
LRP10 Binding Partners. A Left: The design of the yeast two-hybrid system screening assays. Right: The summary table of eight positive hits that were identified and validated by β-galactosidase assays. B The interaction between LRP10 and its binding partner CD34, NBR1 or ACBD3 was detected by co-immunoprecipitation (co-IP) pull-down in female E4FAD mouse brains of LRP10 OE versus scramble controls. The amounts of total input (CD34, NBR1 and ACBD3) in mouse brain lysates were determined as well. C Cell type specific enrichment expression patterns of LRP10 and its binding partners (CD34, NBR1 and ACBD3) in female E4FAD mouse brains of LRP10 OE versus scramble controls

References

    1. Guo L, Zhong MB, Zhang L, Zhang B, Cai D. Sex Differences in Alzheimer's Disease: Insights From the Multiomics Landscape. Biological psychiatry. 2021. - PMC - PubMed
    1. Hebert LE, Weuve J, Scherr PA, Evans DA. Alzheimer disease in the United States (2010–2050) estimated using the 2010 census. Neurology. 2013;80(19):1778–1783. doi: 10.1212/WNL.0b013e31828726f5. - DOI - PMC - PubMed
    1. Chêne G, Beiser A, Au R, Preis SR, Wolf PA, Dufouil C, et al. Gender and incidence of dementia in the Framingham Heart Study from mid-adult life. Alzheimer's Dementia. 2015;11(3):310–320. doi: 10.1016/j.jalz.2013.10.005. - DOI - PMC - PubMed
    1. Barnes LL, Wilson RS, Bienias JL, Schneider JA, Evans DA, Bennett DA. Sex differences in the clinical manifestations of Alzheimer disease pathology. Arch Gen Psychiatry. 2005;62(6):685–691. doi: 10.1001/archpsyc.62.6.685. - DOI - PubMed
    1. Mielke MM, Vemuri P, Rocca WA. Clinical epidemiology of Alzheimer's disease: assessing sex and gender differences. Clin Epidemiol. 2014;6:37–48. doi: 10.2147/CLEP.S37929. - DOI - PMC - PubMed

Publication types