Review
. 2023 Jun 21;9(1):12.
doi: 10.1186/s42234-023-00114-5.

Remote collection of electrophysiological data with brain wearables: opportunities and challenges

Affiliations
Review

Remote collection of electrophysiological data with brain wearables: opportunities and challenges

Richard James Sugden et al. Bioelectron Med. .

Abstract

Collection of electroencephalographic (EEG) data provides an opportunity to non-invasively study human brain plasticity, learning and the evolution of various neuropsychiatric disorders. Traditionally, due to sophisticated hardware, EEG studies have been largely limited to research centers which restrict both testing contexts and repeated longitudinal measures. The emergence of low-cost "wearable" EEG devices now provides the prospect of frequent and remote monitoring of the human brain for a variety of physiological and pathological brain states. In this manuscript, we survey evidence that EEG wearables provide high-quality data and review various software used for remote data collection. We then discuss the growing body of evidence supporting the feasibility of remote and longitudinal EEG data collection using wearables including a discussion of potential biomedical applications of these protocols. Lastly, we discuss some additional challenges needed for EEG wearable research to gain further widespread adoption.

Keywords: Diagnostics; Electroencephalography; Neuropathology; Remote medicine; Wearable devices.


Conflict of interest statement

The authors declare that they have no competing interests.

Figures

Fig. 1
Fig. 1
Comparison of EEG data collection hardware. (A) shows (left to right): a typical medical EEG setup with a high density of wired electrodes; a research-grade wearable cap with wireless electrodes; a research-grade Quick-32r headset; a research-grade EPOC X wearable with 14 electrodes; and a Muse 2 consumer-grade wearable with 4 recording electrodes. (B) shows a column of EEG wearables (top to bottom: Muse 2, Neurosity Crown (Introducing the Crown | Neurosity ; This ‘Personal Brain Computer’ Boosts Productivity By Sensing Your Brainwaves And Playing Music From Spotify, 2021), EPOC X, Quick-32r). Examples of additional wearables available on the market (not shown above) include: BrainBit(Wearable EEG headband – BrainBit, 2022) (EEG headband with 4 recording electrodes), Neurosky MindWave (Rieiro et al. 2019) (single electrode EEG wearable), and Neuroon (Liang and Chapa Martell 2018) (EEG wearable sleep mask). (C) shows an overview of the: number of sensors, common applications, EEG characteristics, and outcomes that are commonly related (but not limited) to each grade of EEG hardware
Fig. 2
Fig. 2
Examples of raw EEG data collected from consumer-grade wearables. (A) Raw EEG data collected from a consumer-grade 4-electrode Muse 2 wearable. X axis represents time and Y axis shows electrode labels. AF and TP are labels for the data collected by anterior-frontal and temporoparietal electrodes, respectively. The scale is shown by the red line representing 160 microvolts of amplitude. Large spikes are likely to be a result of ocular and muscular artifacts. (B) Raw EEG data collected from a research-grade 14-electrode EPOC X wearable. Time is shown on the X axis and electrode labels on the Y axis (international 10–20 system)
Fig. 3
Fig. 3
Example of a P300 event-related potential collected from an oddball task. The X axis shows the time in seconds with 0 s coinciding with stimuli presentation (dotted line). Y axis shows the EEG signal amplitude in microvolts. Blue and orange lines represent an average of EEG waves evoked by rarely occurring target stimuli (e.g. visual or auditory cue) and an average of EEG waves evoked by commonly occurring standard stimuli, respectively. Observing differences between the target and standard data reveals two characteristic waveforms, a positive spike at 300 ms (P300) preceded by a negative spike at approximately 200 ms (N200)
Fig. 4
Fig. 4
Spectrogram data collected from an EEG consumer wearable. This shows spectrogram data from 2 electrodes of a Muse 2 wearable connected to the Mind Monitor smartphone app (Mind Monitor 2022). Frequencies of EEG waves are shown on the horizontal axis. Time is on the vertical axis starting after zero seconds from the top. Power of the EEG signal for each frequency is encoded by color. Note that color bars are not available in Mind Monitor software so the spectrogram should be interpreted qualitatively. Colors are from high to low power in the following order: red, orange, yellow, green, cyan, blue. A spike in power can be observed earlier in the recording from approximately 0–24 Hz, likely due to an ocular or muscular artifact
Fig. 5
Fig. 5
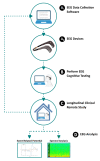
Methodology for remote data collection with consumer EEG wearables. A potential workflow for a remote data collection protocol. First, a laptop or other smart device with software (Ai) that can connect to and receive data from an EEG wearable (Aii) is required. A participant would then attend an initial in-lab demonstration on how to navigate the software to simultaneously perform EEG recordings with cognitive tests (B) of interest. The devices are then taken home for remote longitudinal data collection (C) with sessions as frequent as for example, weekly, bidaily, or even daily. Once collection is completed, devices are returned to the lab for analyses of EEG features, such as event-related potentials or changes in power bands and spectrographic data (D). Remote transfer of data is also a potential additional feature with increased data encryption and security measures

Similar articles

Cited by

References

    1. Arnal PJ, Thorey V, Debellemaniere E, Ballard ME, Hernandez AB, Guillot A, et al. The Dreem Headband compared to polysomnography for electroencephalographic signal acquisition and sleep staging. Sleep. Volume 43. Oxford University Press; 2020. pp. 1–13. 11. - PMC - PubMed
    1. Badcock NA, Mousikou P, Mahajan Y, De Lissa P, Thie J, McArthur G. Validation of the Emotiv EPOC® EEG gaming systemfor measuring research quality auditory ERPs. PeerJ. 2013;2013(1). - PMC - PubMed
    1. Badcock NA, Preece KA, deWit B, Glenn K, Fieder N, Thie J, et al. Validation of the Emotiv EPOC EEG systemfor research quality auditory event-related potentials in children. PeerJ. Volume 2015. PeerJ Inc.; 2015. p. e907. 3. - PMC - PubMed
    1. Barbey FM, Farina FR, Buick AR, Danyeli L, Dyer JF, Islam MN et al. Neuroscience from the comfort of your home: repeated, self-administered wireless dry EEG measures brain function with high fidelity. Front Digit Health Front Digit Health; 2022;4. - PMC - PubMed
    1. Baum U, Baum AK, Deike R, Feistner H, Markgraf B, Hinrichs H, et al. Feasibility assessment of patient-controlled EEG home-monitoring: more results from the HOMEONE study. Clin Neurophysiol Clin Neurophysiol. 2022;140:12–20. doi: 10.1016/j.clinph.2022.04.021. - DOI - PubMed

LinkOut - more resources