. 2023 Jun 20;11(1):100.
doi: 10.1186/s40478-023-01598-7.

Pathological ultrastructural alterations of myelinated axons in normal appearing white matter in progressive multiple sclerosis

Affiliations

Pathological ultrastructural alterations of myelinated axons in normal appearing white matter in progressive multiple sclerosis

Wendy Oost et al. Acta Neuropathol Commun. .

Abstract

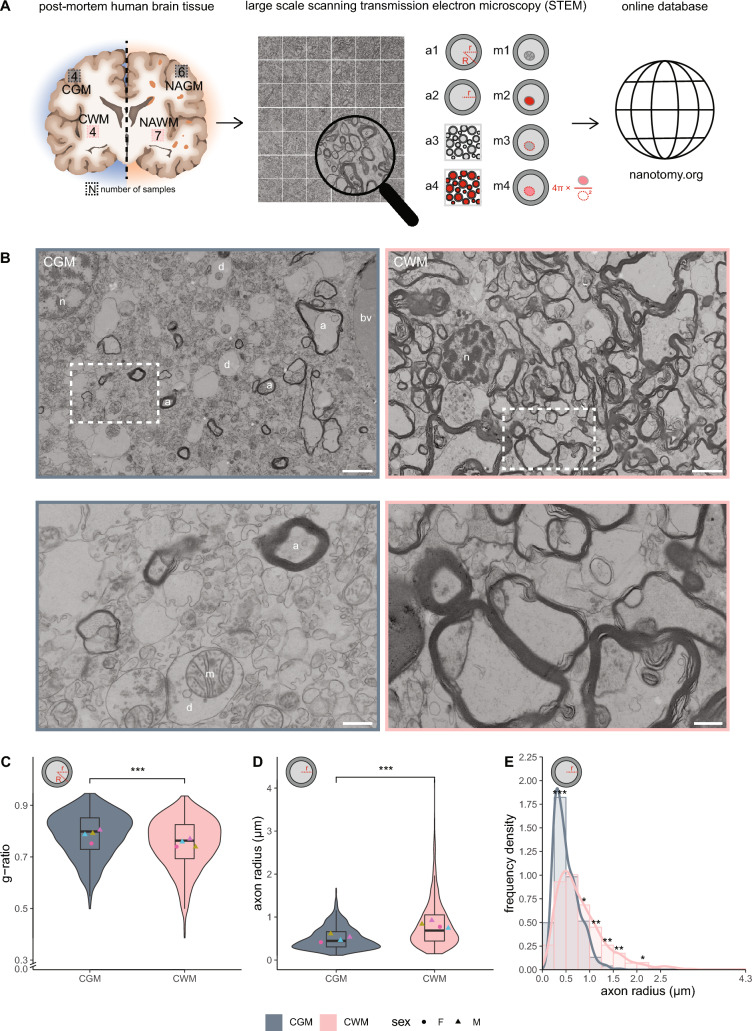
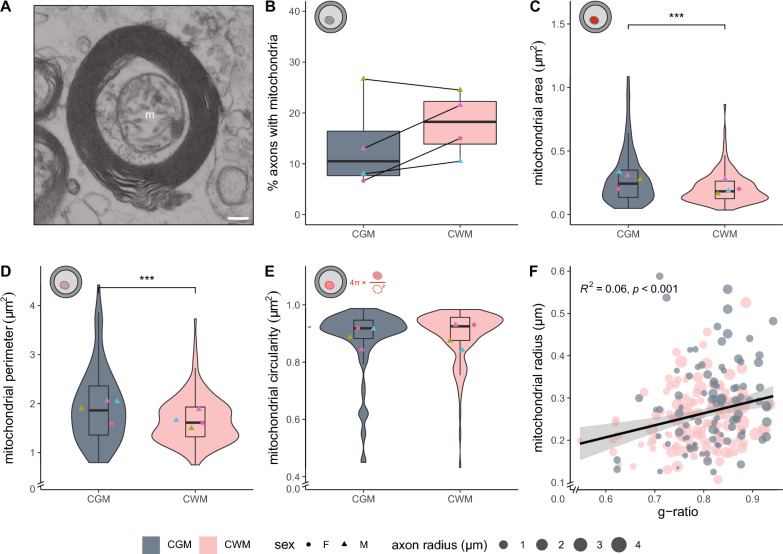
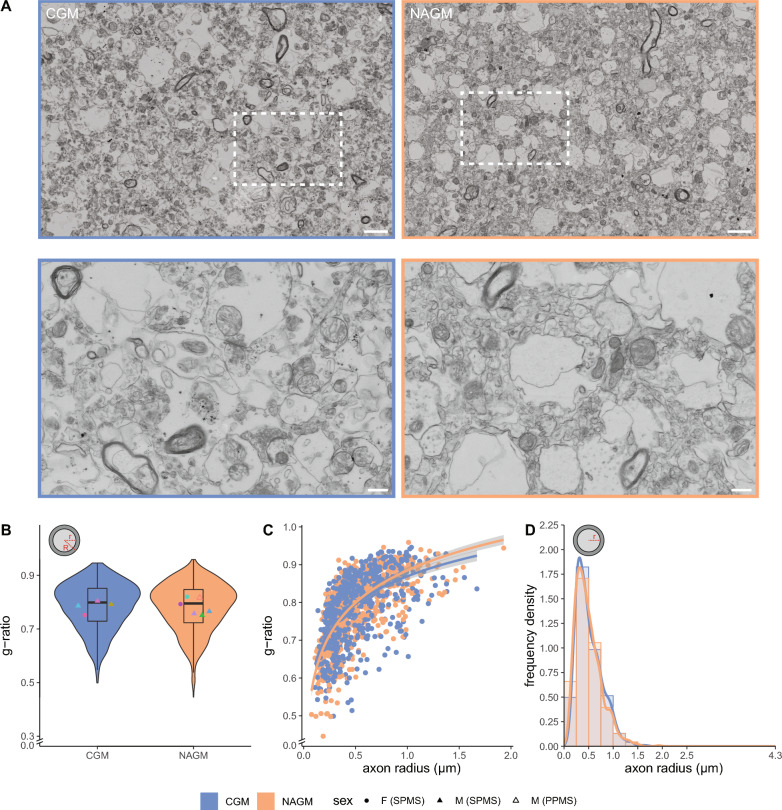
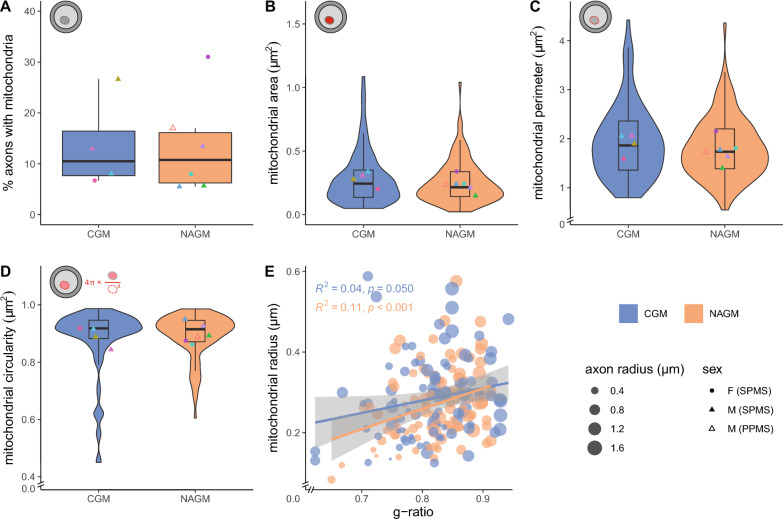
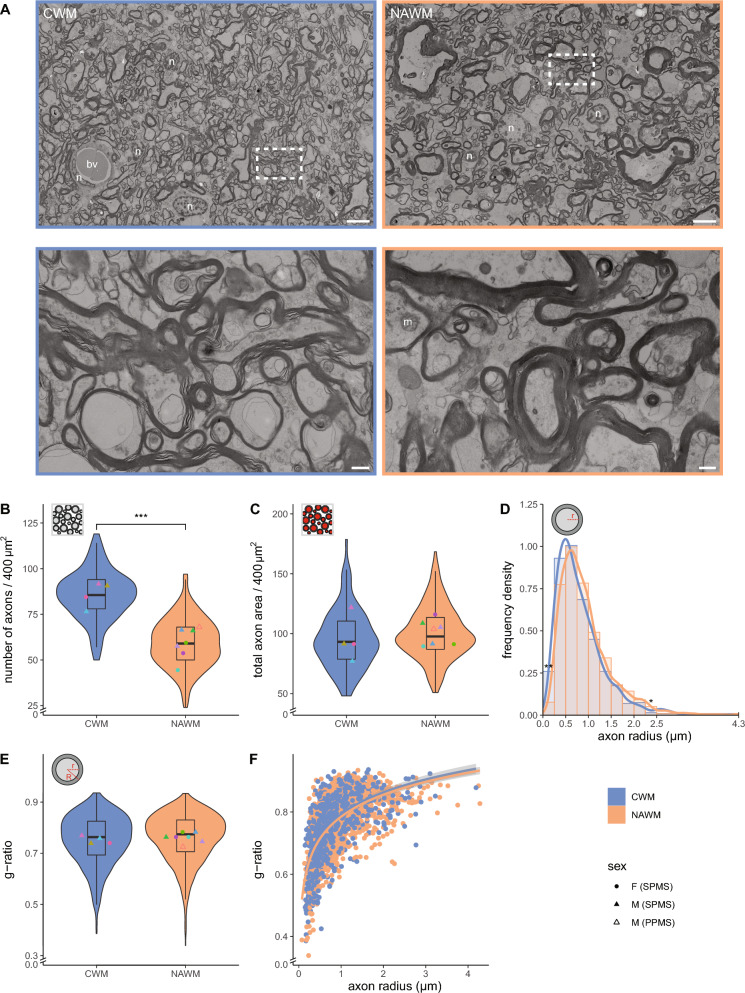
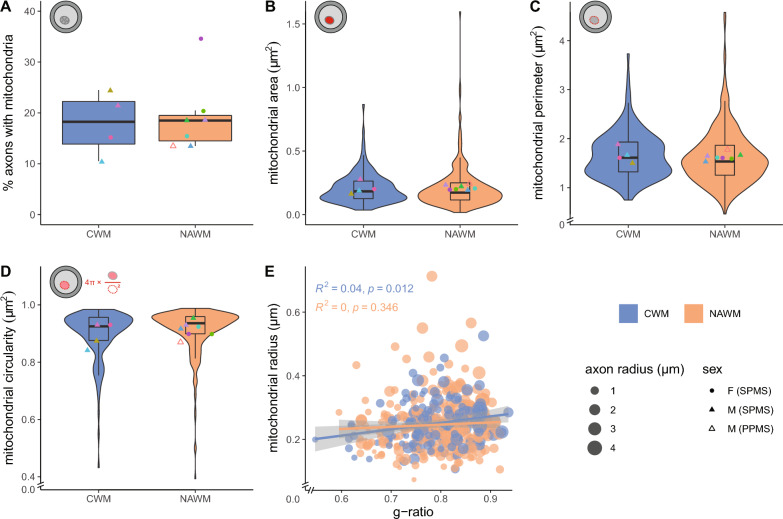
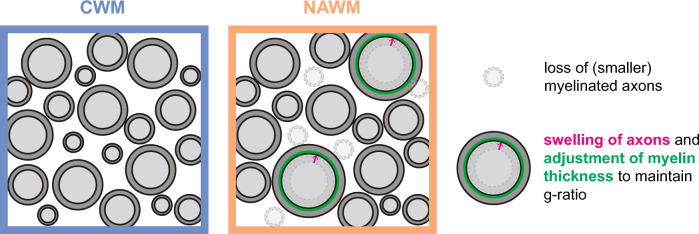
Multiple sclerosis (MS) pathophysiology includes inflammation, demyelination and neurodegeneration, but the exact mechanisms of disease initiation and progression are unknown. A major feature of lesions is lack of myelin, which increases axonal energy demand and requires adaptation in number and size of mitochondria. Outside lesions, subtle and diffuse alterations are observed in normal appearing white matter (NAWM) and normal appearing grey matter (NAGM), including increased oxidative stress, reduced axon density and changes in myelin composition and morphology. On an ultrastructural level, only limited data is available on alterations in myelinated axons. We generated large scale 2D scanning transmission electron microscopy images ('nanotomy') of non-demyelinated brain tissue of control and progressive MS donors, accessible via an open-access online repository. We observed a reduced density of myelinated axons in NAWM, without a decrease in cross-sectional axon area. Small myelinated axons were less frequently and large myelinated axons were more frequently present in NAWM, while the g-ratio was similar. The correlation between axonal mitochondrial radius and g-ratio was lost in NAWM, but not in NAGM. Myelinated axons in control GM and NAGM had a similar g-ratio and radius distribution. We hypothesize that axonal loss in NAWM is likely compensated by swelling of the remaining myelinated axons and subsequent adjustment of myelin thickness to maintain their g-ratio. Failure of axonal mitochondria to adjust their size and fine-tuning of myelin thickness may render NAWM axons and their myelin more susceptible to injury.

Keywords: Electron microscopy; Human brain (bank); Mitochondria; Multiple sclerosis; Myelin; Nanotomy; Ultrastructure; g-ratio.


Conflict of interest statement

The authors declare that they have no competing interests.

Figures

Fig. 1
Fig. 1
Myelinated axons in CWM have a lower g-ratio and a higher axon radius than in CGM. A Experimental set-up. Post-mortem human brain tissue samples were collected from control donors and donors with progressive MS and processed for large-scale scanning transmission electron microscopy (STEM). Datasets were analysed for ultrastructural features of myelinated axons (a1: g-ratio (r/R), a2: radius (r), a3: density; a4: total area) and their mitochondria (m1: number, m2: area, m3: perimeter, m4: circularity). Each dataset is accessible in full resolution via nanotomy.org. B Representative STEM images of post-mortem control grey matter (CGM) and control white matter (CWM) tissue of control donors (paired, from donor CM 1). Top: overview images. Bottom: detailed images from boxed regions in top images. a = myelinated axon, d = dendrite, n = nucleus, bv = blood vessel, m = mitochondria. Scale bar represents 2 µm (top images) or 0.5 µm (bottom images). C, D Violin plots depicting the distribution of g-ratio (C) and axon radius (D). Datapoints represent mean per donor (● = female, ▲ = male, color-coded, see Table 1) and boxplots show the median and inter quartile range (IQR). E Histogram with kernel density estimation of the axon radius (r). Number of control (CGM/CWM) donors is 4 (paired). For CGM 100–200 myelinated axons and for CWM 200 myelinated axons per donor were analysed. Statistics were performed using linear mixed model (C, D), or a paired sample Student’s t test (E) (*p < 0.05; **p < 0.01; ***p < 0.001)
Fig. 2
Fig. 2
Mitochondrial size in myelinated axons correlates with g-ratio in control brain tissue. A Cross-sectional image of a myelinated axon with a mitochondrion (m) in post-mortem brain tissue of control donors. Scale bar represents 0.2 µm. B Mean percentage myelinated axons with mitochondria in post-mortem control grey matter (CGM) and control white matter (CWM) tissue of control donors. CE Analysis of cross-sectional axonal mitochondrial area (C), perimeter (D), and circularity (E). Icons indicate measured mitochondrial characteristic (red), violin plots depict the data distribution of all measurements, datapoints represent mean per donor (● = female, ▲ = male, color-coded, see Table 1), and boxplots show the median and inter quartile range (IQR). F Scatter plot showing the correlation between mitochondria radius and g-ratio. The size of the datapoints indicates axon radius in µm. The number of control (CGM/CWM) donors is 4 (paired) and 10–49 mitochondria per donor were analysed (dependent on the number of mitochondria in the 100–200 myelinated axons that were measured in Fig. 1). Statistics were performed using a paired Student’s t test (B), linear mixed model (CE), or a Pearson’s r test (F) (***p < 0.001)
Fig. 3
Fig. 3
Myelinated axons in CGM and NAGM have a similar g-ratio and axon size distribution. A Representative scanning electron microscopic images (STEM) images of post-mortem control grey matter (CGM) of control donors (from donor CM 2) and normal appearing grey matter (NAGM) of donors with progressive MS (from donor NAM 6). Top: overview images. Bottom: detailed images from boxed regions in top images. Scale bars represent 2 µm (top images) or 0.5 µm (bottom images). B Violin plots depict the distribution of g-ratio (r/R). Datapoints represent mean per donor (● = female (SPMS), ▲ = male (SPMS), △ = male (PPMS), color-coded, see Table 1) and boxplots show the median and inter quartile range (IQR). C Scatter plot showing the g-ratio versus axon radius (log-linear fit). D Histogram with kernel density estimation of the axon radius (r). Number of control donors (CWM) is 4, number of donors with progressive MS (NAWM) is 6, and 100–200 myelinated axons per donor were analysed. Statistics were performed using a linear mixed model (B) or unpaired Student’s t test (D)
Fig. 4
Fig. 4
Axonal mitochondrial size correlates with g-ratio in NAGM. A Mean percentage myelinated axons with mitochondria in post-mortem control grey matter (CGM) of control donors and normal appearing grey matter (NAGM) tissue of donors with progressive MS. BD Analysis of cross-sectional axonal mitochondrial area (B), perimeter (C), and circularity (D). Icons indicate measured mitochondrial characteristics (red), violin plots depict the data distribution of all measurements, datapoints represent mean per donor (● = female (SPMS), ▲ = male (SPMS), △ = male (PPMS), color-coded, see Table 1), and boxplots show the median and inter quartile range (IQR). E Scatter plot showing the correlation between mitochondria radius and g-ratio. The size of the datapoints indicates the axon radius in µm. Number of control donors (CGM) is 4, number of donors with progressive MS (NAGM) is 6, and 6–40 mitochondria per donor (dependent on the number of mitochondria in the 100–200 axons that were measured in Fig. 3) were analysed. Statistics were performed using an unpaired Student’s t test (A), linear mixed model (BD), or a Pearson’s r test (E)
Fig. 5
Fig. 5
Reduced myelinated axon density in NAWM, while total myelinated axon area and g-ratio are unaffected. A Representative scanning transmission electron microscopic images (STEM) images of post-mortem control white matter (CGM) of control donors (from donor CM 1) normal appearing white matter (NAWM) of donors with progressive MS (from donor NAM 6). Top: overview images. Bottom: detailed images from boxed regions in top images. n = nucleus, bv = blood vessel, m = mitochondria. Scale bars represent 5 µm (top images) or 0.5 µm (bottom images). B, C Violin plots depict the number of myelinated axons (B) and their total area (C, red) in an area of 20 × 20 µm. D Histogram with kernel density estimation of the axon radius (r). E Violin plot depicts the distribution of g-ratio (r/R). Datapoints represent mean per donor (B, C, E ● = female (SPMS), ▲ = male (SPMS), △ = male (PPMS), color-coded, see Table 1) and boxplots show the median and inter quartile range (IQR). F Scatter plot showing the g-ratio versus axon radius (log-linear fit). Number of control donors (CWM) is 4, number of donors with progressive MS (NAWM) is 7, 200 myelinated axons per donor (DF), and 25 areas of 20 × 20 µm (B, C) were analysed. Statistics were performed using an unpaired Student’s t test (D), or a linear mixed model (B, C, E) (*p < 0.05; **p < 0.01; ***p < 0.001)
Fig. 6
Fig. 6
Axonal mitochondrial size does not correlate with g-ratio in NAWM. A Mean percentage myelinated axons with mitochondria in post-mortem control white matter (CWM) of control donors and normal appearing white matter (NAWM) tissue of progressive MS donors. BD Analysis of cross-sectional axonal mitochondrial area (B), perimeter (C), and circularity (D). Icons indicate measured mitochondrial characteristics (red), violin plots depict the data distribution of all measurements, datapoints represent the mean per donor (● = female (SPMS), ▲ = male (SPMS), △ = male (PPMS), color-coded, see Table 1) and boxplots show the median and inter quartile range (IQR). E Scatter plot showing the correlation between mitochondria radius and g-ratio. The size of the datapoints indicates the axon radius in µm. Number of control donors (CWM) is 4, number of donors with progressive MS (NAWM) is 7, and 21–69 mitochondria per donor (dependent on the number of mitochondria in the 200 myelinated axons that were measured in Fig. 5) were analysed. Statistics were performed using an unpaired Student’s t test (A), linear mixed model (BD), or a Pearson's r test (E)
Fig. 7
Fig. 7
Hypothetical model explaining myelinated axon pathology in normal appearing white matter (NAWM) based on the observed ultrastructural abnormalities in myelinated axons. We argue that a loss of small calibre myelinated axons in NAWM of persons with progressive MS results in a lower myelinated axon density. To compensate for the loss of myelinated axons, remaining axons swell (pink arrow) to increase their size to cover a similar axon area. The swelled axons adjust their myelin thickness (green), explaining the unaltered g-ratio, to preserve axonal shape and limit further swelling

Similar articles

Cited by

References

    1. Miller DH, Thompson AJ, Filippi M. Magnetic resonance studies of abnormalities in the normal appearing white matter and grey matter in multiple sclerosis. J Neurol. 2003;250:1407–1419. doi: 10.1007/S00415-003-0243-9. - DOI - PubMed
    1. Griffin CM, Chard DT, Parker GJM, et al. The relationship between lesion and normal appearing brain tissue abnormalities in early relapsing remitting multiple sclerosis. J Neurol. 2002;249:193–199. doi: 10.1007/PL00007864. - DOI - PubMed
    1. Ramió-Torrentà L, Sastre-Garriga J, Ingle GT, et al. Abnormalities in normal appearing tissues in early primary progressive multiple sclerosis and their relation to disability: a tissue specific magnetisation transfer study. J Neurol Neurosurg Psychiatry. 2006;77:40. doi: 10.1136/JNNP.2004.052316. - DOI - PMC - PubMed
    1. Klaver R, Popescu V, Voorn P, et al. Neuronal and axonal loss in normal-appearing gray matter and subpial lesions in multiple sclerosis. J Neuropathol Exp Neurol. 2015;74:453–458. doi: 10.1097/NEN.0000000000000189. - DOI - PubMed
    1. Evangelou N, Esiri MM, Smith S, et al. Quantitative pathological evidence for axonal loss in normal appearing white matter in multiple sclerosis. Ann Neurol. 2000;47:391–395. doi: 10.1002/1531-8249(200003)47:3<391::AID-ANA20>3.0.CO;2-J. - DOI - PubMed

Publication types