. 2023 Aug 2;31(8):2524-2542.
doi: 10.1016/j.ymthe.2023.06.010. Epub 2023 Jun 19.

Smoking and tetramer tryptase accelerate intervertebral disc degeneration by inducing METTL14-mediated DIXDC1 m6 modification

Affiliations

Smoking and tetramer tryptase accelerate intervertebral disc degeneration by inducing METTL14-mediated DIXDC1 m6 modification

Ji Tu et al. Mol Ther. .

Abstract

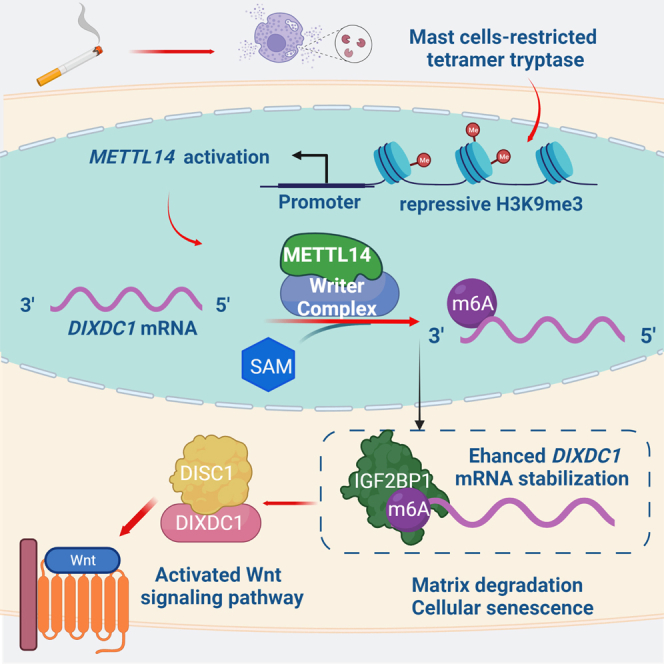
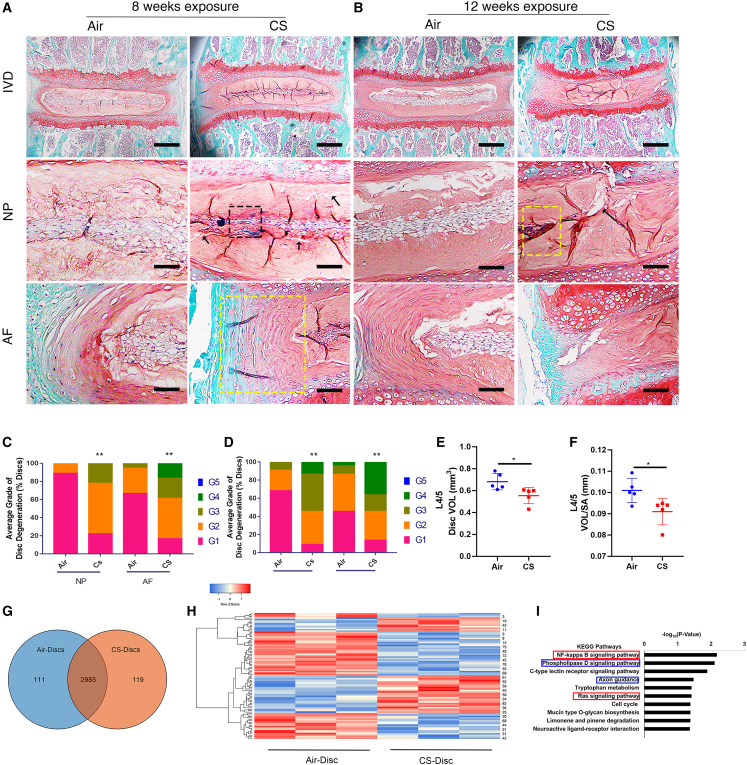
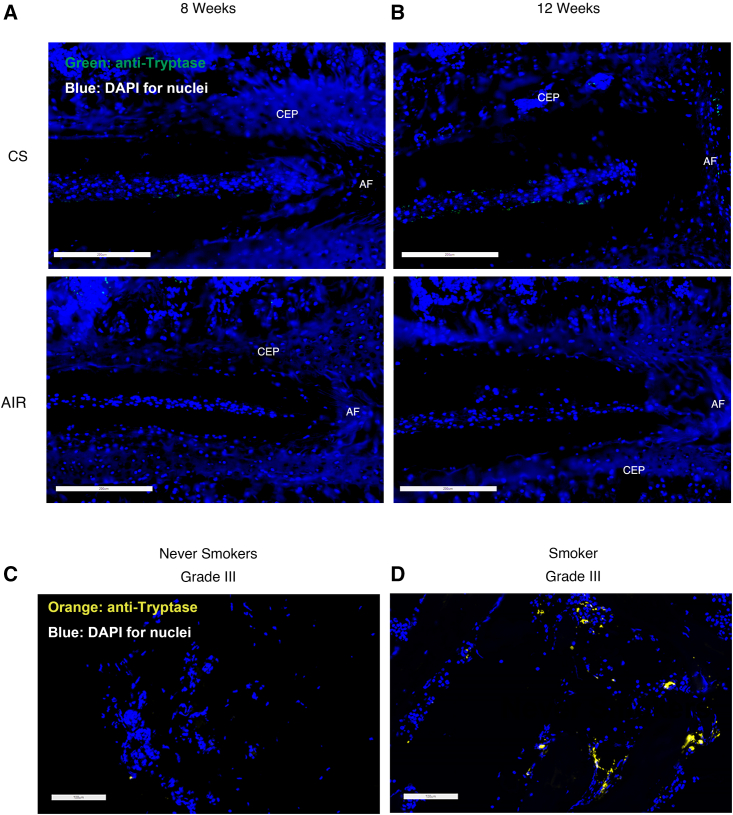
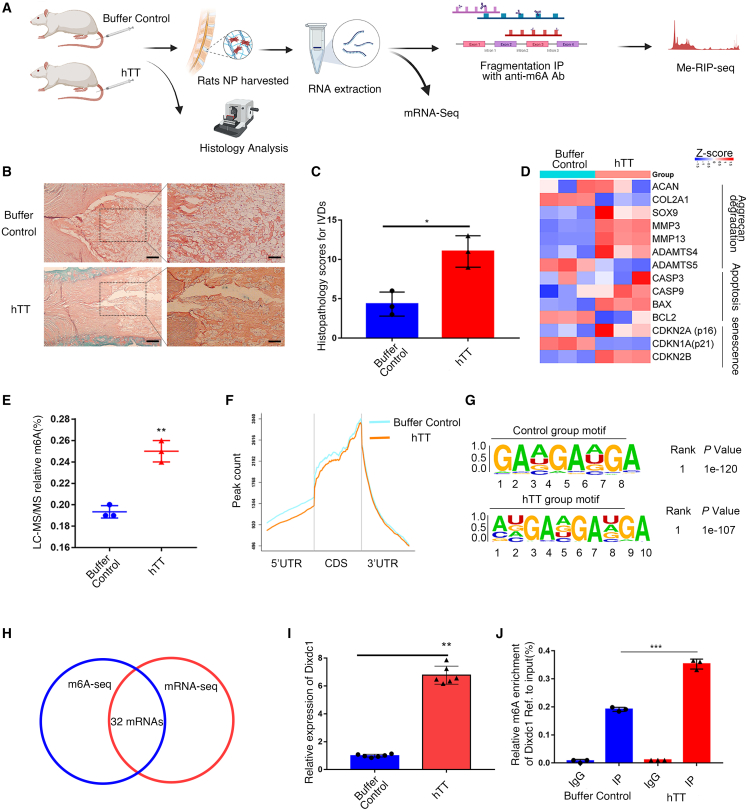
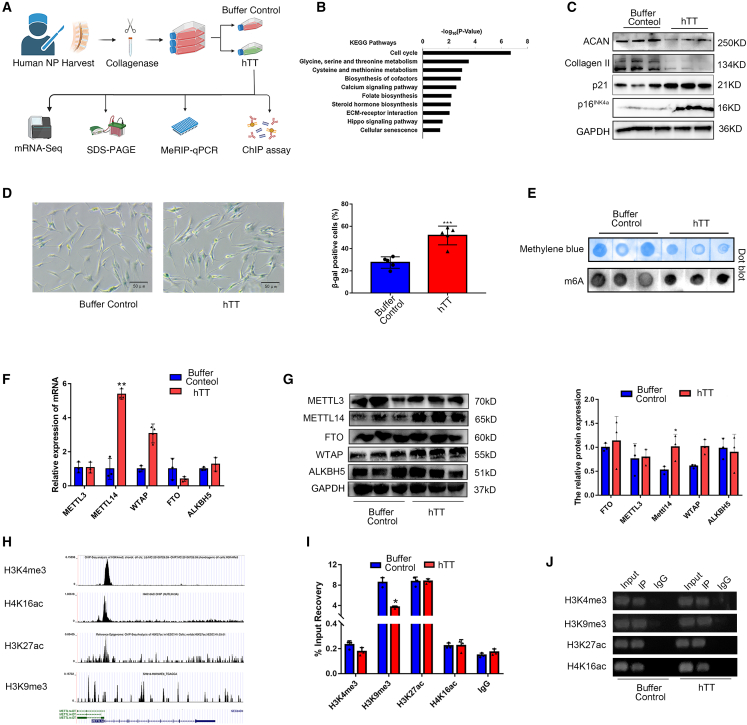
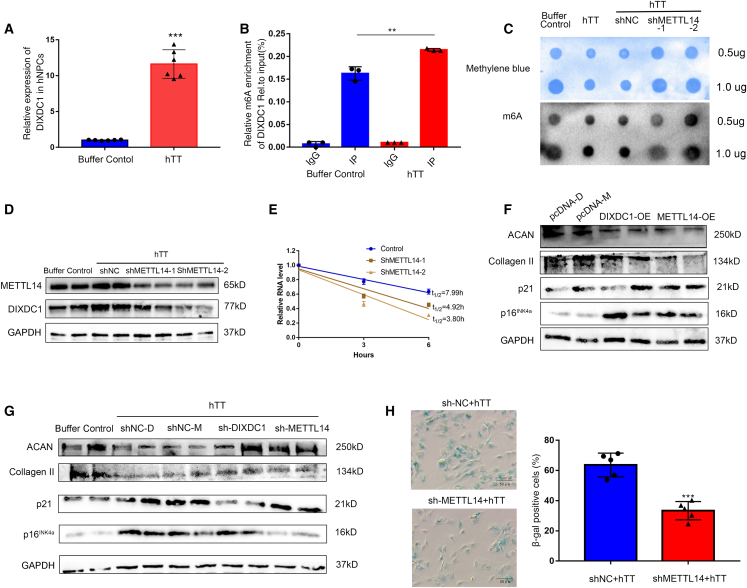
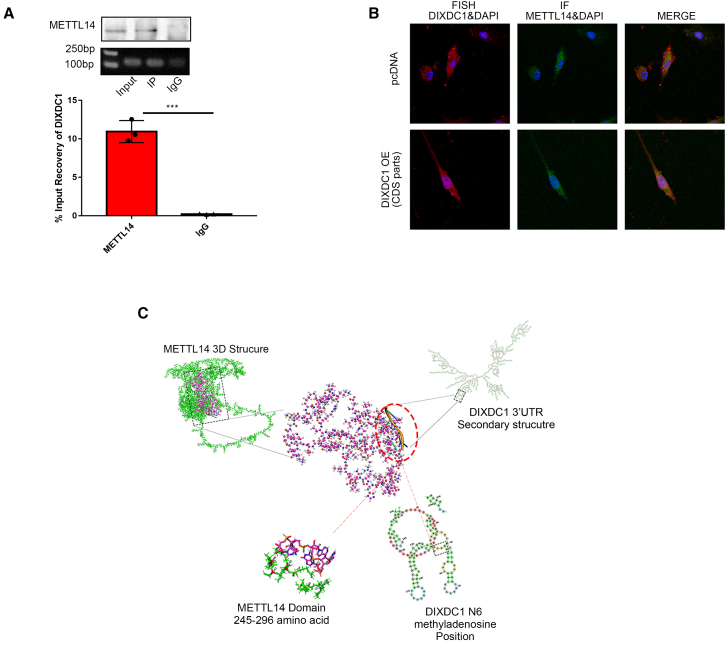
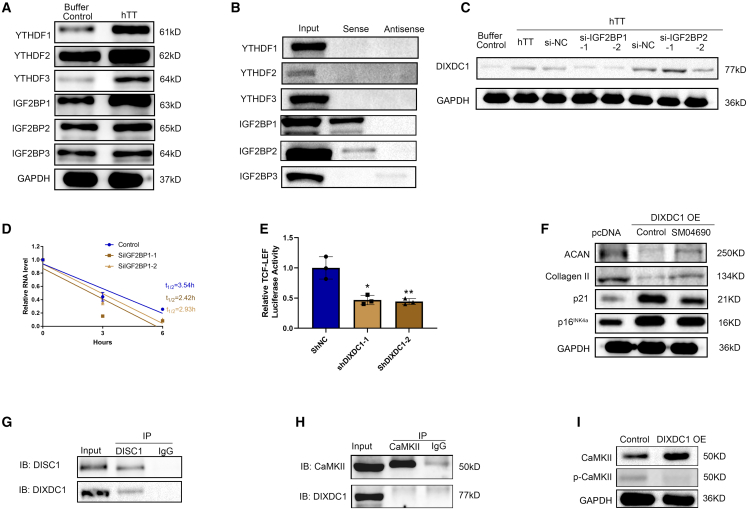
Although cigarette smoking (CS) and low back pain (LBP) are common worldwide, their correlations and the mechanisms of action remain unclear. We have shown that excessive activation of mast cells (MCs) and their proteases play key roles in CS-associated diseases, like asthma, chronic obstructive pulmonary disease (COPD), blood coagulation, and lung cancer. Previous studies have also shown that MCs and their proteases induce degenerative musculoskeletal disease. By using a custom-designed smoke-exposure mouse system, we demonstrated that CS results in intervertebral disc (IVD) degeneration and release of MC-restricted tetramer tryptases (TTs) in the IVDs. TTs were found to regulate the expression of methyltransferase 14 (METTL14) at the epigenetic level by inducing N6-methyladenosine (m6A) deposition in the 3' untranslated region (UTR) of the transcript that encodes dishevelled-axin (DIX) domain-containing 1 (DIXDC1). That reaction increases the mRNA stability and expression of Dixdc1. DIXDC1 functionally interacts with disrupted in schizophrenia 1 (DISC1) to accelerate the degeneration and senescence of nucleus pulposus (NP) cells by activating a canonical Wnt pathway. Our study demonstrates the association between CS, MC-derived TTs, and LBP. These findings raise the possibility that METTL14-medicated DIXDC1 m6A modification could serve as a potential therapeutic target to block the development of degeneration of the NP in LBP patients.

Keywords: intervertebral disc; low back pain; mast cells; smoking; spine.


Conflict of interest statement

Declaration of interests The authors declare no competing interests.

Figures

None
Graphical abstract
Figure 1
Figure 1
CS-exposed mouse IVDs showed accelerated structural degeneration (A and B) Safranin O/fast green staining of coronal sections of IVDs from mice exposed to air or CS for 8 or 12 weeks (top row: scale bars, 200 μm; center row: scale bars, 50 μm; bottom row: scale bars, 50 μm). High-magnification views of NP and AF tissue are arranged below the IVD images for each group. (C and D) Histological grading using the modified Thompson scale, showing significant differences between air- and CS-exposed mice in the proportion of degenerated NP and AF at 8 and 12 weeks. Data were collected from 3 discs per mouse (n = 6 mice per group). Ridit analysis was performed. ∗∗p ≤ 0.01. (E and F) Micro-CT revealed changes in IVD structure between mice exposed to air or CS. Parameters included disc volume (VOL) and VOL/surface area at the L4/5 level after 8 weeks of air or CS exposure; n = 5 for each group, ∗p ≤ 0.05. Statistical analyses were performed with Student’s t test. (G) Venn diagram showing the numbers of proteins identified from IVD samples (FDR < 0.01, unique peptides ≥2). The cross-section shows the number of common proteins between IVDs from air- and CS-exposed mice, while the two sides show the numbers of uniquely expressed proteins. (H) Heatmap showing the hierarchical clustering of differentially expressed proteins (DEPs; p < 0.05) between IVDs from air- and CS-exposed mice. Protein abundance is expressed using a standardized scale ranging from −2 to 2. High expression of a given pathway is marked with red, while low expression is marked with blue. White indicates intermediate expression. (I) KEGG analysis showing the top 10 enriched signaling pathways in IVDs from CS-exposed mice.
Figure 2
Figure 2
Elevated TT in the IVDs of CS-exposed mice and patients with IVDD who smoke (A and B) IF staining for mMCP-6 in IVDs from mice exposed to air or CS for 8 weeks and 12 weeks. Levels of mMCP-6 are shown in green, and nuclei/DAPI are shown in blue. Scale bars, 200 μm. (C and D) The expression of tryptase is shown in orange, and nuclei/DAPI are shown in blue. Scale bars, 100 μm.
Figure 3
Figure 3
hTT induces NP degeneration and mRNA methylation of the NP in vivo (A) Graphical representation of the experimental workflow. (B) Representative image of safranin O/fast green staining of hTT/control-injected IVDs. (C) Histological grading scale for safranin O/fast green staining. (D) Heatmap showing mRNA expression for genes related to IVD degeneration in NPs from hTT/control-injected IVDs. (E) LC/MS-MS assay was used to measure the m6A level for mRNA of NPs from hTT/control-injected IVDs. Data are shown as the mean ± SD, n = 3. ∗∗p < 0.01, two-tailed unpaired Student’s t test. (F) Distribution of m6A peaks across the start codon, CDS, and stop codon of mRNA transcripts. The moving averages of NPs from hTT-injected IVDs (red) and that from buffer control-injected IVDs peak percentage (blue) are shown. (G) Top consensus motif identified DREME with m6A-seq in NPs from hTT/control injected IVDs. (H) A Venn diagram was generated from the gene sets enriched for transcripts that were substantially altered for mRNA-seq along with those enriched for m6A-modified transcripts (m6A-seq). (I) The mRNA level of DIXDC1 in NPs from hTT/control-injected IVDs. Data are shown as the mean ± SD, n = 3. ∗∗p < 0.01, two-tailed unpaired Student’s t test. (J) m6A modification of DIXDC1 was detected by MeRIP-qPCR analysis using anti-IgG and anti-m6A Abs. Relative m6A enrichment of DIXDC1 mRNA for each IP group was normalized to input. Data are shown as the mean ± SD, n = 3. ∗∗∗p < 0.001, two-tailed unpaired Student’s t test.
Figure 4
Figure 4
hTT induced human NPC degeneration and mRNA methylation by removing the repressive mark H3K9me3 at the METTL14 promoter (A) Graphical representation of the hNPC experimental workflow. (B) Top 10 significantly enriched KEGG pathways of hTT-treated hNPCs. (C) Expression of the anabolic proteins ACAN and collagen II and the cell senescence proteins p21 and p16INK4a in hNPCs treated with hTT and buffer control. (D) Representative image and quantification of SA-β-gal staining in hNPCs treated with hTT and buffer control. Data are shown as the mean ± SD, n = 5. ∗∗p < 0.01, two-tailed unpaired Student’s t test. (E) The m6A level alterations after hTT treatment were measured by m6A RNA dot blot assay. (F) The mRNA levels of m6A readers and writers in hTT-treated hNPCs were measured using qRT-PCR. Data are shown as the mean ± SD, n = 3. ∗∗p < 0.01, two-tailed unpaired Student’s t test. (G) The protein levels of m6A readers and writers in hTT treated hNPCs were measured using SDS-PAGE immunoblotting. Right: quantification of SDS-PAGE immunoblot results from (G). (H) Snapshots of the UCSC genome browser, showing METTL14-binding histone epigenetic modification events at its promoters. (I and J) Enrichment for H3K4me3, H4K16ac, H3K27ac, and H3K9me3 modifications was assessed by ChIP qPCR on METTL14. Data are shown as the mean ± SD, n = 3. ∗p < 0.05, two-tailed unpaired Student’s t test.
Figure 5
Figure 5
hTT induced hNPCs degeneration via METTL14-mediated DIXDC1 upregulation (A)The mRNA levels of DIXDC1 in hTT-treated hNPCs were measured using qRT-PCR. Data are shown as the mean ± SD, n = 6. ∗∗∗p < 0.001, two-tailed unpaired Student’s t test. (B) MeRIP qRT-PCR was used to detect m6A level alterations of DIXDC1 after hTT treatment in hNPCs. Data are shown as the mean ± SD, n = 3. ∗∗p < 0.005, two-tailed unpaired Student’s t test. (C) The m6A content of total RNAs in buffer control-treated, hTT-treated, shNC, and METTL14 knockdown hNPCs (left panel) was detected using a dot blot with an m6A Ab. Methylene blue staining served as the loading control (right panel). (D) The protein levels of METTL14 and DIXDC1 in hTT-treated hNPCs with or without METTL14 knockdown were measured using SDS-PAGE immunoblot. (E) Lifespan of DIXDC1 expression in hTT-treated hNPCs transfected with the reduction of METTL3. Relative mRNA levels were quantified by qRT-PCR. Data are shown as the mean ± SD, n = 6. (F) Expression of the anabolic proteins ACAN, collagen II, and SOX9 and the cell senescence proteins p21 and p16INK4a in hNPCs treated with DIXDC1 or METTL14 OE. (F) Expression of the anabolic proteins ACAN and collagen II and the cell senescence proteins p21 and p16INK4a in hNPCs treated with DIXDC1 or METTL14 OE. (G) Expression of the anabolic proteins ACAN and collagen II and the cell senescence proteins p21 and p16INK4a in hNPCs treated with hTT with or without DIXDC1 or METTL14 knockdown. (H) Representative image and quantification of SA-β-gal staining in hNPCs treated with hTT or hTT + METTL14 knockdown. Data are shown as the mean ± SD, n = 5. ∗∗∗p < 0.001, two-tailed unpaired Student’s t test.
Figure 6
Figure 6
Biochemical characterization of interaction between DIXDC1 and METTL14 protein (A) RIP assays for METTL14 were performed, and the coprecipitated RNA was subjected to qRT-PCR for DIXDC1 (top panel). Agarose electrophoresis of PCR products is shown on the right. Experiments were performed in triplicate, and data are presented as mean ± SD. ∗∗∗p < 0.001. (B) hNPCs were transfected with pcDNA-DIXDC1. The colocalization of METTL14 and DIXDC1 mRNA in hNPCs was examined by in situ hybridization using a fluorescently labeled DIXDC1 mRNA-specific probe, followed by immunocytochemistry with anti-METTL14 Abs and nuclei stained with DAPI. The distribution of DIXDC1 mRNA is shown in red, and METTL14 is shown in green. (C) Visualization of the interaction between the 3D structure of METTL14 (calculated by Rosetta) and the secondary structure of the 3′ UTR of DIXDC1 (calculated by Alphafold).
Figure 7
Figure 7
hTT enhances the stability and half-life of DIXDC1 mRNA via IGF2BP1 and activation of the Wnt pathway (A)The protein levels of “readers” in hTT- or control-treated hNPCs were measured using SDS-PAGE immunoblot; GAPDH was used as the loading control. (B) RNA pull-down assays and SDS-PAGE immunoblot showed that IGF2BP1 and IGF2BP2 could bind the 3′ UTR of DIXDC1 in hNPCs. (C) The expression of DIXDC1 in hNPCs with knockdown of IGF2BP1or IGF2BP2 combined with hTT treatment using SDS-PAGE immunoblot. GAPDH was used as the loading control. (D) Lifespan of DIXDC1 expression in hTT-treated hNPCs transfected with the reduction of IGF2BP1. Relative mRNA levels were quantified by qRT-PCR. Data are shown as the mean ± SD, n = 6. (E) hNPCs cells were transfected with the TOPFLASH reporter and control or Dixdc1 shRNA, followed by stimulation with Wnt3a conditioned medium, and subjected to a luciferase assay. The graph shows the relative TCF/LEF luciferase activity. Data are shown as the mean ± SD, n = 3. ∗p < 0.05, ∗∗p < 0.01, two-tailed unpaired Student’s t test. (F) Expression of the anabolic proteins ACAN and collagen II and the cell senescence proteins p21 and p16INK4a in hNPCs treated with control plasmid, DIXDC1 OE, or DIXDC1 OE plus SM04690 using SDS-PAGE immunoblot; GAPDH was used as the loading control. (G) The endogenous interaction between DISC1 and DIXDC1 was detected using coimmunoprecipitation. Then, the anti-DISC1 or anti-Dixdc1 immunoprecipitants were immunoblotted with anti-DISC1 or Dixdc1 Abs, respectively. (H) The endogenous interaction between CaMKII and DIXDC1 was detected using coimmunoprecipitation. Then, the anti-CaMKII or anti-Dixdc1 immunoprecipitants were immunoblotted with anti-CaMKII or Dixdc1 Abs, respectively. (I) The expression of CaMKII and p-CaMK II in hNPCs treated with control plasmid or DIXDC1 OE using SDS-PAGE immunoblot; GAPDH was used as the loading control.

Similar articles

Cited by

References

    1. Bilano V., Gilmour S., Moffiet T. Global Trends and Projections for Tobacco Use, 1990-2025: An Analysis of Smoking Indicators From the WHO Comprehensive Information Systems for Tobacco Control. J. Vasc. Surg. 2015;62:1370. doi: 10.1016/j.jvs.2015.09.012. - DOI - PubMed
    1. Ferreira P.H., Beckenkamp P., Maher C.G., Hopper J.L., Ferreira M.L. Nature or nurture in low back pain? Results of a systematic review of studies based on twin samples. Eur. J. Pain. 2013;17:957–971. doi: 10.1002/j.1532-2149.2012.00277.x. - DOI - PubMed
    1. Goldberg M.S., Scott S.C., Mayo N.E. A review of the association between cigarette smoking and the development of nonspecific back pain and related outcomes. Spine (Phila Pa 1976) 2000;25:995–1014. doi: 10.1097/00007632-200004150-00016. - DOI - PubMed
    1. Nemoto Y., Matsuzaki H., Tokuhasi Y., Okawa A., Uematu Y., Nishimura T., Oda H. Histological changes in intervertebral discs after smoking and cessation: experimental study using a rat passive smoking model. J. Orthop. Sci. 2006;11:191–197. doi: 10.1007/s00776-005-0987-4. - DOI - PubMed
    1. Hooten W.M., Vickers K.S., Shi Y., Ebnet K.L., Townsend C.O., Patten C.A., Warner D.O. Smoking cessation and chronic pain: patient and pain medicine physician attitudes. Pain Pract. 2011;11:552–563. doi: 10.1111/j.1533-2500.2011.00462.x. - DOI - PMC - PubMed

Publication types

MeSH terms

Substances

LinkOut - more resources