DNA Adductomics for the Biological Effect Assessment of Contaminant Exposure in Marine Sediments
- PMID: 37341092
- PMCID: PMC10373492
- DOI: 10.1021/acs.est.3c00499
DNA Adductomics for the Biological Effect Assessment of Contaminant Exposure in Marine Sediments
Abstract
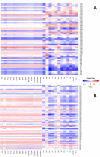
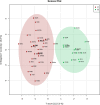
Exposure to chemical pollution can induce genetic and epigenetic alterations, developmental changes, and reproductive disorders, leading to population declines in polluted environments. These effects are triggered by chemical modifications of DNA nucleobases (DNA adducts) and epigenetic dysregulation. However, linking DNA adducts to the pollution load in situ remains challenging, and the lack of evidence-based DNA adductome response to pollution hampers the development and application of DNA adducts as biomarkers for environmental health assessment. Here, we provide the first evidence for pollution effects on the DNA modifications in wild populations of Baltic sentinel species, the amphipod Monoporeia affinis. A workflow based on high-resolution mass spectrometry to screen and characterize genomic DNA modifications was developed, and its applicability was demonstrated by profiling DNA modifications in the amphipods collected in areas with varying pollution loads. Then, the correlations between adducts and the contaminants level (polycyclic aromatic hydrocarbons (PAHs), trace metals, and pollution indices) in the sediments at the collection sites were evaluated. A total of 119 putative adducts were detected, and some (5-me-dC, N6-me-dA, 8-oxo-dG, and dI) were structurally characterized. The DNA adductome profiles, including epigenetic modifications, differed between the animals collected in areas with high and low contaminant levels. Furthermore, the correlations between the adducts and PAHs were similar across the congeners, indicating possible additive effects. Also, high-mass adducts had significantly more positive correlations with PAHs than low-mass adducts. By contrast, correlations between the DNA adducts and trace metals were stronger and more variable than for PAHs, indicating metal-specific effects. These associations between DNA adducts and environmental contaminants provide a new venue for characterizing genome-wide exposure effects in wild populations and apply DNA modifications in the effect-based assessment of chemical pollution.
Keywords: DNA adducts; amphipods as sentinel species; biological effect monitoring; biomarkers; environmental contaminants; high-resolution mass spectrometry.
Conflict of interest statement
The authors declare no competing financial interest.
Figures


References
-
- ICES VIEWPOINT: Assessment of the Biological Effects of Chemical Pollution for Better Management of the Marine Environment; ICES, 2021.
-
- Lionetto M. G.; Caricato R.; Giordano M. E. Pollution Biomarkers in the Framework of Marine Biodiversity Conservation: State of Art and Perspectives. Water 2021, 13, 1847.10.3390/w13131847. - DOI
-
- Hsieh J.-H.; Smith-Roe S. L.; Huang R.; Sedykh A.; Shockley K. R.; Auerbach S. S.; Merrick B. A.; Xia M.; Tice R. R.; Witt K. L. Identifying Compounds with Genotoxicity Potential Using Tox21 High Throughput Screening Assays. Chem. Res. Toxicol. 2019, 32, 1384.10.1021/acs.chemrestox.9b00053. - DOI - PMC - PubMed
Publication types
MeSH terms
Substances
Grants and funding
LinkOut - more resources
Full Text Sources

