. 2023 Jul 12;23(14):3226-3237.
doi: 10.1039/d2lc00723a.

3D vascularised proximal tubules-on-a-multiplexed chip model for enhanced cell phenotypes

Affiliations

3D vascularised proximal tubules-on-a-multiplexed chip model for enhanced cell phenotypes

Miguel Carracedo et al. Lab Chip. .

Abstract

Modelling proximal tubule physiology and pharmacology is essential to understand tubular biology and guide drug discovery. To date, multiple models have been developed; however, their relevance to human disease has yet to be evaluated. Here, we report a 3D vascularized proximal tubule-on-a-multiplexed chip (3DvasPT-MC) device composed of co-localized cylindrical conduits lined with confluent epithelium and endothelium, embedded within a permeable matrix, and independently addressed by a closed-loop perfusion system. Each multiplexed chip contains six 3DvasPT models. We performed RNA-seq and compared the transcriptomic profile of proximal tubule epithelial cells (PTECs) and human glomerular endothelial cells (HGECs) seeded in our 3D vasPT-MCs and on 2D transwell controls with and without a gelatin-fibrin coating. Our results reveal that the transcriptional profile of PTECs is highly dependent on both the matrix and flow, while HGECs exhibit greater phenotypic plasticity and are affected by the matrix, PTECs, and flow. PTECs grown on non-coated Transwells display an enrichment of inflammatory markers, including TNF-a, IL-6, and CXCL6, resembling damaged tubules. However, this inflammatory response is not observed for 3D proximal tubules, which exhibit expression of kidney signature genes, including drug and solute transporters, akin to native tubular tissue. Likewise, the transcriptome of HGEC vessels resembled that of sc-RNAseq from glomerular endothelium when seeded on this matrix and subjected to flow. Our 3D vascularized tubule on chip model has utility for both renal physiology and pharmacology.


Conflict of interest statement

Miguel Carracedo, Babak Alaei, Maryam Clausen, Ryan Hicks, Graham Belfield, Magnus Althage, Annette Bak, Pernille B. L. Hansen and Julie Williams are all employees of AstraZeneca.

Figures

Fig. 1
Fig. 1. Proximal tubule models in two- and three-dimensions. A) Schematic view of proximal tubule epithelial cells (PTECs) cultured on a transwell membrane (static, non-coated) in the absence and presence of human glomerular endothelial cells (HGECs). B) Schematic view of proximal tubule epithelial cells cultured on a transwell membrane coated with an estimated 1 mm gelatin–fibrin coating matrix (static, coated) in the absence and presence of endothelial cells. C) Schematic views of co-localized 3D blood vessel and proximal tubule embedded within a gelatin–fibrin matrix within 100 μm in a perfusable multichip model. D) Images of the perfusable multi-chip model platform, which shows the media reservoirs, peristaltic pump, and 3D vasPT-MC system. Each device contains 6 individually perfusable 3DvasPT chips, as shown in the magnified image. In all cases, HGECs are seeded and grown on a thin layer of laminin 521 in the absence or presence of matrix. Figure was created utilizing biorender.
Fig. 2
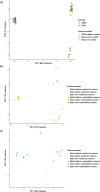
Fig. 2. PTEC and HGECs transcriptional profiles depend on cell culture conditions. (A) Principal component analysis (PCA) plot of PTECs and HGECs in different 2D and 3D culture conditions. (B) PCA plot for PTECs in different mono- and co-culture conditions based on their transcriptional profiles. (C) PCA plot for HGECs in different mono- and co-culture conditions based on their transcriptional profiles.
Fig. 3
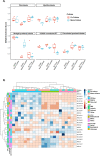
Fig. 3. Kidney cell type and transporter enrichment of PTECs grown under different culture conditions. A) Gene set variation analysis between the gene sets from the different PTEC culture conditions and the gene sets from Young et al. single-cell RNA-seq. PT: Proximal tubular. B) Heatmap representing absolute gene expression values of selected transporters in PTECs under different culture conditions.
Fig. 4
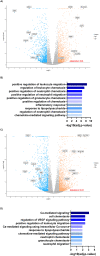
Fig. 4. PTECs on chip exhibit less inflammatory genes. A) Volcano plot representing the magnitude of change (logged fold change (logFC)) versus the statistical significance (−log10(P-value)) of all measured genes between PTECs grown coated and non-coated Transwells. Each dot represents a gene meeting the significance threshold. Blue represents down regulation and orange upregulation with respect to static coated and non-coated conditions. B) Gene ontology pathways of the top 100 downregulated genes under static matrix-coated compared with static non-coated conditions ranked by significance. C) Volcano plot of all measured genes between PTECs on chip (flow) vs. non-coated Transwell (static) conditions. Blue represents down regulation, while orange denotes upregulation with respect to on chip versus static conditions. D) Gene ontology pathways of the top 100 downregulated genes between PTECs on chip versus those cultured on static, non-coated Transwells ranked by significance.
Fig. 5
Fig. 5. Comparison of the top 100 differentially expressed genes with RNAseq of human tubulointerstitial biopsies. Heatmaps of differentially expressed genes between healthy and FSGS or DN, which present a significant overlap among the top 100 down regulated genes in: matrix-coated vs. non-coated in A) healthy (1) vs. DN (2): P-value: 1.61 × 10⁻⁸, Q-value: 4.84 × 10⁻⁵, odds ratio: 5.6, size: 20 genes; and B) healthy (1) vs. FSGS (2): P-value: 1.04 × 10⁻⁵, Q-value: 0.006, odds ratio: 4.2, size: 16 genes. In 3D flow matrix-coated vs. non-coated C) healthy (1) vs. DN (2): P-value: 9.59 × 10⁻⁹Q-value: 7.51 × 10⁻⁵ odds ratio: 5.8 size: 20 genes and D) healthy (1) vs. FSGS (2): P-value: 9.59 × 10⁻⁹Q-value: 9.39 × 10⁻⁵ odds ratio: 5.8 size: 20 genes.
Fig. 6
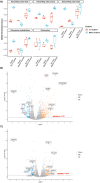
Fig. 6. Kidney cell type enrichment profile of HGECs grown under different conditions. A) Gene set variation analysis between the gene sets from the different HGEC culture conditions and the gene sets from Young et al. single-cell RNA-seq. AV1 and AV2 for ascending vasa recta, DV for descending vasa recta, G for Glomerulus, GE for glomerular endothelium. B and C) Volcano plots representing the logged fold change (logFC) vs. the −log10(P-value) of all measured genes. Each dot represents a gene meeting the significance threshold. Blue represents down regulation and orange upregulation with respect to PTECs on chip compared to matrix-coated (B) and non-coated (C) Transwells, respectively.
Fig. 7
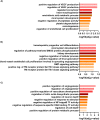
Fig. 7. HGEC gene ontology. Gene ontology analyses of the top one-hundred upregulated genes in HGECs between cells cultured on chip under flow compared to A) non-coated Transwells, B) matrix-coated Transwells and C) non-coated Transwells in co-culture conditions.

References

    1. Risso M. A. Sallustio S. Sueiro V. Bertoni V. Gonzalez-Torres H. Musso C. G. Int. J. Nephrol. Renovasc. Dis. 2019;12:257–262. doi: 10.2147/IJNRD.S216673. - DOI - PMC - PubMed
    1. Wieser M. Stadler G. Jennings P. Streubel B. Pfaller W. Ambros P. Riedl C. Katinger H. Grillari J. Grillari-Voglauer R. Am. J. Physiol. 2008;295:F1365–F1375. - PubMed
    1. Jang K. J. Mehr A. P. Hamilton G. A. McPartlin L. A. Chung S. Suh K. Y. Ingber D. E. Integr. Biol. 2013;5:1119–1129. doi: 10.1039/c3ib40049b. - DOI - PubMed
    1. Vedula E. M. Alonso J. L. Arnaout M. A. Charest J. L. PLoS One. 2017;12:e0184330. doi: 10.1371/journal.pone.0184330. - DOI - PMC - PubMed
    1. Homan K. A. Kolesky D. B. Skylar-Scott M. A. Herrmann J. Obuobi H. Moisan A. Lewis J. A. Sci. Rep. 2016;6:34845. doi: 10.1038/srep34845. - DOI - PMC - PubMed

Publication types