. 2023 Aug 31;14(4):e0329322.
doi: 10.1128/mbio.03293-22. Epub 2023 Jun 21.

Differential dysregulation of β-TrCP1 and -2 by HIV-1 Vpu leads to inhibition of canonical and non-canonical NF-κB pathways in infected cells

Affiliations

Differential dysregulation of β-TrCP1 and -2 by HIV-1 Vpu leads to inhibition of canonical and non-canonical NF-κB pathways in infected cells

Suzanne Pickering et al. mBio. .

Abstract

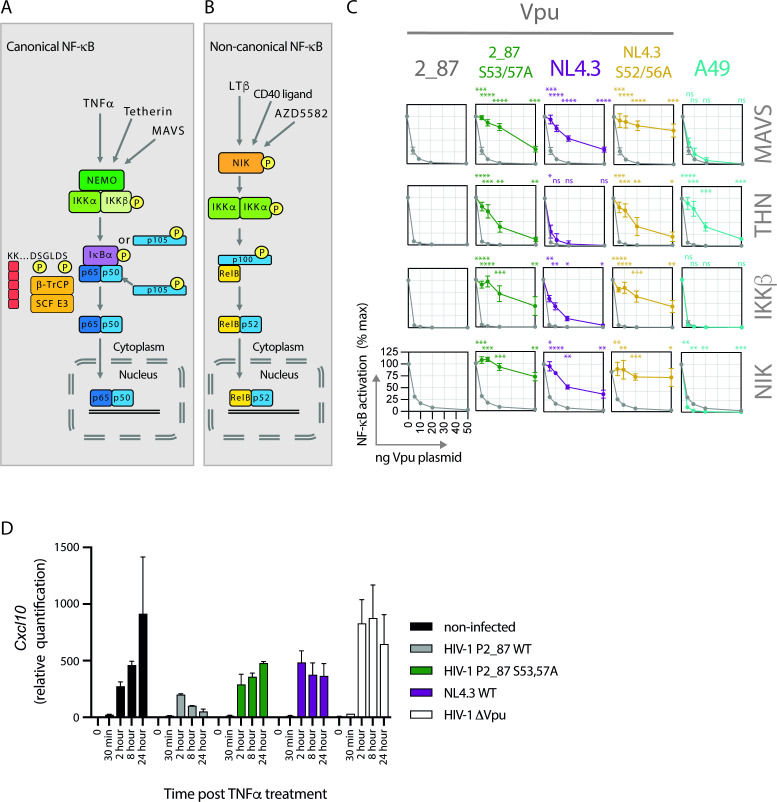
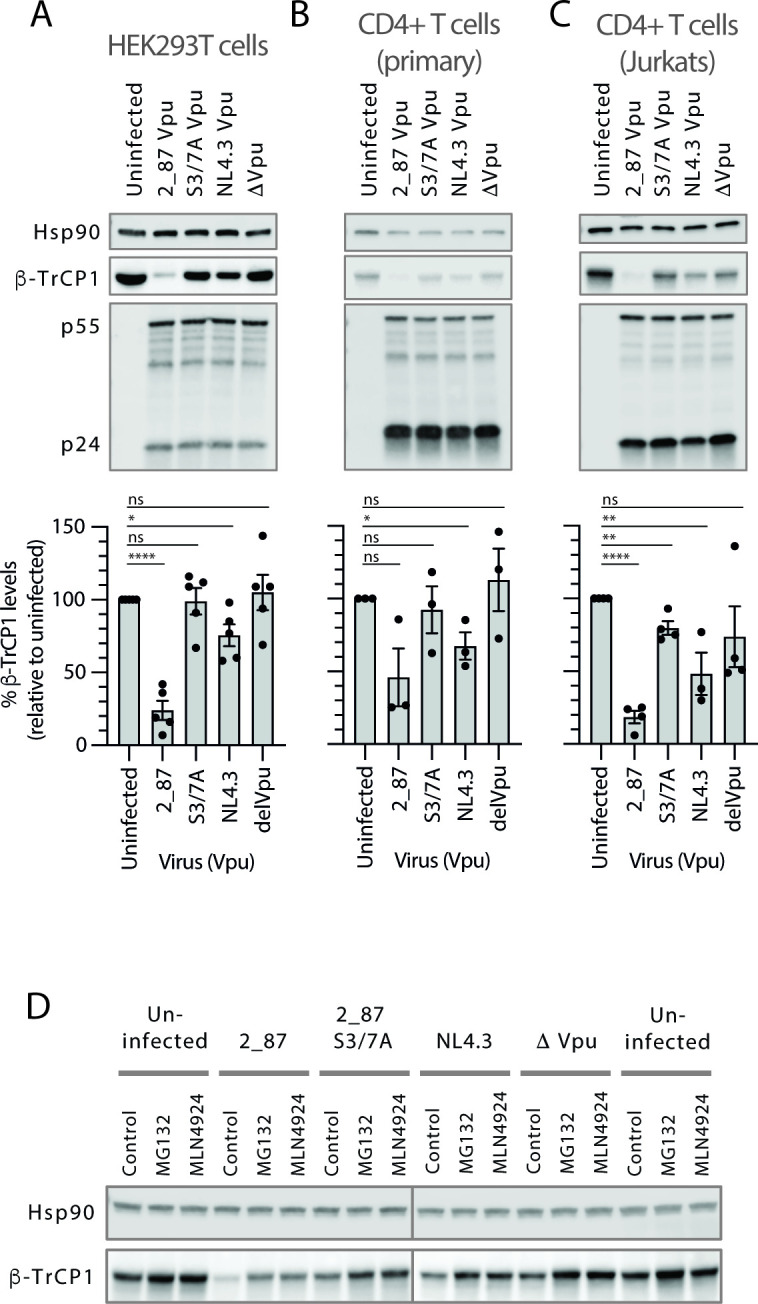
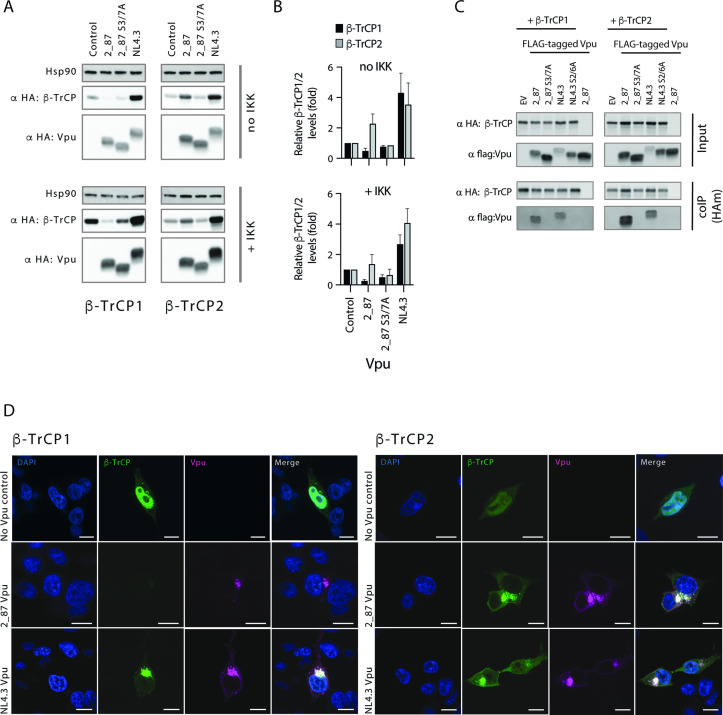
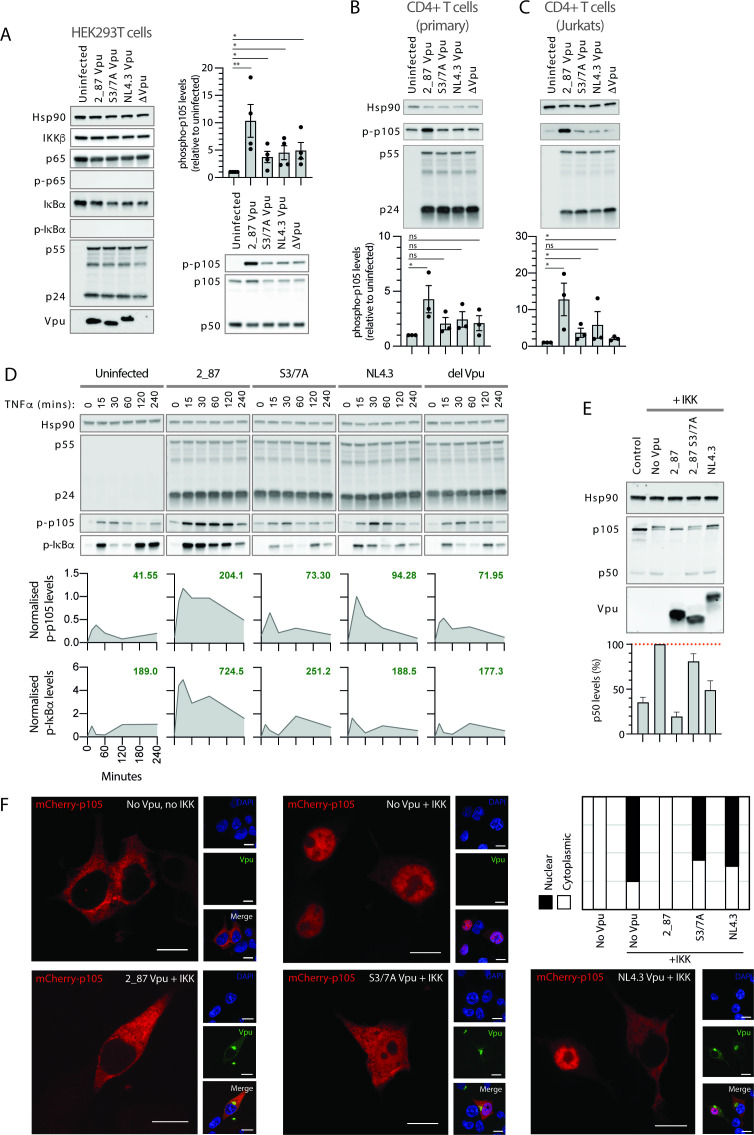
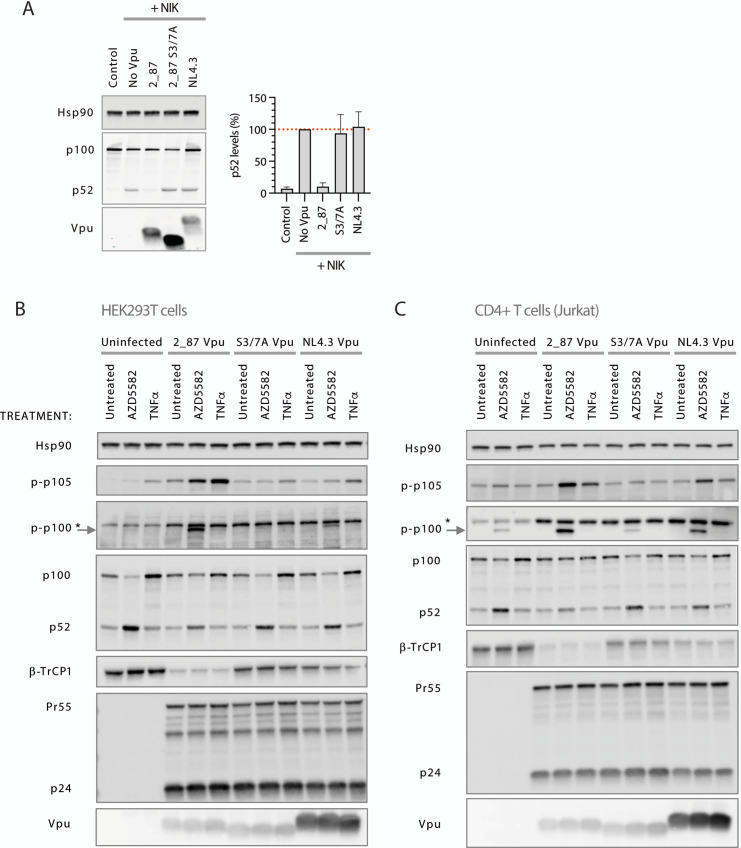
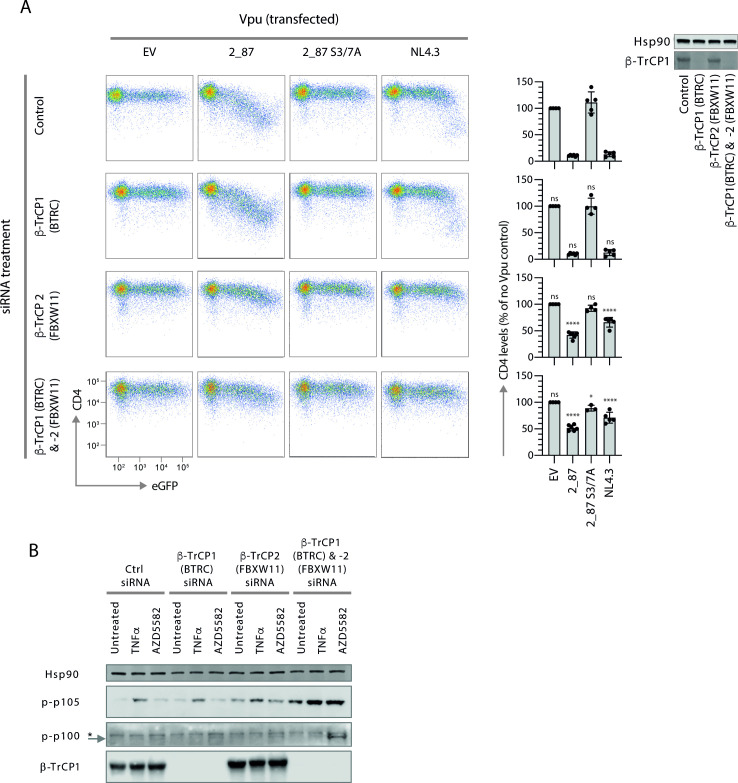
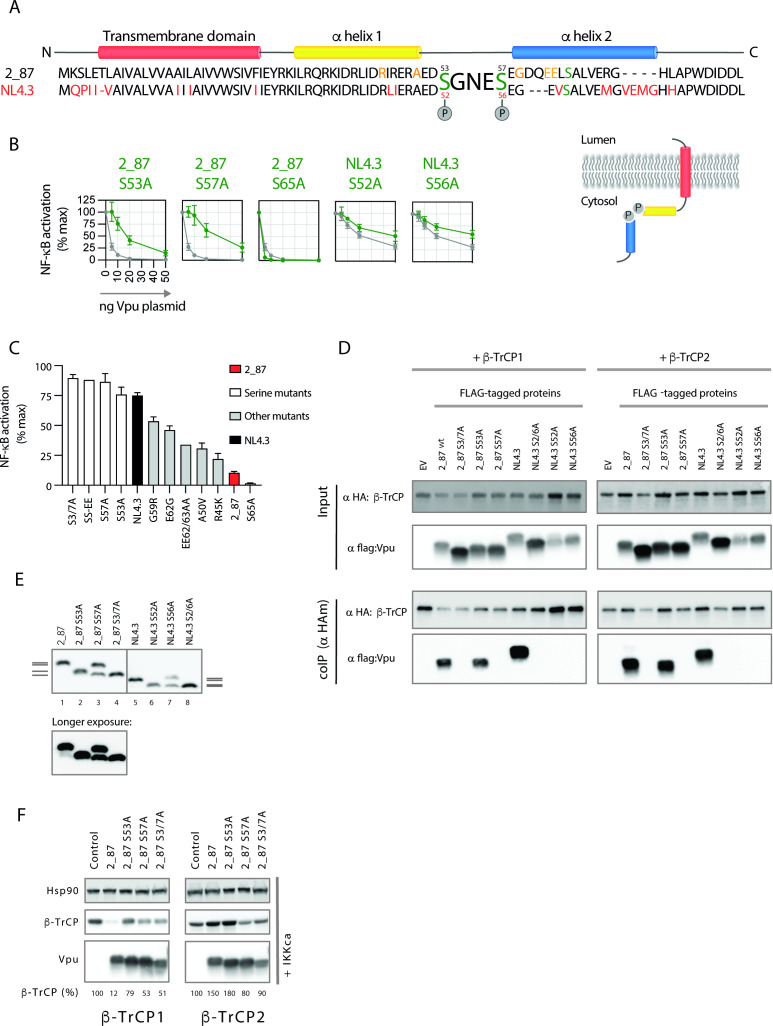
The HIV-1 Vpu protein is expressed late in the virus lifecycle to promote infectious virus production and avoid innate and adaptive immunity. This includes the inhibition of the NF-κB pathway which, when activated, leads to the induction of inflammatory responses and the promotion of antiviral immunity. Here we demonstrate that Vpu can inhibit both canonical and non-canonical NF-κB pathways, through the direct inhibition of the F-box protein β-TrCP, the substrate recognition portion of the Skp1-Cul1-F-box (SCF)β-TrCP ubiquitin ligase complex. There are two paralogues of β-TrCP (β-TrCP1/BTRC and β-TrCP2/FBXW11), encoded on different chromosomes, which appear to be functionally redundant. Vpu, however, is one of the few β-TrCP substrates to differentiate between the two paralogues. We have found that patient-derived alleles of Vpu, unlike those from lab-adapted viruses, trigger the degradation of β-TrCP1 while co-opting its paralogue β-TrCP2 for the degradation of cellular targets of Vpu, such as CD4. The potency of this dual inhibition correlates with stabilization of the classical IκBα and the phosphorylated precursors of the mature DNA-binding subunits of canonical and non-canonical NF-κB pathways, p105/NFκB1 and p100/NFκB2, in HIV-1 infected CD4+ T cells. Both precursors act as alternative IκBs in their own right, thus reinforcing NF-κB inhibition at steady state and upon activation with either selective canonical or non-canonical NF-κB stimuli. These data reveal the complex regulation of NF-κB late in the viral replication cycle, with consequences for both the pathogenesis of HIV/AIDS and the use of NF-κB-modulating drugs in HIV cure strategies. IMPORTANCE The NF-κB pathway regulates host responses to infection and is a common target of viral antagonism. The HIV-1 Vpu protein inhibits NF-κB signaling late in the virus lifecycle, by binding and inhibiting β-TrCP, the substrate recognition portion of the ubiquitin ligase responsible for inducing IκB degradation. Here we demonstrate that Vpu simultaneously inhibits and exploits the two different paralogues of β-TrCP by triggering the degradation of β-TrCP1 and co-opting β-TrCP2 for the destruction of its cellular targets. In so doing, it has a potent inhibitory effect on both the canonical and non-canonical NF-κB pathways. This effect has been underestimated in previous mechanistic studies due to the use of Vpu proteins from lab-adapted viruses. Our findings reveal previously unappreciated differences in the β-TrCP paralogues, revealing functional insights into the regulation of these proteins. This study also raises important implications for the role of NF-κB inhibition in the immunopathogenesis of HIV/AIDS and the way that this may impact on HIV latency reversal strategies based on the activation of the non-canonical NF-κB pathway.

Keywords: HIV-1; Vpu; beta-TrCP; nuclear factor kappa B; ubiquitin ligase.


Conflict of interest statement

The authors declare no conflict of interest.

Figures

None
FIG 1 Vpu inhibits both the canonical and the non-canonical NF-κB pathways. (A) Graphical representation of the canonical NF-κB pathway, detailing events downstream of the activation of the IKK complex. Stimuli such as TNFα, tetherin activation (through the retention of budding virus particles) or MAVS activation (following upstream sensing of viral RNA) trigger signaling cascades that converge at the activation of the IKK complex. IKKβ phosphorylates inhibitors of NF-κB, most commonly IκBα (but also p105 and p100), on dual serine residues 32 and 36 in the degron sequence SGLDS, leading to recognition by the β-TrCP substrate adaptor portion of an E3 cullin-RING ligase (SCFβ-TrCP). Ubiquitination of IκBα on lysine residues (represented by red squares in the schematic) by SCFβ-TrCP triggers proteasomal degradation, releasing the NF-κB transcription factor (in this example the p65/p50 heterodimer), which translocates to the nucleus and activates the expression of NF-κB-dependent genes. P105 also acts as a precursor for the p50 portion of the NF-κB transcription factor, and is converted to active p50 by partial proteasomal processing. (B) Graphical representation of the non-canonical NF-κB pathway. Stimuli such as lymphotoxin β (LTβ), CD40 ligand, or the synthetic compound AZD5582, lead to the activation of NIK, which in turn phosphorylates IKKα. Activated IKKα phosphorylates p100 on dual C-terminal serine residues, prompting its recognition by SCFβ-TrCP, ubiquitination and partial proteasomal processing to form mature RelB/p52 dimers, able to translocate to the nucleus and activate transcription. (C) Transient NF-κB activation assays were performed in HEK293T cells by co-transfecting an NF-κB-dependent luciferase reporter construct (3xNF-κB pConA), a renilla luciferase control plasmid, a fixed dose of plasmid expressing an NF-κB stimulus (MAVS, tetherin, IKKβ or NIK), and an increasing dose of Vpu or A49 plasmid. Twenty-four hours after transfection, cells were lysed and luciferase activity was determined. Results are expressed as a percentage of normalized signal recorded in the absence of Vpu or A49 (% max). Means are presented from at least four independent experiments, with error bars showing ± SD. The 2_87 line is shown on all graphs for comparison (gray line, gray circles), with 2_87 S3/7A in green, NL4.3 in purple, NL4.3 S2/6A in yellow, and A49 in turquoise. Asterisks indicate points that differ significantly from 2_87: P-value > 0.1 (ns), < 0.1 (*), < 0.01 (**), < 0.001 (***), < 0.0001 (****). (D) CD4+ Jurkat T cells were infected with recombinant NL4.3 proviruses engineered to express either highly active 2_87 Vpu, 2_87 S3/7A Vpu, NL4.3 Vpu or no Vpu (Δ Vpu) at an MOI of 3. Seventy-two hours after infection, the cells were treated with 5 ng/mL TNFα. Total RNA was isolated at the indicated time points after treatment and subjected to RT-qPCR to detect CXCL10 mRNA. Data are plotted as mean fold increase relative to uninfected and untreated cells in two independent experiments, with error bars showing SEM.
None
FIG 2 β-TrCP1 levels are significantly depleted in cells infected with virus expressing primary Vpu Recombinant NL4.3 proviruses engineered to express either highly active 2_87 Vpu, 2_87 S3/7A vpu, NL4.3 Vpu or no Vpu (Δ Vpu) were used to infect HEK293T cells (A), primary CD4+ T cells (B) or CD4+ Jurkat T cells (C) at an MOI of 5 for 48 h. Cells were harvested and western blotted for Hsp90 (loading control), β-TrCP1 and HIV-1 Gag (major bands show p55 and p24). Graphs below the blots show mean β-TrCP1 levels from 3 to 5 independent experiments (for primary CD4+ T cells this is calculated from experiments from three different donors), with β-TrCP1 western blot intensities normalized first to Hsp90 for each sample, and percentages calculated relative to uninfected cells. Error bars represent ± SEM. Asterisks indicate β-TrCP1 levels that differ significantly from uninfected cells: P-value > 0.1 (ns), < 0.1 (*), < 0.01 (**), < 0.001 (***), < 0.0001 (****). (D) HEK293T cells were infected as in (A), but treated with proteasomal inhibitor MG132 (10 µM) or NEDD8-activating enzyme (NAE) inhibitor MLN4924 (0.1 µM) for 6 h prior to harvest at 48 h. Cell lysates were analyzed by western blot for Hsp90 (loading control) and endogenous β-TrCP1 levels.
None
FIG 3 Selective degradation of β-TrCP1 by primary, but not NL4.3, Vpu (A) The direct effect of Vpu on β-TrCP1 and 2 was examined by co-transfecting HEK293T cells with HA-tagged β-TrCP1 or -2 plus Vpu or empty vector control, in the presence (+IKK) or absence (no IKK; empty vector) of active signaling. Twenty-four hours after transfection, cell lysates were harvested and analyzed by western blot for HA (Vpu and β-TrCP) and Hsp90 (loading control). (B) Mean β-TrCP levels from three independent experiments. The top graph shows relative protein levels for β-TrCP1 and -2 western blots in the absence of IKKβ, shown in the top panel of (A), and the bottom graph for β-TrCP1 and -2 western blots in the presence of IKKβ, shown in the bottom panel of (A). Results are presented as mean fold β-TrCP levels relative to no Vpu, with error bars representing SEM. (C) 2_87 and NL4.3 Vpus were compared for their ability to bind β-TrCP1 and -2 by immunoprecipitation. Dual serine mutants of each Vpu (2_87 S3/7A and NL4.3 2/6A) were used as negative controls. HEK293T cells were co-transfected with flag-tagged Vpu or EV and HA-tagged β-TrCP or EV, and 24 h later cells were lysed, immunoprecipitated with anti-HA antibody and analyzed by western blot. In the case of β-TrCP1 (BTRC) immunoprecipitations, cells were treated with MG132 (10 µM) for 6 h prior to harvest to avoid degradation by Vpu. Single blots are shown representative of three individual experiments. (D) Confocal microscopy images of HEK293T cells co-transfected with GFP-tagged β-TrCP1 or -2 (green) and HA-tagged Vpu (pink) and co-stained for DAPI (blue). Areas of colocalization appear white. Panels are single z slices with scale bars of 10 µM. Images are representative examples from multiple experiments.
None
FIG 4 During infection and under conditions of active signaling, Vpu leads to stabilization of p-IκBα, p-p105 and the inhibition of processing to p50 and subsequent nuclear translocation (A) Components of the NF-κB complex downstream of the IKK complex (all depicted in Fig. 1A) were examined in infected cells, in the absence of exogenous NF-κB stimulation. Recombinant NL4.3 proviruses engineered to express either highly active 2_87 Vpu, 2_87 S3/7A Vpu, NL4.3 Vpu or no Vpu (Δ Vpu), were used to infect HEK293T cells (MOI 5) for 48 h. Cells were harvested and western blotted for Hsp90 (loading control), IKKβ, phospho-p105 (Ser932), total p105, p50, p65, phospho-p65 (Ser536), total IκBα and phospho-IκBα (Ser32/Ser36). HIV-1 Gag (p55 and p24) and Vpu were blotted as controls for infection levels. Western blots for phospho-p105 were quantified, normalized to Hsp90 levels for each lane and to the uninfected sample for each experiment, and plotted as averages of at least three separate experiments (bars). Individual data points are shown as dots. Error bars represent ± SEM. Unpaired one-tailed T tests were performed for each condition, with P-values indicated by asterisks: ns, not significant (P > 0.05); * < 0.5, **< 0.05). (B), as for A, but in primary CD4+ T cells. (C) as for A, but in CD4+ Jurkat cells. Note that T cell experiments are the same as those in Fig. 2B and C; therefore, control blots (Hsp90 and p55/p24) are reproduced. (D) HEK293T cells were infected with viruses expressing either 2_87, 2_87 S3/7A, NL4.3 or no Vpu (Δ Vpu) at an MOI of 3. Forty-four hours after infection, cells were treated with 10 ng/mL TNFα, and time points were harvested at 0, 15, 30, 60, 120, and 240 min following treatment, resulting in a total infection duration of 48 h. Samples were analyzed by western blot for Hsp90 (loading control), HIV-1 Gag (major bands showing p55 and p24), phospho-p105, and phospho-IκBα. Band intensities for p-p105 and p-IκBα are shown below each blot, normalized to Hsp90 for each sample and to positive controls for p105 or p-IκBα, as appropriate, per blot (not shown in the image). Numbers shown in bold green text on each graph represent the calculated area under the curve (AUC). (E) Transient p105 processing assays were performed by co-transfecting HA-p105, IKKβ, and Vpu (2_87, 2_87 S3/7A or NL4.3) plasmids into HEK293T cells. Twenty-four hours after transfection, cells were harvested and western blotted for HA (p105, p50, and Vpu) and Hsp90 as a loading control. P50 levels were quantified as a percentage of levels in the presence of IKKβ but absence of Vpu (shown as dotted red line), and plotted as averages of four independent experiments (bars). Error bars represent ± SEM. (F) Confocal microscopy images of HEK293T cells co-transfected with mCherry-tagged p105 (red) and HA-tagged Vpu (green), in the presence or absence of active signaling (+/− IKK) and co-stained for DAPI (blue). Panels are single z slices with scale bars of 10 µM. Graph shows proportion of cells with nuclear p50 (white) or cytoplasmic p105/p50 (black) from 100 counted cells.
None
FIG 5 Vpu inhibits the processing of p100 to p52 and leads to the stabilization of phospho-p100 in infected cells. (A) Transient p100 processing assays were performed by co-transfecting HA-p100, NIK and Vpu (2_87, 2_87 S3/7A, or NL4.3) plasmids into HEK293T cells. Twenty-four hours after transfection, cells were harvested and western blotted for HA (p100, p52, and Vpu) and Hsp90 as a loading control. P52 levels were quantified as a percentage of levels in the presence of NIK but absence of Vpu (shown as dotted red line), and plotted as averages of three independent experiments (bars). Error bars represent ± SEM. (B) Recombinant NL4.3 proviruses engineered to express either 2_87, 2_87 S3/7A, or NL4.3 Vpu were used to infect HEK293T cells at an MOI of 3. Forty-two hours after infection, cells were treated with 200 nM AZD5582 or 10 ng/mL TNFα, or left untreated. Six hours after treatment, cells were harvested and western blotted for Hsp90 (loading control), phospho-p105 (Ser932), phospho-p100 (Ser866/870), total p100, p52, and β-TrCP1. *denotes non-specific band. HIV-1 Gag (p55 and p24) and Vpu were blotted as controls for infection levels. (C) as for (B) but using CD4+ T cells (Jurkat).
None
FIG 6 siRNA knockdown of β-TrCP2 is required to inhibit CD4 cell-surface downregulation by Vpu, but knockdown of both paralogues is required to phenocopy 2_87 Vpu NF-κB inhibition. (A) Prior to CD4 downregulation assays, CD4+ TZMbl cells were pre-treated with siRNA to downregulate β-TrCP1 (BTRC), β-TrCP2 (FBXW11), or both. CD4 downregulation assays were performed by co-transfecting Vpu and GFP, harvesting 24 h later and analysing cell surface CD4 expression of gated GFP-positive cells by flow cytometry. Results are normalized to CD4 median fluorescent intensity in the absence of Vpu (EV). Graphs show means from at least four independent experiments ± SD. Asterisks above the bars indicate significant differences seen for each siRNA treatment compared to untreated cells, calculated separately for each Vpu: P-value > 0.1 (ns), < 0.1 (*), < 0.01 (**), < 0.001 (***), < 0.0001 (****). β-TrCP1 levels in siRNA-treated cells are shown by western blot, with Hsp90 as loading control. (B) HEK293T cells were pre-treated with siRNA for β-TrCP1 (BTRC), -2 (FBXW11) or both, then treated with 10 ng/mL TNFα, 200 nM AZD5582 or left untreated for 6 h before harvesting. Lysates were analyzed by western blot for Hsp90 (loading control), phospho-p105 (Ser932), phospho-p100 (Ser866/870), and β-TrCP1.
Fig 7
Fig 7
For 2_87 Vpu, serine 53 is sufficient for binding to β-TrCP whereas NL4.3 Vpu requires both serines. Both 2_87 serines are required for degradation of β-TrCP1. (A) Alignment of 2_87 and NL4.3 Vpu with domains indicated. Cytoplasmic tail serines are denoted in green. Residues in NL4.3 that differ from 2_87 are coloued red. Residues in 2_87 found to affect NF-κB inhibition in a screen of primary Vpus (31), and tested in panel (C) are shown in orange. (B) Transient NF-κB activation assays, using MAVS as a stimulus, were performed as for Fig. 1C. Results are expressed as a percentage of normalized signal recorded in the absence of Vpu (% max). Means are presented from at least three independent experiments, with error bars showing ± SD. 2_87 single serine mutants are shown in green with 2_87 in gray on each graph, and NL4.3 single serine mutants are shown in yellow with NL4.3 in gray on each graph. (C) A panel of Vpus, including single serine and combined serine mutants and naturally occurring mutations that specifically impacted NF-κB inhibition (31) were compared for their ability to inhibit NF-κB induced by MAVS in transient NF-κB reporter assays at a single concentration (10 ng). Results are expressed as a percentage of normalized signal recorded in the absence of Vpu (% max). Means are presented from at least three independent experiments, with error bars showing ± SD. Mutants are arranged in order of impact. Wild-type 2_87 is shown in red. NL4.3 is shown in black. Serine mutants are shown in white. Mutations found to impact NF-κB inhibition in a primary Vpu screen and made in the 2_87 Vpu background are shown in gray and depicted in (A). (D) Single serine mutants of 2_87 (S53A and S57A) and NL4.3 (S52A and S56A) Vpus were compared for their ability to bind β-TrCP1 and -2 by immunoprecipitation. Dual serine mutants of each Vpu (2_87 S3/7A and NL4.3 2/6A) were used as negative controls. HEK293T cells were co-transfected with flag-tagged Vpu or EV and HA-tagged β-TrCP or EV, and 24 h later cells were lysed, immunoprecipitated with anti-HA antibody, and analyzed by western blot. In the case of β-TrCP1 (BTRC) immunoprecipitations, cells were treated with MG132 (10 µM) for 6 h prior to harvest to avoid degradation by Vpu. (E) HEK293T cells were transfected with HA-tagged 2_87 or NL4.3 Vpu and single- and double-serine mutants thereof. Cell lysates were resolved by phosphate-affinity PAGE, on 10% polyacrylamide gels containing 50 uM Phos-tag. Western blots were probed with anti-HA antibody to demonstrate the phosphorylation states of 2_87 and NL4.3 Vpus and corresponding single- and dual-serine mutants. Gray lines on the side of the gels indicate defined phosphorylation states for 2_87 Vpu (left) and NL4.3 Vpu (right). (F) The direct effect of individual serine mutants of Vpu on β-TrCP1 and -2 was examined by co-transfecting HEK293T cells with HA-tagged β-TrCP1 or -2 plus Vpu, in the presence (+IKK) of active signaling. Twenty-four hours after transfection, cell lysates were harvested and analyzed by western blot for HA (β-TrCP and Vpu) and Hsp90 (loading control).

Comment in

Similar articles

Cited by

References

    1. Nabel G, Baltimore D. 1987. An inducible transcription factor activates expression of human immunodeficiency virus in T cells. Nature 326:711–713. doi: 10.1038/326711a0 - DOI - PubMed
    1. Greenwood EJD, Williamson JC, Sienkiewicz A, Naamati A, Matheson NJ, Lehner PJ. 2019. Promiscuous targeting of cellular proteins by Vpr drives systems-level proteomic remodeling in HIV-1 infection. Cell Rep 27:1579–1596. doi: 10.1016/j.celrep.2019.04.025 - DOI - PMC - PubMed
    1. Khan H, Sumner RP, Rasaiyaah J, Tan CP, Rodriguez-Plata MT, Van Tulleken C, Fink D, Zuliani-Alvarez L, Thorne L, Stirling D, Milne RS, Towers GJ. 2020. HIV-1 Vpr Antagonizes innate immune activation by targeting karyopherin-mediated NF-ΚB/Irf3 nuclear transport. Elife 9:e60821. doi: 10.7554/eLife.60821 - DOI - PMC - PubMed
    1. Apps R, Del Prete GQ, Chatterjee P, Lara A, Brumme ZL, Brockman MA, Neil S, Pickering S, Schneider DK, Piechocka-Trocha A, Walker BD, Thomas R, Shaw GM, Hahn BH, Keele BF, Lifson JD, Carrington M. 2016. HIV-1 Vpu mediates HLA-C downregulation. Cell Host Microbe 19:686–695. doi: 10.1016/j.chom.2016.04.005 - DOI - PMC - PubMed
    1. Bolduan S, Hubel P, Reif T, Lodermeyer V, Höhne K, Fritz JV, Sauter D, Kirchhoff F, Fackler OT, Schindler M, Schubert U. 2013. HIV-1 Vpu affects the anterograde transport and the glycosylation pattern of NTB-A. Virol 440:190–203. doi: 10.1016/j.virol.2013.02.021 - DOI - PMC - PubMed

Publication types