. 2023 Jan 3:101:skad207.
doi: 10.1093/jas/skad207.

Pulmonary microbiota intervention alleviates fine particulate matter-induced lung inflammation in broilers

Affiliations

Pulmonary microbiota intervention alleviates fine particulate matter-induced lung inflammation in broilers

Zilin Zhou et al. J Anim Sci. .

Abstract

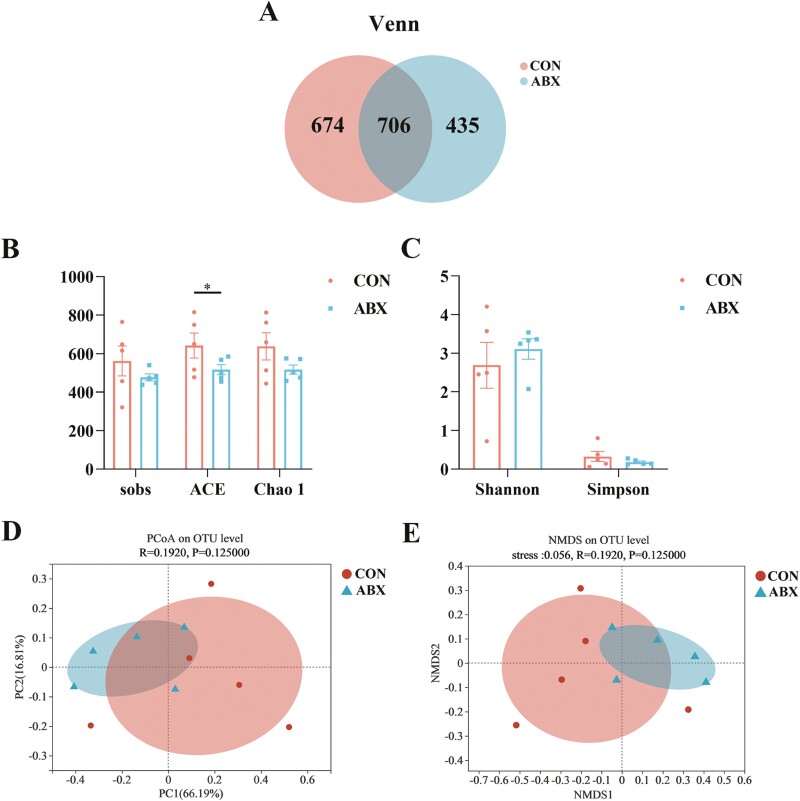
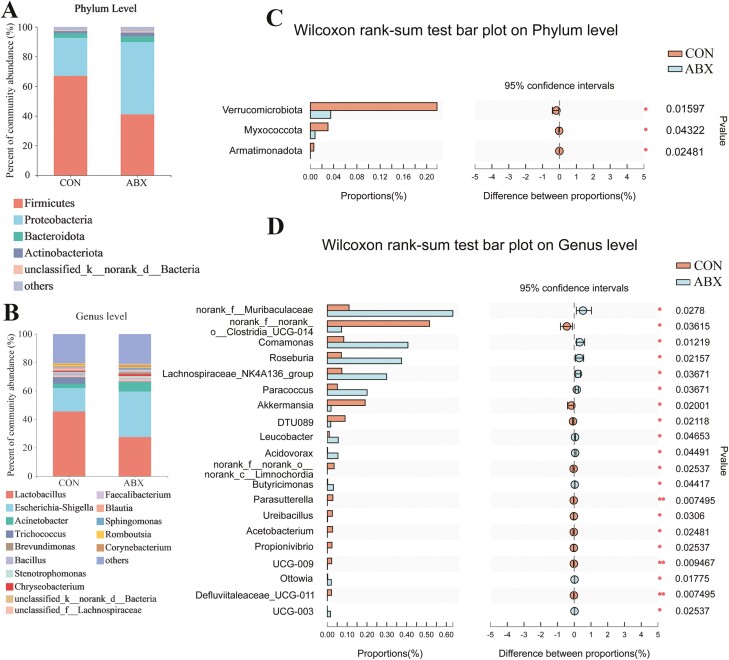
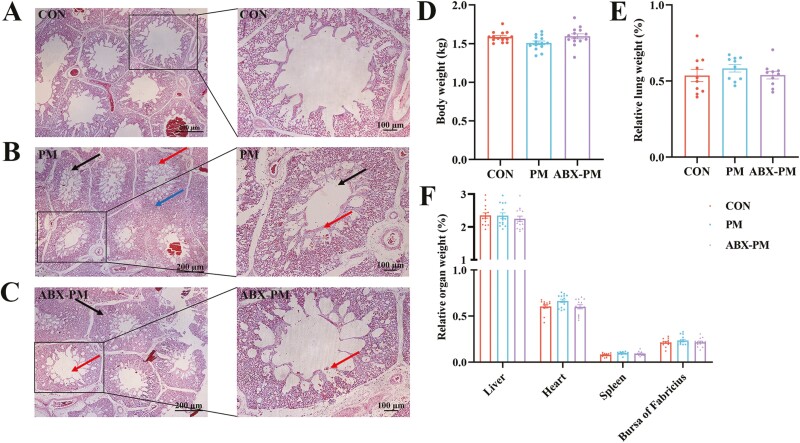
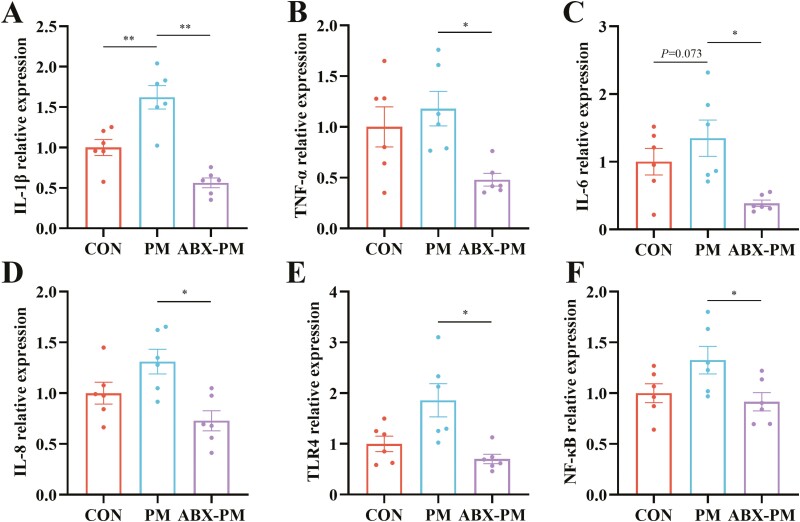
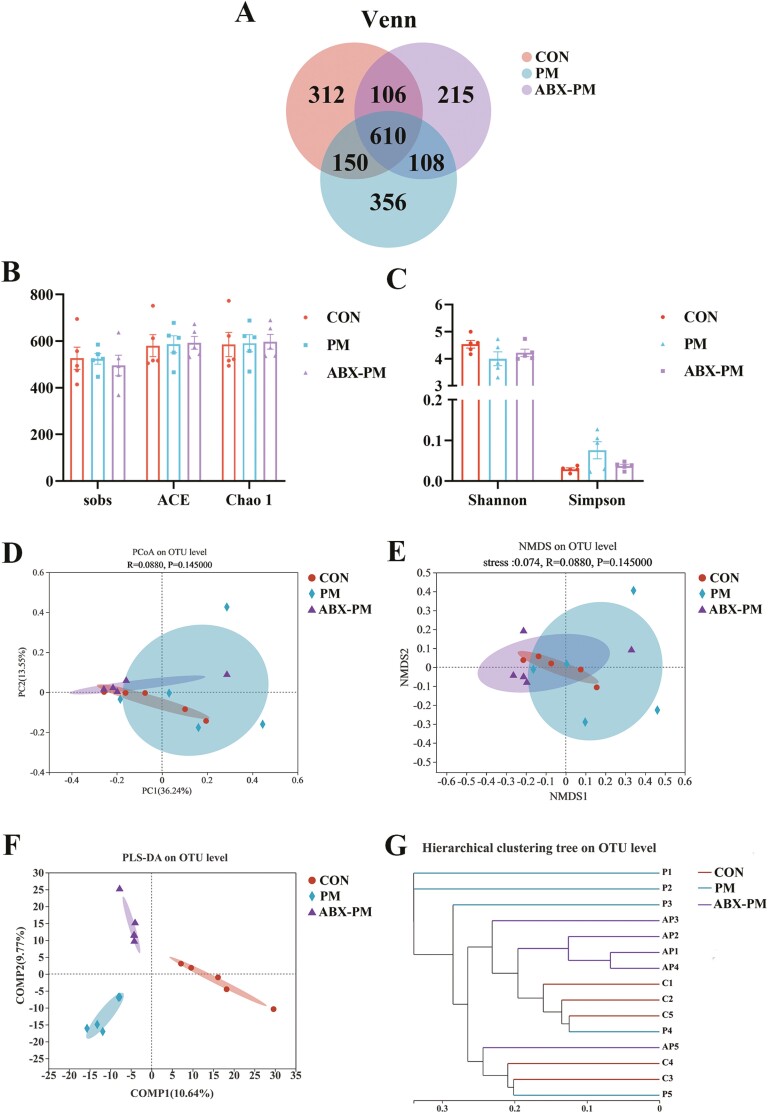
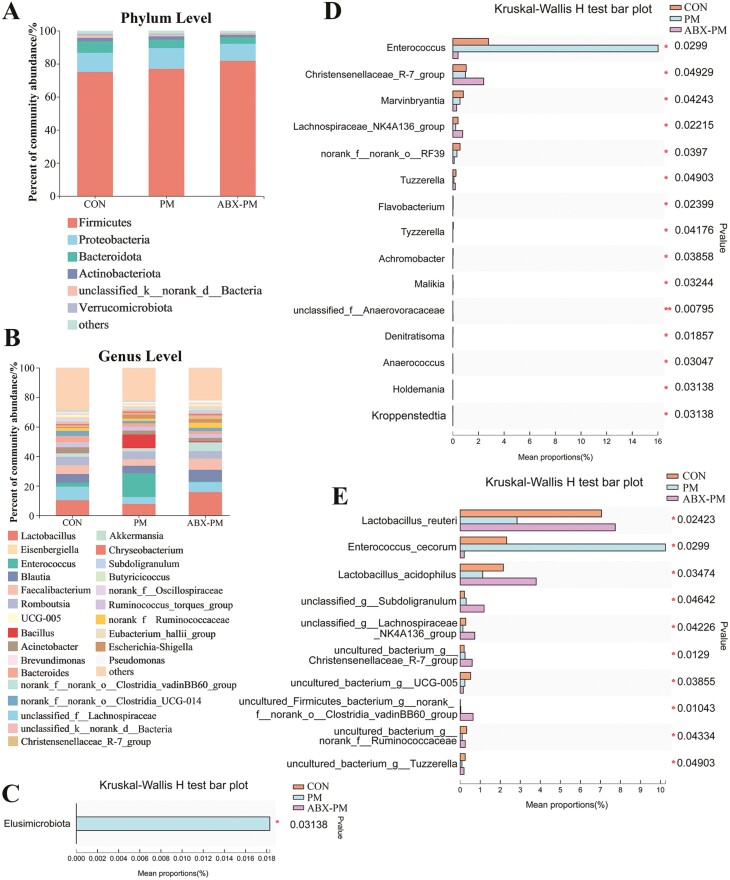
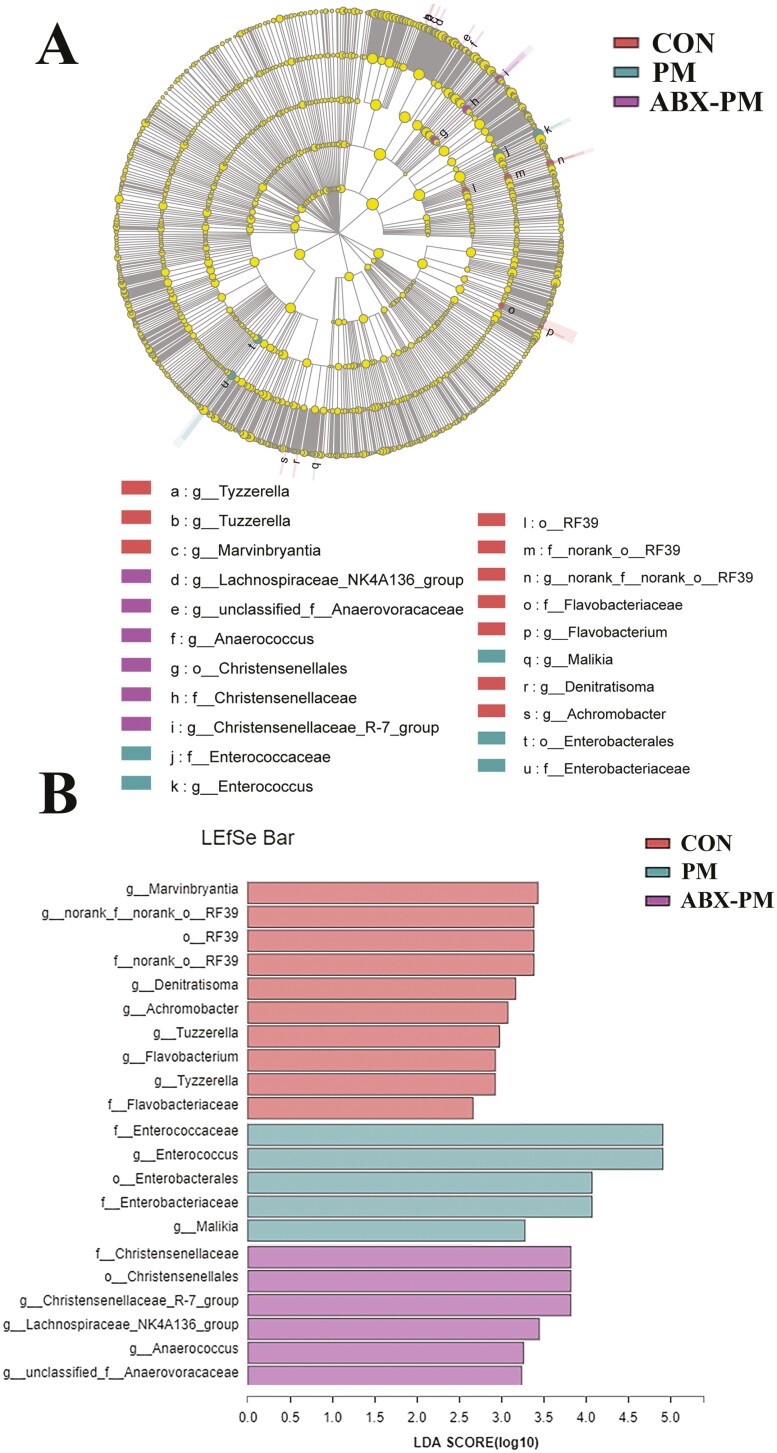
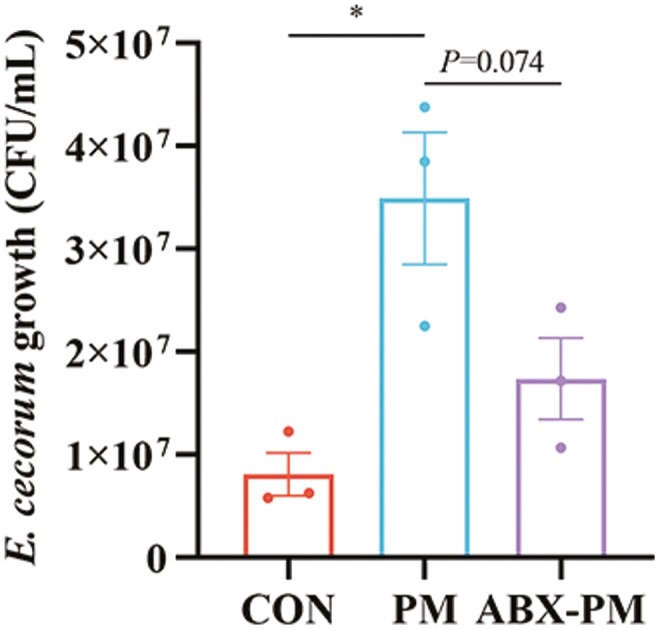
Fine particulate matter (PM2.5) released during the livestock industry endangers the respiratory health of animals. Our previous findings suggested that broilers exposed to PM2.5 exhibited lung inflammation and changes in the pulmonary microbiome. Therefore, this study was to investigate whether the pulmonary microbiota plays a causal role in the pathogenesis of PM2.5-induced lung inflammation. We first used antibiotics to establish a pulmonary microbiota intervention broiler model, which showed a significantly reduced total bacterial load in the lungs without affecting the microbiota composition or structure. Based on it, 45 AA broilers of similar body weight were randomly assigned to three groups: control (CON), PM2.5 (PM), and pulmonary microbiota intervention (ABX-PM). From 21 d of age, broilers in the ABX-PM group were intratracheally instilled with antibiotics once a day for 3 d. Meanwhile, broilers in the other two groups were simultaneously instilled with sterile saline. On 24 and 26 d of age, broilers in the PM and ABX-PM groups were intratracheally instilled with PM2.5 suspension to induce lung inflammation, and broilers in the CON group were simultaneously instilled with sterile saline. The lung histomorphology, inflammatory cytokines' expression levels, lung microbiome, and microbial growth conditions were analyzed to determine the effect of the pulmonary microbiota on PM2.5-induced lung inflammation. Broilers in the PM group showed lung histological injury, while broilers in the ABX-PM group had normal lung histomorphology. Furthermore, microbiota intervention significantly reduced mRNA expression levels of interleukin-1β, tumor necrosis factor-α, interleukin-6, interleukin-8, toll-like receptor 4 and nuclear factor kappa-B. PM2.5 induced significant changes in the β diversity and structure of the pulmonary microbiota in the PM group. However, no significant changes in microbiota structure were observed in the ABX-PM group. Moreover, the relative abundance of Enterococcus cecorum in the PM group was significantly higher than that in the CON and ABX-PM groups. And sterile bronchoalveolar lavage fluid from the PM group significantly promoted the growth of E. cecorum, indicating that PM2.5 altered the microbiota's growth condition. In conclusion, pulmonary microbiota can affect PM2.5-induced lung inflammation in broilers. PM2.5 can alter the bacterial growth environment and promote dysbiosis, potentially exacerbating inflammation.

Keywords: broiler house; fine particulate matter; lung inflammation; microbiome; pulmonary microbiota.

Plain language summary

Fine particulate matter (PM2.5) in broiler houses has a negative impact on broiler respiratory tracts, and PM2.5 exposure can induce lung inflammation and cause microbiota dysbiosis. The pulmonary microbiota is involved in maintaining immune homeostasis in the lungs, and a variety of lung diseases exhibit microbiota disturbances. However, the correlation between the pulmonary microbiota and PM2.5-induced lung inflammation is poorly understood. This study aimed to investigate whether the pulmonary microbiota influenced PM2.5-induced lung inflammation. We use antibiotics to reduce the quantity of bacteria in the lungs without destroying their composition. PM2.5 was then used to induce lung inflammation in both untreated and intervened pulmonary microbiota broilers. Compared to untreated microbiota broilers, intervened microbiota broilers had less morphological lung tissue injury and lower inflammatory factor expression levels after PM2.5 exposure. Furthermore, the intervened microbiota broilers’ microbiota structure remained normal, while the untreated microbiota broilers showed dysbiosis. This dysbiosis is closely linked to changes in the microbial growth environment due to the inflammatory response. This suggested that the pulmonary microbiota affects PM2.5-induced lung inflammation in broilers. Dysbiosis caused by inflammation that alters the conditions for bacterial growth may exacerbate inflammation.


Conflict of interest statement

The authors declare that they have no competing interests.

Figures

Figure 1.
Figure 1.
Antibiotic instillation alters pulmonary microbiota diversity in broilers. (A) The Venn diagram demonstrates the number of reciprocal and unique OTUs in the control and low-concentration antibiotic groups. Pulmonary microbiota richness (B) and diversity (C) were evaluated by unpaired t-test analysis. Data are expressed as the mean ± SEM, *P < 0.05. (D) The community composition of the pulmonary microbiota was analyzed at the OTU level by PCoA. The principal components PC1 and PC2 explained 66.19% and 16.81% of the variation in the control and low-concentration antibiotic groups, respectively. P = 0.125000. (E) NMDS analysis was calculated at the OTU level. Stress = 0.056, P = 0.125000. (D–E) The distance matrix was calculated based on the Weighted Unifrac. CON, control group; ABX, low-concentration antibiotic group; N = 5 per group.
Figure 2.
Figure 2.
Instillation of antibiotics alters the relative abundance of bacterial taxa in lung tissue. The composition and relative abundance of bacteria at the phylum (A) and genus (B) level in the two groups. (C) The differences in the 20 most dominant bacteria at the phylum level. (D) The differences in the 30 most dominant bacteria at the genus level. CON, control group; ABX, low-concentration antibiotic group; N = 5 per group. *P < 0.05, **P < 0.01.
Figure 3.
Figure 3.
Effects of PM2.5 on lung histological structure (A–C), body weight (D), and relative organ weight (E, F). (A–C) Lung tissue was stained with HE, the left three pictures are the 40 × magnification, the right three pictures are the 100 × magnification. The size unit of the photograph is 200 and 100 μm. The black arrows point out the shrinking space of the tertiary bronchus and parabronchus; the blue arrows point out irregular blurry gaps between pulmonary lobules; and the red arrows point out marked percolation and hemorrhage in the alveoli. (D, F) Data are expressed as the mean ± SEM. N = 14 per group. (E) Data are expressed as the mean ± SEM. N = 10 per group. CON, control group; PM, PM2.5 group; ABX-PM, pulmonary microbiota intervention group.
Figure 4.
Figure 4.
Lung inflammatory cytokine mRNA expression level after PM2.5 instillation. Data are expressed as the mean ± SEM. CON, control group; PM, PM2.5 group; ABX-PM, pulmonary microbiota intervention group; N = 6 per group. *P < 0.05, **P < 0.01, values marked P < 0.10 in the figure.
Figure 5.
Figure 5.
Intervened pulmonary microbiota reduces changes in pulmonary microbiota diversity after PM2.5 exposure. (A) The Venn diagram demonstrates the number of OTUs existing in the three groups. (B–C) pulmonary microbiota richness (sobs, ACE, and Chao1) and diversity (Shannon and Simpson) were evaluated by one-way ANOVA. Data are expressed as the mean ± SEM. (D) The community composition of the pulmonary microbiota was analyzed at the OTU level by PCoA. The microbiota composition of the three groups was separated, with 36.24% and 13.55% of the variation explained by the principal components PC1 and PC2, respectively. P = 0.145000. (E) NMDS analysis was calculated at the OTU level. Stress = 0.074, P = 0.145000. (F) PLS-DA analysis at the OTU level of each sample. (G) Each sample’s community composition at the OTU level is shown with hierarchical clustering. (D–G) The distance matrix was calculated based on the Bray–Curtis algorithm. CON, control group; PM, PM2.5 group; ABX-PM, pulmonary microbiota intervention group; N = 5 per group.
Figure 6.
Figure 6.
Instillation of PM2.5 altered the relative abundance of bacterial taxa in the lung tissue. The composition and relative abundance of bacteria at the phylum (A) and genus (B) level in the three groups. (C) The differences in the 20 most dominant bacteria at the phylum level. (D) The differences in the 30 most dominant bacteria at the genus level. (E) The differences in the 15 most dominant bacteria at the species level. CON, control group; PM, PM2.5 group; ABX-PM, pulmonary microbiota intervention group; N = 5 per group. *P < 0.05, **P < 0.01.
Figure 7.
Figure 7.
The contribution of pulmonary bacterial taxa to the differences between different groups induced by PM2.5. (A) The cladogram revealed significantly enriched bacterial taxa. (B) Bar chart showing the LDA score of bacterial taxa in the three groups. Bacterial taxa are covered from the phylum to the genus level. Significant differences were defined as P < 0.05 and LDA score > 2.0. CON, control group; PM, PM2.5 group; ABX-PM, pulmonary microbiota intervention group; N = 5 per group. The analysis method is LDA LEfSe.
Figure 8.
Figure 8.
PM2.5 exposure alters microbial growth conditions in the broiler lung. The microbial growth conditions were analyzed ex vivo by inoculating 104 CFU of E. cecorum into sterilized BALF from broilers. E. cecorum CFU were then quantified after 6 h of growth. CON, control group; PM, PM2.5 group; ABX-PM, pulmonary microbiota intervention group. N = 3 per group; *P < 0.05, values marked P < 0.10 in the figure.

Similar articles

Cited by

References

    1. Bai, L., Zhou P., Li D., and Ju X.. . 2017. Changes in the gastrointestinal microbiota of children with acute lymphoblastic leukaemia and its association with antibiotics in the short term. J. Med. Microbiol. 66:1297–1307. doi:10.1099/jmm.0.000568 - DOI - PubMed
    1. Barfod, K. K., Vrankx K., Mirsepasi-Lauridsen H. C., Hansen J. S., Hougaard K. S., Larsen S. T., Ouwenhand A. C., and Krogfelt K. A.. . 2015. The murine lung microbiome changes during lung ­inflammation and intranasal vancomycin treatment. Open Microbiol. J. 9:167–179. doi:10.2174/1874285801509010167 - DOI - PMC - PubMed
    1. Bhatia, M., and Moochhala S.. . 2004. Role of inflammatory mediators in the pathophysiology of acute respiratory distress syndrome. J. Pathol. 202:145–156. doi:10.1002/path.1491 - DOI - PubMed
    1. Budden, K. F., Shukla S. D., Rehman S. F., Bowerman K. L., Keely S., Hugenholtz P., Armstrong-James D. P. H., Adcock I. M., Chotirmall S. H., Chung K. F., . et al.. 2019. Functional effects of the microbiota in chronic respiratory disease. Lancet. Respir. Med. 7:907–920. doi:10.1016/S2213-2600(18)30510-1 - DOI - PubMed
    1. Cambra-Lopez, M., Aarnink A. J., Zhao Y., Calvet S., and Torres A. G.. . 2010. Airborne particulate matter from livestock production systems: a review of an air pollution problem. Environ. Pollut. 158:1–17. doi:10.1016/j.envpol.2009.07.011 - DOI - PubMed

Publication types

Substances