

Duplex sequencing provides detailed characterization of mutation frequencies and spectra in the bone marrow of MutaMouse males exposed to procarbazine hydrochloride
- PMID: 37341741
- PMCID: PMC10322784
- DOI: 10.1007/s00204-023-03527-y
Duplex sequencing provides detailed characterization of mutation frequencies and spectra in the bone marrow of MutaMouse males exposed to procarbazine hydrochloride
Abstract
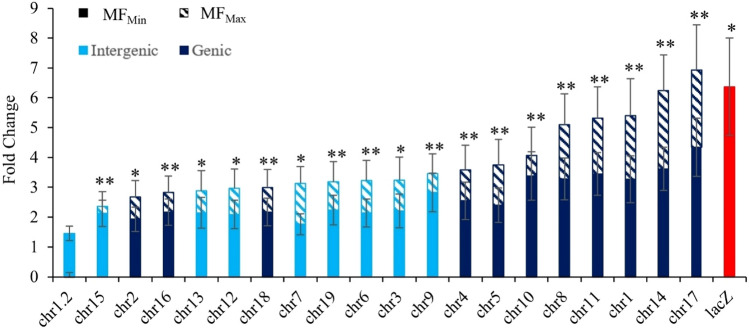
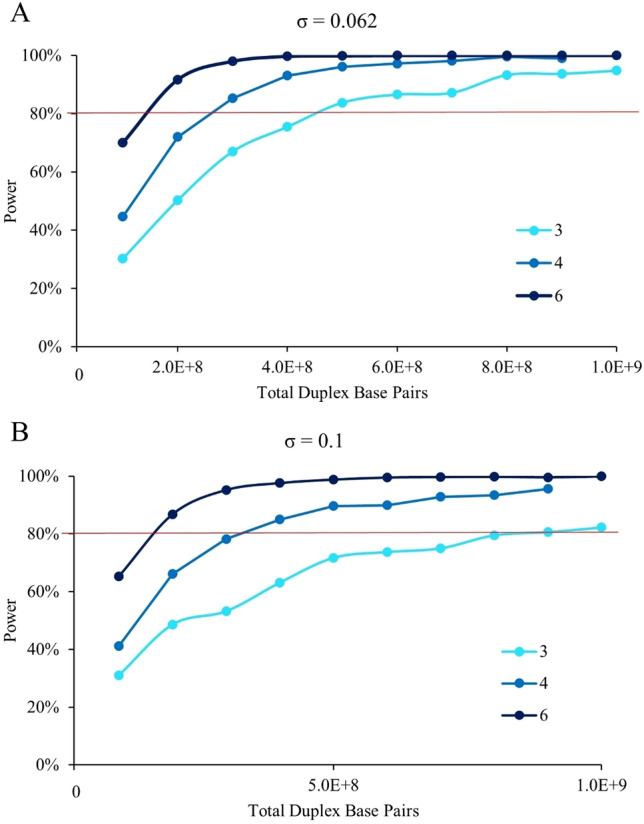
Mutagenicity testing is an essential component of health safety assessment. Duplex Sequencing (DS), an emerging high-accuracy DNA sequencing technology, may provide substantial advantages over conventional mutagenicity assays. DS could be used to eliminate reliance on standalone reporter assays and provide mechanistic information alongside mutation frequency (MF) data. However, the performance of DS must be thoroughly assessed before it can be routinely implemented for standard testing. We used DS to study spontaneous and procarbazine (PRC)-induced mutations in the bone marrow (BM) of MutaMouse males across a panel of 20 diverse genomic targets. Mice were exposed to 0, 6.25, 12.5, or 25 mg/kg-bw/day for 28 days by oral gavage and BM sampled 42 days post-exposure. Results were compared with those obtained using the conventional lacZ viral plaque assay on the same samples. DS detected significant increases in mutation frequencies and changes to mutation spectra at all PRC doses. Low intra-group variability within DS samples allowed for detection of increases at lower doses than the lacZ assay. While the lacZ assay initially yielded a higher fold-change in mutant frequency than DS, inclusion of clonal mutations in DS mutation frequencies reduced this discrepancy. Power analyses suggested that three animals per dose group and 500 million duplex base pairs per sample is sufficient to detect a 1.5-fold increase in mutations with > 80% power. Overall, we demonstrate several advantages of DS over classical mutagenicity assays and provide data to support efforts to identify optimal study designs for the application of DS as a regulatory test.
Keywords: Duplex sequencing; Error-corrected sequencing; Genetic toxicology; Mutagenesis; Transgenic rodent assay; ecNGS.
© 2023. Crown.
Conflict of interest statement
P.V., F. Y. L., C.C.V., and J.J.S. are employees and equity holders at TwinStrand Biosciences, Inc. and are authors on one or more Duplex Sequencing-related patents.
Figures


Similar articles
-
Power analyses to inform Duplex Sequencing study designs for MutaMouse liver and bone marrow.Environ Mol Mutagen. 2024 Oct;65(8):234-242. doi: 10.1002/em.22619. Epub 2024 Sep 12. Environ Mol Mutagen. 2024. PMID: 39267335
-
Duplex sequencing identifies unique characteristics of ENU-induced mutations in male mouse germ cells†.Biol Reprod. 2025 May 13;112(5):1015-1027. doi: 10.1093/biolre/ioaf029. Biol Reprod. 2025. PMID: 39936590 Free PMC article.
-
Integrated In Vivo Genotoxicity Assessment of Procarbazine Hydrochloride Demonstrates Induction of Pig-a and LacZ Mutations, and Micronuclei, in MutaMouse Hematopoietic Cells.Environ Mol Mutagen. 2019 Jul;60(6):505-512. doi: 10.1002/em.22271. Epub 2019 Jan 18. Environ Mol Mutagen. 2019. PMID: 30592561 Free PMC article.
-
Transgenic mouse mutation assay systems can play an important role in regulatory mutagenicity testing in vivo for the detection of site-of-contact mutagens.Mutagenesis. 1999 Jan;14(1):141-51. doi: 10.1093/mutage/14.1.141. Mutagenesis. 1999. PMID: 10474836 Review.
-
Use of transgenic mouse lacI/Z mutation assays in genetic toxicology.Mutagenesis. 1994 May;9(3):179-81. doi: 10.1093/mutage/9.3.179. Mutagenesis. 1994. PMID: 7934956 Review.
Cited by
-
Adverse Outcome Pathway-Informed Integrated Testing to Identify Chemicals Causing Genotoxicity Through Oxidative DNA Damage: Case Study on 4-Nitroquinoline 1-Oxide.Environ Mol Mutagen. 2025 Apr;66(4):185-198. doi: 10.1002/em.70011. Epub 2025 May 8. Environ Mol Mutagen. 2025. PMID: 40341686 Free PMC article.
-
Frequency and spectrum of mutations in human sperm measured using duplex sequencing correlate with trio-based de novo mutation analyses.Sci Rep. 2024 Oct 8;14(1):23134. doi: 10.1038/s41598-024-73587-2. Sci Rep. 2024. PMID: 39379474 Free PMC article.
-
Aflatoxin B1-Induced Hepatic Mutagenesis in Mice Expressing Gene-Edited Neil1.Environ Mol Mutagen. 2025 Apr;66(4):144-154. doi: 10.1002/em.70014. Epub 2025 May 8. Environ Mol Mutagen. 2025. PMID: 40342069
-
Evaluating the mutagenicity of N-nitrosodimethylamine in 2D and 3D HepaRG cell cultures using error-corrected next generation sequencing.Arch Toxicol. 2024 Jun;98(6):1919-1935. doi: 10.1007/s00204-024-03731-4. Epub 2024 Apr 7. Arch Toxicol. 2024. PMID: 38584193 Free PMC article.
-
Frequencies and spectra of aflatoxin B1-induced mutations in liver genomes of NEIL1-deficient mice as revealed by duplex sequencing.NAR Mol Med. 2024 May 17;1(2):ugae006. doi: 10.1093/narmme/ugae006. eCollection 2024 Apr. NAR Mol Med. 2024. PMID: 38779538 Free PMC article.
References
MeSH terms
Substances
Grants and funding
LinkOut - more resources
Full Text Sources
