. 2023 Jun 21:12:e81280.
doi: 10.7554/eLife.81280.

A critical region of A20 unveiled by missense TNFAIP3 variations that lead to autoinflammation

Affiliations

A critical region of A20 unveiled by missense TNFAIP3 variations that lead to autoinflammation

Elma El Khouri et al. Elife. .

Abstract

A20 haploinsufficiency (HA20) is an autoinflammatory disease caused by heterozygous loss-of-function variations in TNFAIP3, the gene encoding the A20 protein. Diagnosis of HA20 is challenging due to its heterogeneous clinical presentation and the lack of pathognomonic symptoms. While the pathogenic effect of TNFAIP3 truncating variations is clearly established, that of missense variations is difficult to determine. Herein, we identified a novel TNFAIP3 variation, p.(Leu236Pro), located in the A20 ovarian tumor (OTU) domain and demonstrated its pathogenicity. In the patients' primary cells, we observed reduced A20 levels. Protein destabilization was predicted in silico for A20_Leu236Pro and enhanced proteasomal degradation was confirmed in vitro through a flow cytometry-based functional assay. By applying this approach to the study of another missense variant, A20_Leu275Pro, for which no functional characterization has been performed to date, we showed that this variant also undergoes enhanced proteasomal degradation. Moreover, we showed a disrupted ability of A20_Leu236Pro to inhibit the NF-κB pathway and to deubiquitinate its substrate TRAF6. Structural modeling revealed that two residues involved in OTU pathogenic missense variations (i.e. Glu192Lys and Cys243Tyr) establish common interactions with Leu236. Interpretation of newly identified missense variations is challenging, requiring, as illustrated here, functional demonstration of their pathogenicity. Together with functional studies, in silico structure analysis is a valuable approach that allowed us (i) to provide a mechanistic explanation for the haploinsufficiency resulting from missense variations and (ii) to unveil a region within the OTU domain critical for A20 function.

Keywords: A20; A20 haploinsufficiency; TNFAIP3; genetics; genomics; human; immunology; inflammation; missense variation; pathogenic significance; proteasomal degradation.


Conflict of interest statement

EE, FD, CL, EA, AD, AN, WP, SD, AD, BC, FD, SK, SA, AA, IG No competing interests declared

Figures

Figure 1.
Figure 1.. Analysis of familial segregation of the c.707T>C, p.(Leu236Pro) variation and its localization on A20 protein.
(A) Upper panel – genealogical tree of the patients with A20 haploinsufficiency (HA20) (individuals I.1, II.1, and II.2). Lower panel – electropherograms from Sanger sequencing showing the heterozygous c.707T>C, p.(Leu236Pro) variation in individual II.2 but not in her healthy mother (individual I.2). (B) Schematic representation of A20 with domain organization showing the ovarian tumor (OTU) domain harboring the p.(Leu236Pro) variation as well as the zinc finger (ZnF) domains. (C) Evolutionary conservation of the A20 Leu236 residue across species.
Figure 1—figure supplement 1.
Figure 1—figure supplement 1.. Genealogical tree and electropherograms from Sanger sequencing of the patients with A20 haploinsufficiency (HA20) (individuals I.1, II.1, and II.2) and the healthy individual I.2.
Electropherograms from Sanger sequencing showing the heterozygous c.707T>C, p.(Leu236Pro) variation in individuals I.1, II.1, and II.2 but not in the healthy individual I.2.
Figure 2.
Figure 2.. Upper panel – ELISA-assessed plasma cytokine levels in the patients (individual I.1: red square, individual II.1: red triangle, and individual II.2: red circle) and five healthy donors (blue circles).
Lower panel – ELISA-assessed cytokine levels in peripheral blood mononuclear cell (PBMC) supernatants prior to (empty symbols) and upon (filled symbols) LPS treatment (100 ng/mL for 16 hr) (individual I.1: red square, individual II.1: red triangle, and individual II.2 red circle, and five healthy donors: blue circles). ND: not detected. Unpaired two-tailed Student’s t-test was used and asterisks indicate that the mean of the cytokine levels quantified in samples from five healthy individuals is significantly different from the mean of the cytokine levels quantified in samples from the three patients. p-Values <0.05 were considered statistically significant. p-Values <0.05, <0.01, and <0.001 are indicated with *, **, and ***, respectively.
Figure 3.
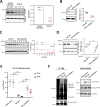
Figure 3.. Evaluation of the pathogenicity of the A20_Leu236Pro variation through cell-based assays.
(A) A20 protein expression in peripheral blood mononuclear cells (PBMCs) of healthy individuals and individuals I.1, II.1, and II.2. (B) Steady-state protein levels of A20_WT and A20_Leu236Pro upon transient expression in HEK293T (n=3, p-value = 0.0004). (C) Protein levels of A20_WT and A20_Leu236Pro upon transient expression in HEK293T and treatment with cycloheximide (100 μg/mL) at the indicated time points. (n=3, p-value = 0.0158, 0.0008, and 0.026 for time points 3, 9, and 24 hr, respectively). (D) Protein levels of A20_WT and A20_Leu236Pro upon transient expression in HEK293T and treatment with MG132 (20 μM – 5 hours) (+) or without MG132 (-) and with DMSO (n=3, p-values for (A20_WT-DMSO vs -MG132), (A20_Leu236Pro-DMSO vs -MG132), and (A20_WT-MG132 vs A20_Leu236Pro-MG132)=0.037, 0.006, and 0.125, respectively). (E) Quantification of the NF-κB signaling in HEK293T cells transiently expressing 25 or 50 ng of empty vector, A20_WT or A20_Leu236Pro. Cells were treated with 10 ng/mL TNFα for 5 hr. Firefly luciferase activity was normalized to the Renilla signal (n=5), p-values for (A20_WT vs Empty vector – 25 ng), (A20_WT vs A20_Leu236Pro – 25 ng), (A20_WT vs Empty vector – 50 ng), (A20_WT vs A20_Leu236Pro – 50 ng) are <0.0001, = 0.0011, = 0.0001, and = 0.0003, respectively. (F) Ubiquitination profile of A20 target TRAF6 (flag-tagged) upon co-expression with GFP-vector, GFP-tagged A20_WT, or A20_Leu236Pro together with HA-K63Ub. Flag-TRAF6 was immunoprecipitated from protein lysates using the ANTI-FLAG M2 Magnetic beads and high molecular weight ubiquitin aggregates were revealed by immunoblotting of precipitates with HA-specific antibody. The § sign indicates the antibody heavy chain. The expression of the proteins in the crude extracts is shown to the right. This experiment is representative of a set of three experiments performed independently. For all western blot experiments, equal amounts of protein extracts were subjected to SDS-PAGE and immunoblotted with the indicated antibodies. The A20 or GFP (the TNFAIP3-expressing plasmid used is pEGFP-C1-A20) signal was quantified with ImageJ software and normalized to the amount of GAPDH or α-tubulin used as a loading control. For (A, B, C, D, and E), unpaired two-tailed Student’s t-test was used and asterisks indicate that the mean is significantly different; p-values <0.05 were considered statistically significant. p-Values <0.05, <0.01, <0.001, and <0.0001 are indicated with *, **, ***, and ****, respectively. Data are plotted with SEM error bars.
Figure 4.
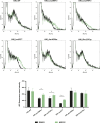
Figure 4.. Flow cytometry quantification of green fluorescent protein (GFP) intensity in protein extracts from HEK293T cells expressing GFP-tagged A20_WT or A20 variants treated with DMSO or MG132 (20 μM – 5 hr).
Representative fluorescence-activated cell sorting (FACS) profiles (counts versus FLH-1 – CyflowCube 6) are shown and the mean fluorescence values from A20 samples ± SEM are represented in the histograms (n=3). Unpaired two-tailed Student’s t-test was used and asterisks indicate that the mean is significantly different; p-values <0.05 were considered statistically significant. p-Values <0.05 and <0.001 are indicated with * and ***, respectively.
Figure 5.
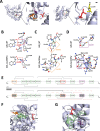
Figure 5.. Localization and interactions of amino acids involved in A20 variants.
(A) Amino acids Leu236 (red), Glu192 (orange), and Cys243 (purple) are placed on the crystal structure of the ovarian tumor (OTU) domain of A20 using the 3zjd crystal available of PDB and PyMol software. (B, C, D) Prediction of the amino acid interactions in A20_WT or A20 variant proteins established by (B) Leu236 (upper panel) or Pro236 (lower panel), (C) Glu192 (upper panel) or Lys192 (lower panel), (D) Cys243 (upper panel) or Tyr243 (lower panel), using the 3zjd crystal available of PDB and the PremPS in silico prediction tool. Oxygen atoms are represented in red; nitrogen atoms are represented in blue; the remaining atoms are in gray. The interactions are shown in dotted lines: hydrophobic (dark blue), polar (turquoise blue), and Van der Waals (green). (E) Schematic representation of the predicted amino acid interactions in A20_WT (upper panel) and the variant protein (lower protein). The amino acids involved in pathogenic variations are: Glu192 (orange frame), Leu236 (red frame), and Cys243 (purple frame). On the lower panel, the variant counterpart is represented in gray background and changes in amino acid interactions compared to A20_WT are represented in red: full lines represent newly formed interaction, dotted lines represent the loss of an interaction compared to A20_WT, the thicker line represents a higher number of possible interactions. (F, G) Amino acids are placed on the crystal structure of the OTU domain of A20 using the 3zjd crystal available of PDB and PyMol software: residues not affected by variations are shown in light green, Glu192 is shown in orange, Leu236 in red. and Cys243 in purple. In (F), the helix formed by amino acids 111–149 is hidden to allow for better graphical representation of the amino acids of interest.

Update of

  • doi: 10.1101/2022.07.29.502017

References

    1. Aeschlimann FA, Laxer RM. A20 Haploinsufficiency (Ha20): clinical phenotypes and disease course of patients with a newly recognised NF-kB-mediated Autoinflammatory disease. Annals of the Rheumatic Diseases. 2019;78:728–735. doi: 10.1136/annrheumdis-2018-213359. - DOI - PubMed
    1. Aslani N, Asnaashari K, Parvaneh N, Shahrooei M, Sotoudeh-Anvari M, Shahram F, Ziaee V. Tnfaip3 Mutation causing Haploinsufficiency of A20 with a Hemophagocytic Lymphohistiocytosis phenotype: a report of two cases. Pediatric Rheumatology Online Journal. 2022;20:78. doi: 10.1186/s12969-022-00735-1. - DOI - PMC - PubMed
    1. Boone DL, Turer EE, Lee EG, Ahmad RC, Wheeler MT, Tsui C, Hurley P, Chien M, Chai S, Hitotsumatsu O, McNally E, Pickart C, Ma A. The Ubiquitin-modifying enzyme A20 is required for termination of toll-like receptor responses. Nature Immunology. 2004;5:1052–1060. doi: 10.1038/ni1110. - DOI - PubMed
    1. Chen Yu, Huang H, He Y, Chen M, Seidler U, Tian D, Xiao F. A20 Haploinsufficiency in a Chinese patient with intestinal Behcet’s disease-like symptoms: A case report. Frontiers in Immunology. 2020a;11:1414. doi: 10.3389/fimmu.2020.01414. - DOI - PMC - PubMed
    1. Chen Y, Lu H, Zhang N, Zhu Z, Wang S, Li M, Keskin O. Premps: predicting the impact of Missense mutations on protein stability. PLOS Computational Biology. 2020b;16:e1008543. doi: 10.1371/journal.pcbi.1008543. - DOI - PMC - PubMed

Publication types

MeSH terms

Substances