. 2023 Jun 5:14:1181909.
doi: 10.3389/fpls.2023.1181909. eCollection 2023.

Polyploid GWAS reveals the basis of molecular marker development for complex breeding traits including starch content in the storage roots of sweet potato

Affiliations

Polyploid GWAS reveals the basis of molecular marker development for complex breeding traits including starch content in the storage roots of sweet potato

Emdadul Haque et al. Front Plant Sci. .

Abstract

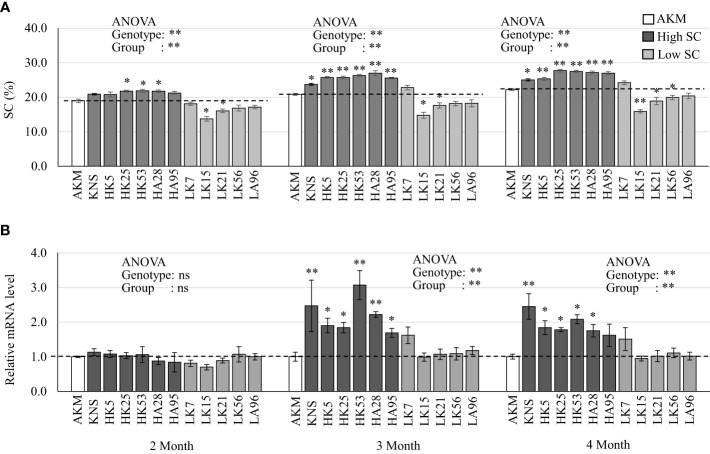
Given the importance of prioritizing genome-based breeding of sweet potato to enable the promotion of food and nutritional security for future human societies, here, we aimed to dissect the genetic basis of storage root starch content (SC) when associated with a complex set of breeding traits including dry matter (DM) rate, storage root fresh weight (SRFW), and anthocyanin (AN) content in a mapping population containing purple-fleshed sweet potato. A polyploid genome-wide association study (GWAS) was extensively exploited using 90,222 single-nucleotide polymorphisms (SNPs) obtained from a bi-parental 204 F1 population between 'Konaishin' (having high SC but no AN) and 'Akemurasaki' (having high AN content but moderate SC). Through the comparison of polyploid GWAS on the whole set of the 204 F1, 93 high-AN-containing F1, and 111 low-AN-containing F1 populations, a total of two (consists of six SNPs), two (14 SNPs), four (eight SNPs), and nine (214 SNPs) significantly associated signals were identified for the variations of SC, DM, SRFW, and the relative AN content, respectively. Of them, a novel signal associated with SC, which was most consistent in 2019 and 2020 in both the 204 F1 and 111 low-AN-containing F1 populations, was identified in homologous group 15. The five SNP markers associated with homologous group 15 could affect SC improvement with a degree of positive effect (~4.33) and screen high-starch-containing lines with higher efficiency (~68%). In a database search of 62 genes involved in starch metabolism, five genes including enzyme genes granule-bound starch synthase I (IbGBSSI), α-amylase 1D, α-amylase 1E, and α-amylase 3, and one transporter gene ATP/ADP-transporter were located on homologous group 15. In an extensive qRT-PCR of these genes using the storage roots harvested at 2, 3, and 4 months after field transplantation in 2022, IbGBSSI, which encodes the starch synthase isozyme that catalyzes the biosynthesis of amylose molecule, was most consistently elevated during starch accumulation in sweet potato. These results would enhance our understanding of the underlying genetic basis of a complex set of breeding traits in the starchy roots of sweet potato, and the molecular information, particularly for SC, would be a potential platform for molecular marker development for this trait.

Keywords: SNPs; complex breeding trait; polyploid GWAS; starch content; starch metabolizing gene; sweetpotato.


Conflict of interest statement

The authors declare that the research was conducted in the absence of any commercial or financial relationships that could be construed as a potential conflict of interest.

Figures

Figure 1
Figure 1
Frequency distribution of the breeding traits in 2019 and 2020 with the F1 population between cultivars Akemurasaki (AKM) and Konaishin (KNS). (A) SC (%; n = 206). (B) DM (%; n = 206). (C) SRFW (kg/plant; n = 206). (D) AN (A530; n = 206). Normality was checked with Shapiro–Wilk test at α = 0.05. SC, starch content; DM, dry matter; SRFW, storage root fresh weight; AN, anthocyanin.
Figure 2
Figure 2
Manhattan plots in the whole set of 204 F1 (designated as WSF1) population. (A) SC (%). (B) DM (%). (C) SRFW (kg/plant). (D) AN. The horizontal dashed red line represents the significance thresholds. The arrowhead indicates the location of the signal having significant SNP. Peaks that appeared in a similar position on the chromosome between or among traits are also marked with vertical shadows. SC, starch content; DM, dry matter; SRFW, storage root fresh weight; AN, anthocyanin; SNP, single-nucleotide polymorphism.
Figure 3
Figure 3
Manhattan plots in the low-AN-containing 111 F1 (LAF1) population. (A) SC (%). (B) DM (%). (C) SRFW (kg/plant). (D) AN. The horizontal dashed red line represents the significance thresholds. The arrowhead indicates the location of the signal having significant SNP. Peaks that appeared in a similar position on the chromosome between or among traits are also marked with vertical shadows. AN, anthocyanin; SC, starch content; DM, dry matter; SRFW, storage root fresh weight; SNP, single-nucleotide polymorphism.
Figure 4
Figure 4
Important features of the SNP markers from HG 15 toward molecular marker development for the high SC (%). Top panels of (A–E) indicate the markers ITR_CHR15_985591, ITR_CHR15_2753575, ITR_CHR15_2753578, and ITR_CHR15_4116419 in LAF1 mapping population from 2019 and the marker ITR_CHR15_3884083 in WSF1 mapping population from 2019. Based on the genotypes of SNPs, the average SC (%) scores of F1 lines are plotted. p-Value is significant based on one-way ANOVA. Bottom panels of (A–E) indicate frequency distribution of the SC (%) grouped by genotypes, based on SNP marker. Marker order is the same as the above. The putative effects of each SNP marker to screen high-starch-containing lines were determined as the percentage of [={the number of high-starch-containing (>20%) KNS lines + the number of low-starch-containing (<20%) AKM lines}/total number of F1 lines]. AKM, Akemurasaki; KNS, Konaishin; SNP, single-nucleotide polymorphism; SC, starch content; DM, dry matter; SRFW, storage root fresh weight; AN, anthocyanin.
Figure 5
Figure 5
Real-time PCR of starch-metabolizing genes in the storage roots of AKM, KNS, five high-starch-containing F1, and five low-starch-containing F1 lines at 2, 3, and 4 months after field transplantation. (A) SC (%). Single and double asterisks above the bars indicate statistically significant differences at p< 0.05 and p< 0.01 based on the pairwise t-test, respectively. (B) The expression of IbGBSSI. Gene expressions are presented relative to the expression level of AKM plants. The error bars represent the standard error of the measurement for three independent biological replications (n = 3). Transcript levels were normalized to an IbActin gene as an internal control. Asterisks above the bars indicate ΔCt values [=Ct(target) − Ct (Actin)] that are significantly different from those of the AKM plants, as revealed by pairwise t-test (*p< 0.05; **p< 0.01). For analysis of variance (ANOVA) among 12 genotypes or three groups (AKM, high SC, and low SC), ns, single, and double asterisks indicate non-significance, p< 0.05, and p< 0.01, respectively. H, high SC-containing F1 lines; L, low-starch-containing F1 lines; AKM, Akemurasaki; KNS, Konaishin; SC, starch content; DM, dry matter; SRFW, storage root fresh weight; AN, anthocyanin.
Figure 6
Figure 6
The action positions (red color) of IbGBSSI in a proposed model of starch accumulation. Starch metabolism pathway is shown by solid arrows. “↑” and “↓” indicate up- and down-regulation of the relative substrate or enzyme encoding genes.

References

    1. Cervantes-Flores J. C., Sosinski B., Pecota K. V., Mwanga R. O. M., Catignani G. L., Truong V. D., et al. . (2011). Identification of quantitative trait loci for dry-matter, starch, and β-carotene content in sweetpotato. Mol. Breed. 28, 201–216. doi: 10.1007/s11032-010-9474-5 - DOI
    1. Dufresne F., Stift M., Vergilino R., Mable B. K. (2014). Recent progress and challenges in population genetics of polyploid organisms: an overview of current state-of-the-art molecular and statistical tools. Mol. Ecol. 23, 40–69. doi: 10.1111/mec.12581 - DOI - PubMed
    1. Food and Agricultural Organization (FAO) . (2020). Crops and livestock products. Available at: https://www.fao.org/faostat/en/#data/QCL (Accessed February 2, 2023).
    1. Gemenet D. C., Pereira G. D. S., De Boeck B., Wood J. C., Mollinari M., Olukolu B. A., et al. . (2020). Quantitative trait loci and differential gene expression analyses reveal the basis for negatively-associated β-carotene and starch content in hexaploid sweetpotato [Ipomoea batatas (L.) lam.]. Theor. Appl. Genet. 133, 23–36. doi: 10.1007/s00122-019-03437-7 - DOI - PMC - PubMed
    1. Haque E., Tabuchi H., Monden Y., Suematsu K., Shirasawa K., Isobe S., et al. . (2020. a). QTL analysis and GWAS of agronomic traits in sweetpotato (Ipomoea batatas l.) using genome wide SNPs. Breed. Sci. 70, 283–291. doi: 10.1270/jsbbs.19099 - DOI - PMC - PubMed

LinkOut - more resources