. 2023 Jun 5:14:1198353.
doi: 10.3389/fpls.2023.1198353. eCollection 2023.

Syntaxin of plants71 plays essential roles in plant development and stress response via regulating pH homeostasis

Affiliations

Syntaxin of plants71 plays essential roles in plant development and stress response via regulating pH homeostasis

Hailong Zhang et al. Front Plant Sci. .

Abstract

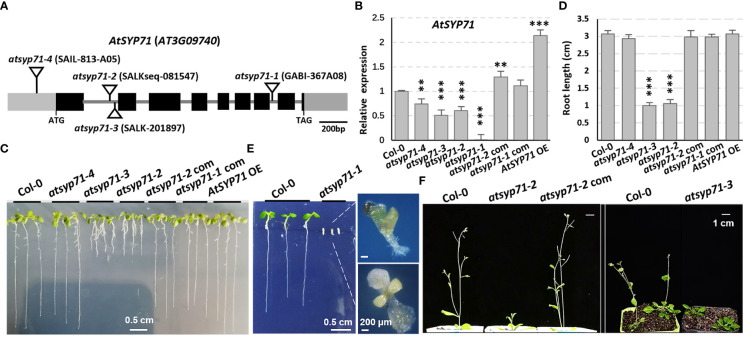
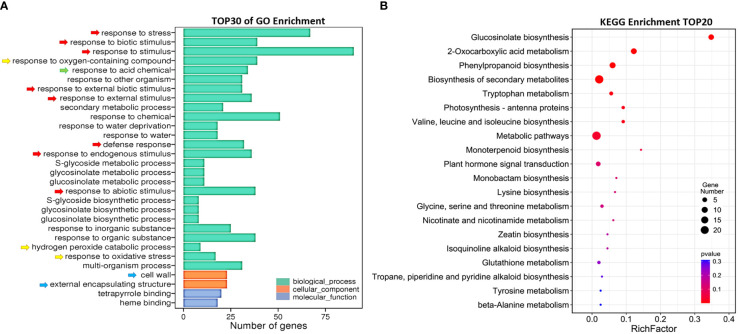
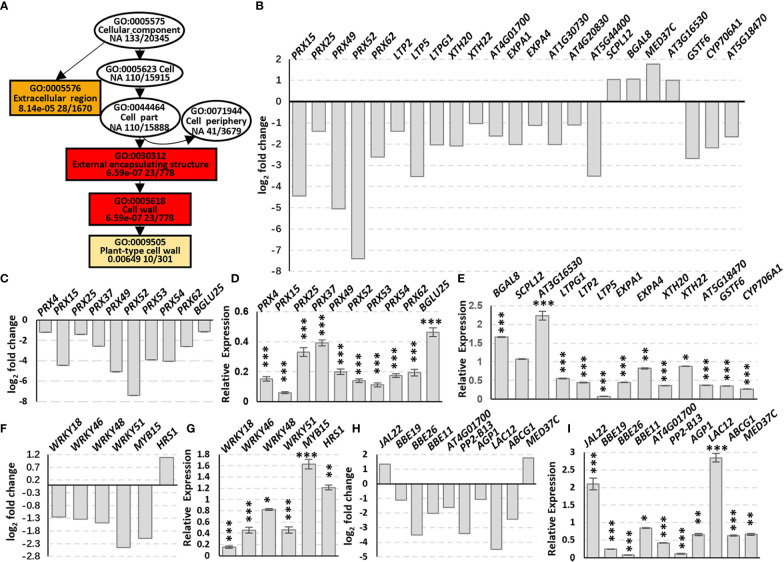
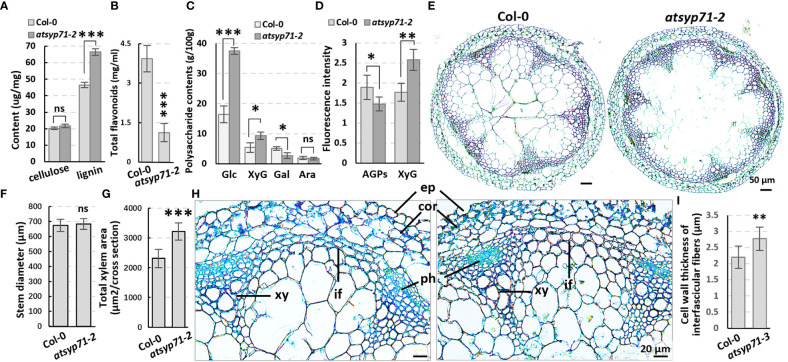
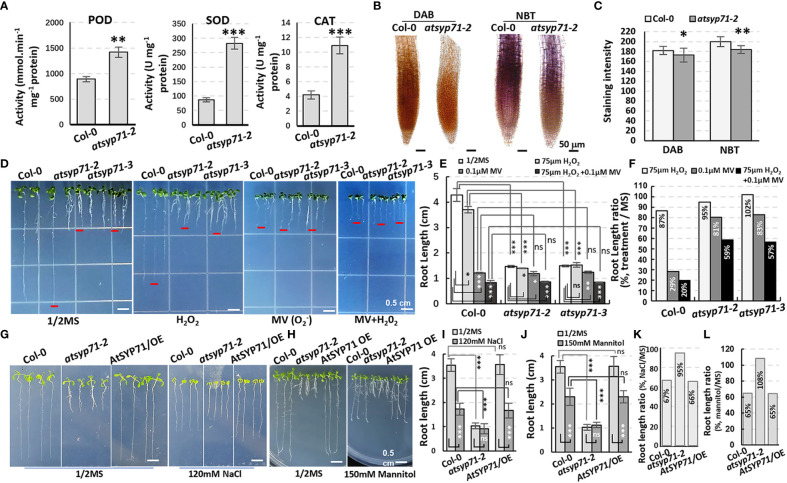
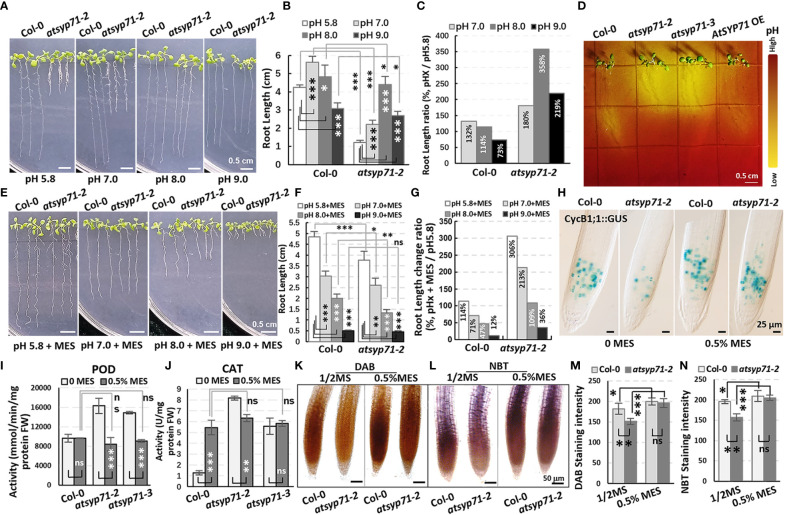
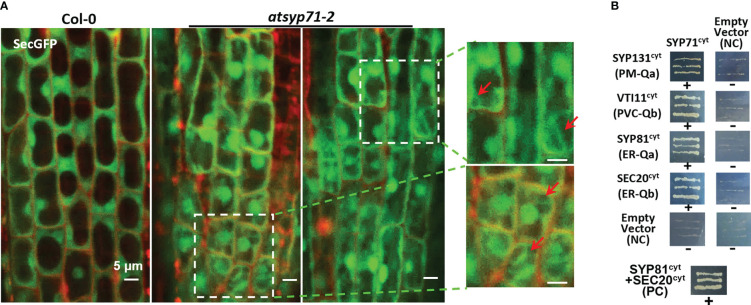
SYP71, a plant-specific Qc-SNARE with multiple subcellular localization, is essential for symbiotic nitrogen fixation in nodules in Lotus, and is implicated in plant resistance to pathogenesis in rice, wheat and soybean. Arabidopsis SYP71 is proposed to participate in multiple membrane fusion steps during secretion. To date, the molecular mechanism underlying SYP71 regulation on plant development remains elusive. In this study, we clarified that AtSYP71 is essential for plant development and stress response, using techniques of cell biology, molecular biology, biochemistry, genetics, and transcriptomics. AtSYP71-knockout mutant atsyp71-1 was lethal at early development stage due to the failure of root elongation and albinism of the leaves. AtSYP71-knockdown mutants, atsyp71-2 and atsyp71-3, had short roots, delayed early development, and altered stress response. The cell wall structure and components changed significantly in atsyp71-2 due to disrupted cell wall biosynthesis and dynamics. Reactive oxygen species homeostasis and pH homeostasis were also collapsed in atsyp71-2. All these defects were likely resulted from blocked secretion pathway in the mutants. Strikingly, change of pH value significantly affected ROS homeostasis in atsyp71-2, suggesting interconnection between ROS and pH homeostasis. Furthermore, we identified AtSYP71 partners and propose that AtSYP71 forms distinct SNARE complexes to mediate multiple membrane fusion steps in secretory pathway. Our findings suggest that AtSYP71 plays an essential role in plant development and stress response via regulating pH homeostasis through secretory pathway.

Keywords: AtSYP71; ROS homeostasis; cell wall biosynthesis and dynamics; pH homeositasis; root development; vesicle trafficking.


Conflict of interest statement

The authors declare that the research was conducted in the absence of any commercial or financial relationships that could be construed as a potential conflict of interest.

Figures

Figure 1
Figure 1
AtSYP71 is essential for plant morphogenesis and early development. (A) AtSYP71 gene structure diagram. Black boxes represent exons, gray lines represent introns, and gray boxes represent untranslated regions (UTRs). The triangles indicate the T-DNA insertion sites of the atsyp71 mutants. (B) Statistics of RT-qPCR detection of the relative expression levels of AtSYP71 in atsyp71 mutants, the atsyp71 complementation lines and AtSYP71 overexpression line. Three independent experiments per sample, two repeats per experiment. (C) Phenotype of seven-day-old seedlings of Col-0, atsyp71 mutants, atsyp71-2 com and AtSYP71 OE lines. (D) Statistics of primary root length of the displayed genotypes (n ≥ 44). Three biological replicates per sample. **P < 0.01; ***P < 0.001. Student’s t test. (E) Five-day-old seedlings of Col-0 and atsyp71-4 mutant. Magnified pictures highlighted growth defects of atsyp71-4. Bar, 0.5 cm. (F) Bolting of atsyp71-2 and atsyp71-3 was delayed. Four- (right panel) and five (left panel)-week-old plants of the displayed genotypes.
Figure 2
Figure 2
Comparative transcriptome analysis of DEGs in atsyp71-2. (A) Gene ontology (GO) enrichment analysis of DEGs. X axis represents DEG number. Y axis represents GO terms. (B) Top 20 pathways of KEGG enrichment analysis. X axis represents enrichment factors; Y axis represents pathways. The color bar indicates the P value, the circle size indicates DEG number.
Figure 3
Figure 3
Changes in DEG Enrichment in atsyp71-2 mutant. (A) The enriched GO terms in Cellular component (GO:0005575) of DEGs in Col-0 and atsyp71-2 seedlings. Rectangles indicate the significant terms. The colors of rectangles and ovals represent the relative significances, ranging from red (the most significant, P < 0.0001), orange (the second significant, P < 0.001), light yellow (the third significant; P < 0.05) and white (no significance). (B) Transcriptomic analysis of DEGs in CC. (C) Statistics of RT-qPCR analysis of DEG expression levels in (B). (D, E) Transcriptomic analysis and statistics of RT-qPCR analysis of DEGs in Phenylpropanoid biosynthesis pathway. (F, G) Transcriptomic analysis and statistics of RT-qPCR analysis of some other DEGs related to cell wall biosynthesis. (H, I) Transcriptomic analysis and statistics of RT-qPCR detection of Transcription factors related to cell wall biosynthesis. Total RNA for RT-qPCR analysis were from roots of seven-day-old seedlings. All RT-qPCR Data are presented from three independent experiments performed with four technical replicates per sample. *P < 0.05; **P < 0.01; ***P < 0.001; Student’s t-test. Abbreviations: ABCG1, ATP binding cassette sub-family G 1; AGP1, Arabinogalactan protein 1; BBE19/OGOX1, FAD-binding Berberine Bridge Enzyme 19/oligogalacturonide oxidase 1; BGAL8, beta-galactosidase 8; BGLU25, beta glucosidase 25; CYP706A1, cytochrome p450 family 706, subfamily A, polypeptide 1; EXPA1, expansin A1; GSTF6, glutathione s-transferase 6; JAL22, jacalin-related lectin 22; LAC12, LACCASE 12; LTP2 (lipid transfer protein 2); LTPG1 (glycosylphosphatidylinositol-anchored lipid protein transfer 1), PP2-B13, PHLOEM PROTEIN 2-B13; PRX, peroxidase; SCPL12, serine carboxypeptidase-like 12; XTH20, xyloglucan endotransglucosylase/hydrolase 20.
Figure 4
Figure 4
The cell wall components and structure altered in atsyp71-2 mutant. (A-C) Statistics of contents of lignin, cellulose (A), polysaccharides (B) and total flavonoids (C) in the first section of stems from ten-week-old plants. Three biological replicates per sample. (D) Statistics of fluorescence intensity of Immunolabeling of AGPs with anti-LM2 antibody and XXXG xyloglucan with anti-LM15 antibody, respectively.nCol-0 = 6, n atsyp71-2 =  7. (E) The paraffin sections with Safranine and Fast Green double staining of stems from the same batch as those in (A). (F, G) Statistics of stem diameter (E) and total xylem area (F) shown representatively in (D). n≥8 stems. (H) Magnified images of the stem cross sections. (I) Statistics of cell wall thickness of interfascicular fiber cells. n≥50 cells. *P < 0.05; **P < 0.01; ***P < 0.001. Student’s t test. Ara, arabinose; Gal, galactose; Glu, glucose; XyG, xyloglucan; co, cortex; ep, epidermis; if, interfascicular fibers; ph, phloem; xy, xylem. ns, no significance.
Figure 5
Figure 5
Alteration of ROS homeostasis and stress response in atsyp71 mutants. (A) Statistics of antioxidase activities in roots of nine-day-old Col-0 and atsyp71-2 seedlings. (B) DAB and NBT staining of roots of Col-0 and atsyp71-2 nine-day-old seedlings. (C) Statistics of DAB and NBT staining intensities measured by Photoshop 2019. (D) Treatments on Col-0 and atsyp71 nine-day-old seedlings with 75 μm H2O2, 0.1 μM MV, or 75 μm H2O2 + 0.1 μM MV. n≈50. Three biological replicates per sample. (E) Statistics of root length shown representatively in (D). (F) Statistics of ratio of root length in (E). (G) Seven-day-old seedlings under 120 mM NaCl treatment. (H) Nine-day-old seedlings under 150 mM mannitol treatment. (I, J) Statistics of root length in (G, H), respectively. n≈50. Three biological replicates per sample. (K, L) Statistics of ratio of root length in (I, J), respectively. ns, no significance; *P < 0.05; **P < 0.01; ***P < 0.001. Student’s t test.
Figure 6
Figure 6
Alkali stress response altered in atsyp71 mutants. (A) Phenotype of nine-day-old seedlings grown on 1/2MS medium with different pH value. (B) Statistics of root length of seedlings in (A). (C) Statistics of ratio of root length in (B). (D) Visualization of root acidification of Col-0, atsyp71 mutants nd AtSYP71 OE seedlings using the pH indicator, bromocresol purple. Five-day-old seedlings grown on 1/2MS medium (pH5.8) were transferred to 1/2MS medium (pH 6.8) containing 0.006% (w/v) bromocresol purple, and photographed three-day after transfer. (E) Phenotype of nine-day-old seedlings grown on 1/2MS medium containing 0.5% MES with different pH value. (F) Statistics of root length of seedlings in (E). (G) Statistics of ratio of root length in (F). (H) Nomarski images of CycB1;1::GUS-expressing cells in roots of nine-day-old Col-0 and atsyp71-2 seedlings. (I, J) POD (H) and CAT (I) activities of nine-day-old seedlings grown on 1/2MS medium (pH5.8) with or without 0.5% MES. (K, L) DAB (K) and NBT (L) staining of nine-day-old seedlings grown on 1/2MS medium (pH5.8) with or without 0.5% MES. (M, N) Statistics of staining intensities in (K) and (L). ns, no significance; *P < 0.05; **P < 0.01; ***P < 0.001. Student’s t test.
Figure 7
Figure 7
AtSYP71 regulated secretion. (A) Confocal images of SecGFP in Col-0 and atsyp71-2 with PI staining. The magnified images on the right are the part with white boxes. Arrows indicate the cytoplasmic localization of Sec-GFP. (B) Yeast two hybrid analysis of AtSYP71 interactors. Yeast strain AH109 was transformed with the paired constructs as shown. Transformants were streaked onto SD/_Leu/_Trp/_His/_Ade medium. AtSYP81/pGADT7 vs AtSec20/pGBKT7 served as a positive control. Each construct and its corresponding empty vector were used as negative controls. cyt, cytoplasmic fragment; FL, full length. +, has an interaction; -, no interaction.

Similar articles

Cited by

References

    1. Adnan M., Islam W., Zhang J., Zheng W., Lu G. D. (2019). Diverse role of SNARE protein Sec22 in vesicle trafficking, membrane fusion, and autophagy. Cells 8, (4). doi: 10.3390/cells8040337 - DOI - PMC - PubMed
    1. Alejandro S., Lee Y., Tohge T., Sudre D., Osorio S., Park J., et al. . (2012). AtABCG29 is a monolignol transporter involved in lignin biosynthesis. Curr. Biol. 22 (13), 1207–1212. doi: 10.1016/j.cub.2012.04.064 - DOI - PubMed
    1. Alexandersson E., Saalbach G., Larsson C., Kjellbom P. (2004). Arabidopsis plasma membrane proteomics identifies components of transport, signal transduction and membrane trafficking. Plant Cell Physiol. 45 (11), 1543–1556. doi: 10.1093/pcp/pch209 - DOI - PubMed
    1. Almagro L., Gomez Ros L. V., Belchi-Navarro S., Bru R., Ros Barcelo A., Pedreno M. A. (2009). Class III peroxidases in plant defence reactions. J. Exp. Bot. 60 (2), 377–390. doi: 10.1093/jxb/ern277 - DOI - PubMed
    1. Anders S., Huber W. (2010). Differential expression analysis for sequence count data. Genome Biol. 11 (10), R106. doi: 10.1186/gb-2010-11-10-r106 - DOI - PMC - PubMed

LinkOut - more resources