. 2023 Jun 5:10:1169658.
doi: 10.3389/fmolb.2023.1169658. eCollection 2023.

Fibin regulates cardiomyocyte hypertrophy and causes protein-aggregate-associated cardiomyopathy in vivo

Affiliations

Fibin regulates cardiomyocyte hypertrophy and causes protein-aggregate-associated cardiomyopathy in vivo

Matthias Petersen et al. Front Mol Biosci. .

Abstract

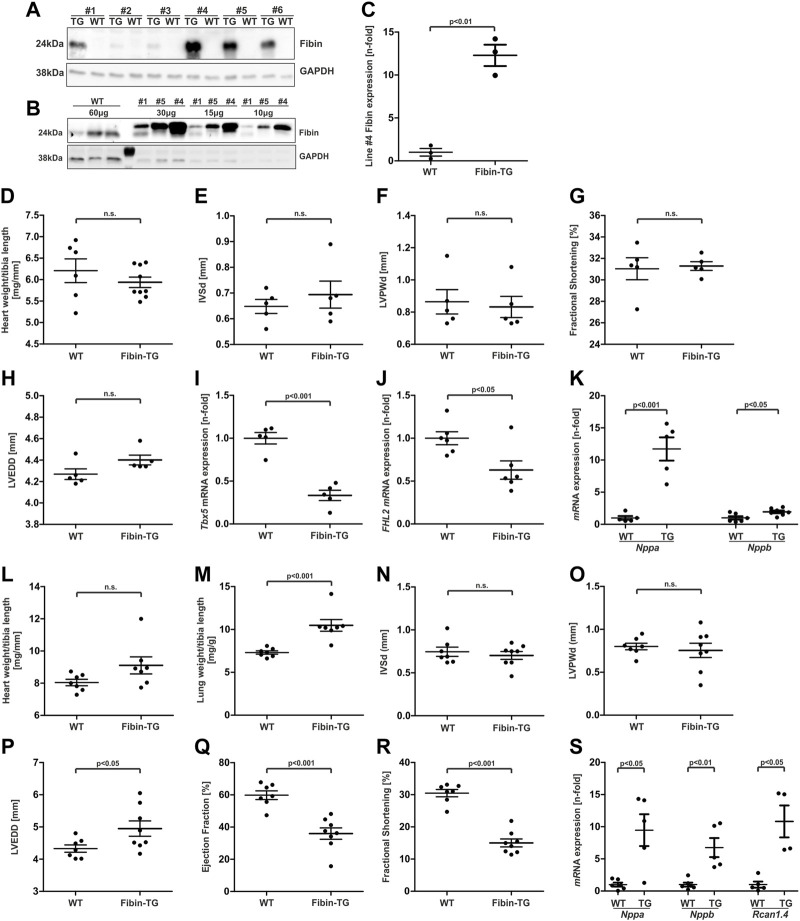
Despite the identification of numerous molecular pathways modulating cardiac hypertrophy its pathogenesis is not completely understood. In this study we define an unexpected role for Fibin ("fin bud initiation factor homolog") in cardiomyocyte hypertrophy. Via gene expression profiling in hypertrophic murine hearts after transverse aortic constriction we found a significant induction of Fibin. Moreover, Fibin was upregulated in another mouse model of cardiac hypertrophy (calcineurin-transgenics) as well as in patients with dilated cardiomyopathy. Immunoflourescence microscopy revealed subcellular localization of Fibin at the sarcomeric z-disc. Overexpression of Fibin in neonatal rat ventricular cardiomyocytes revealed a strong anti-hypertrophic effect through inhibiting both, NFAT- and SRF-dependent signalling. In contrast, transgenic mice with cardiac-restricted overexpression of Fibin developed dilated cardiomyopathy, accompanied by induction of hypertrophy-associated genes. Moreover, Fibin overexpression accelerated the progression to heart failure in the presence of prohypertrophic stimuli such as pressure overload and calcineurin overexpression. Histological and ultrastructural analyses surprisingly showed large protein aggregates containing Fibin. On the molecular level, aggregate formation was accompanied by an induction of the unfolded protein response subsequent UPR-mediated apoptosis and autophagy. Taken together, we identified Fibin as a novel potent negative regulator of cardiomyocyte hypertrophy in vitro. Yet, heart-specific Fibin overexpression in vivo causes development of a protein-aggregate-associated cardiomyopathy. Because of close similarities to myofibrillar myopathies, Fibin represents a candidate gene for cardiomyopathy and Fibin transgenic mice may provide additional mechanistic insight into aggregate formation in these diseases.

Keywords: NFAT signalling; SRF signalling; cardiac hypertrophy; cardiac z-disc; fibin; protein aggregate associated cardiomyopathy.


Conflict of interest statement

The authors declare that the research was conducted in the absence of any commercial or financial relationships that could be construed as a potential conflict of interest.

Figures

FIGURE 1
FIGURE 1
Fibin is upregulated in murine models of cardiac hypertrophy and in patients with dilated cardiomyopathy (DCM). Fibin mRNA expression in (A) mice after transverse aortic constriction (TAC), (B) in calcineurin-transgenic mice (CnA-TG) (n = 6 per group), and (C) in patients with DCM (n = 9, vs human non failing hearts NF, n = 6) detected by qPCR. The expression of Fibin was measured 2 weeks after TAC. The CnA-TG and their littermates were killed at the age of 2 months. All values are expressed as mean ± SEM. Significance was assessed by two-tailed Student´s t-test.
FIGURE 2
FIGURE 2
Adenoviral overexpression of Fibin in NRVCMs inhibits cardiomyocyte hypertrophy induced by phenylephrine while knockdown of Fibin induces hypertrophic signalling. (A) Overexpression of Fibin in neonatal rat ventricular cardiomyocytes (NRVCMs) at the mRNA- (n = 3 per group, one experiment, two-tailed Student´s t-test) and (B) protein level. (C) Nppa expression in NRVCMs after overexpression of Fibin and/or stimulation with phenylephrine (PE) (n = 6 per condition, two independent experiments, two-way ANOVA followed by Student-Newman-Keuls post hoc test). (C) Nppa mRNA expression (n = 6 per condition, two independent experiments, two-way ANOVA followed by Student-Newman-Keuls post hoc test), (D) Nppb mRNA expression (n = 8–9 per condition, three independent experiments, two-way ANOVA followed by Student-Newman-Keuls post hoc test) and (E) Rcan1.4 mRNA expression (n = 8–9 per condition, three independent experiments, two-way ANOVA followed by Student-Newman-Keuls post hoc test) in NRVCMs after overexpression of Fibin and/or stimulation with phenylephrine (PE), detected by qPCR. (F) Cell surface area (CSA) of NRVCMs under Fibin overexpression and/or PE stimulation (n > 1000 per condition, two independent experiments, two-way ANOVA followed by Student-Newman-Keuls post hoc test). (G) Representative images of β-galactosidase (50 moi) and Fibin (50 moi)-overexpressing cardiomyocytes stained with an α-actinin antibody. Red: α-actinin, blue: DAPI. (H) Knockdown of Fibin in NRVCMs on mRNA- (n = 3, one experiment, two-tailed Student´s t-test) and (I) on protein level. (J) Nppa mRNA expression in NRVCMs after knockdown of Fibin and/or PE stimulation (n = 9 per condition, three independent experiments, two-way ANOVA followed by Student-Newman-Keuls post hoc test). (K) CSA of NRVCMs after knockdown of Fibin and/or PE stimulation (n > 1800 per condition, three independent experiments, two-way ANOVA followed by Student-Newman-Keuls post hoc test). (L) Representative images of miRneg (200 moi) and miRFibin (200 moi) overexpressing cardiomyocytes stained with an α-actinin antibody. Red: α-Actinin, blue: DAPI. Boxplots with mean and interquartile range, whiskers show 5th and 95th percentiles, dots represent outliers from this range.
FIGURE 3
FIGURE 3
Fibin co-localizes with α-actinin at the sarcomeric z-disc and effectively inhibits NFAT- and SRF-dependent gene expression. (A) Co-staining of Fibin and α-actinin or Myomesin in neonatal rat ventricular cardiomyocytes (NRVCMs) using specific antibodies. (B) Overexpression of a Fibin-GFP fusion protein in NRVCMs and co-staining with α-actinin and Myomesin. (C) Co-localization of Fibin and α-actinin at the sarcomeric z-disc in murine heart tissue sections. (D) Tbx5 mRNA expression in NRVCMs overexpressing Fibin (n = 12 per group, two independent experiments, two-tailed Student´s t-test), detected by qPCR. (E) Effect of Fibin on SRF-dependent gene expression in absence or presence of RhoA (n = 17–18 per condition, three independent experiments, Kruskal-Wallis one-way analysis of variance). (F) Effect of Fibin on NFAT-dependent gene expression in absence or presence of constitutively active variant of calcineurin (n = 17-18 per condition, three independent experiments, Kruskal-Wallis one-way analysis of variance).
FIGURE 4
FIGURE 4
Basic characterization of mice with cardiac-specific overexpression of Fibin. (A and B) Transgenic overexpression of Fibin in different founder lines detected by Western blot. Lines #1, #4 and #5 were selected for further analyses. In this figure the data are presented for male animals of line #4 with the highest Fibin expression. For the basic characterization of female mice and transgenic lines #1 and #5 see Supplementary Material. Analyses of Fibin-TG mice at the age of 8 weeks: (C) Quantification of overexpression of Fibin in Fibin-TG mice of line #4 detected by Western blot, (D) heart weight to tibia length ratio (WT n = 6, Fibin-TG n = 9), (E) interventricular septum thickness at end-diastole (IVSd, n = 5), (F) left ventricular posterior wall thickness at end-diastole (LVPWd, n = 5), (G) fractional shortening (n = 5), (H) left ventricular end diastolic diameter diameter (LVEDD) (n = 5), (I) Tbx5 mRNA expression (n = 5) detected by qPCR, (J) FHL2 mRNA expression (n = 6) detected by qPCR and (K) Nppa (n = 5) and Nppb (n = 6–7) mRNA expression detected by qPCR. (L-S) Analyses of male Fibin-TG mice at the age of 6 months: (L) Heart weight to tibia length ratio (n = 7), (M) lung weight to tibia length ratio (n = 7), (N) interventricular septum thickness at end-diastole (IVSd, WT n = 7, Fibin-TG n = 8), (O) left ventricular posterior wall thickness at end-diastole (LVPWd, WT n = 7, Fibin-TG n = 8), (P) LVEDD (WT n = 7, Fibin-TG n = 8), (Q) ejection fraction (WT n = 7, Fibin-TG n = 8), (R) fractional shortening (WT n = 7, Fibin-TG n = 8), and (S) Nppa (n = 5-6), Nppb (n = 5–6) and Rcn1.4 (n = 4–5) mRNA expression detected by qPCR. Statistical significances were calculated by two-tailed Student´s t-test.
FIGURE 5
FIGURE 5
Transgenic overexpression of Fibin in mice promotes cardiac dysfunction after transverse aortic constriction (TAC). Morphological analyses of male Fibin-TG mice after TAC at the age of 8 weeks: (A) Left ventricular (LV) weight to body weight ratio, (B) LV weight to tibia length ratio, (C) lung weight to body weight ratio (WT sham n = 5, WT TAC n = 7, Fibin-TG sham n = 5, Fibin-TG TAC n = 8). Echocardiographic analyses of male Fibin-TG mice 2 weeks after TAC at the age of 8 weeks: (D) Interventricular septum thickness at end-diastole (IVSd), (E) left ventricular posterior wall thickness at end-diastole (LVPWd), (F) ejection fraction, (G) fractional shortening, (H) left ventricular end diastolic diameter (LVEDD) (WT sham n = 5, WT TAC n = 7, Fibin-TG sham n = 6-7, Fibin TG TAC n = 9). (I) Nppa mRNA expression levels (WT sham n = 5, WT TAC n = 5, Fibin-TG sham n = 5, Fibin-TG TAC n = 6) (J) Nppb mRNA expression levels (WT sham n = 5, WT TAC n = 6, Fibin-TG sham n = 6, Fibin-TG TAC n = 7) and (K) Rcan.1.4 mRNA expression levels (WT sham n = 5, WT TAC n = 6, Fibin-TG sham n = 5, Fibin-TG TAC n = 7) in Fibin-TG mice after TAC detected by qPCR. (L) Cell surface area (CSA) of single cardiomyocytes of Fibin-TG mice after TAC (WT sham n = 367, WT TAC n = 358, Fibin-TG sham n = 373, Fibin-TG TAC n = 367). (M) Representative images of lectin stained tissue sections for the measurement of CSA of single cardiomyocytes. Statistical significances were calculated by two-way ANOVA followed by Student-Newman-Keuls post hoc test.
FIGURE 6
FIGURE 6
Fibin overexpression in Calcineurin-TG mice attenuates cardiac hypertrophy but promotes heart failure. Characterisation of male Fibin-TG and Calcineurin-TG crossbreeds at the age of 6 weeks. (A) Heart weight to tibia length ratios of Fibin-TG and Calcineurin-TG (CnA-TG) crossbreeds (WT n = 9, CnA-TG n = 7, Fibin-TG n = 6, Fibin-TG/CnA-TG n = 6). Echocardiographic analyses of Fibin-TGxCnA-TG crossbreeds: (B) Interventricular septum thickness at end-diastole (IVSd), (C) left ventricular posterior wall thickness at end-diastole (LVPWd), (D) ejection fraction, (E) fractional shortening, (F) left ventricular end diastolic diameter (LVEDD) (WT n = 9, CnA-TG n = 6, Fibin-TG n = 7, Fibin-TG/CnA-TG n = 5). (G) Nppa mRNA expression levels (WT n = 5, CnA-TG n = 6, Fibin-TG n = 6, Fibin-TG/CnA-TG n = 6) and (H) Rcan1.4 mRNA expression levels (WT n = 6, CnA-TG n = 6, Fibin-TG n = 5, Fibin-TG/CnA-TG n = 5) in Fibin-TGxCnA-TG crossbreeds, detected by qPCR. (I) Cell surface area (CSA) of single cardiomyocytes in Fibin-TGxCnA-TG crossbreeds (WT n = 397, CnA-TG n = 384, Fibin-TG n = 362, Fibin-TG/CnA-TG n = 388). (J) Representative images of lectin stained tissue sections for the measurement of CSA of single cardiomyocytes. Statistical significances were calculated by two-way ANOVA followed by Student-Newman-Keuls post hoc test.
FIGURE 7
FIGURE 7
Fibin overexpression in mice leads to protein-aggregate-associated cardiomyopathy with induction of unfolded protein response (UPR), UPR-mediated apoptosis, autophagy and cardiac fibrosis. (A) Electron microscopy of heart tissue sections of Fibin-TG mice. A: Aggregate, M: Mitochondria, Z: Z-disc. (B–D) Immunostaining of heart tissue sections of Fibin-TG mice with Proteostat fluorescence dye, antibodies against Fibin, αβ-crystallin and Desmin. (E–I) Western blot analysis of proteins involved in autophagy, unfolded protein response (UPR) and UPR-mediated apoptosis in Fibin-TG and wildtype mice: Protein levels of (F) LC3-II and p62, (G) BIP, PDI and IRE1α, (H) Caspase 12 and cleaved Caspase (WT n = 7, TG n = 6), (I) Caspase 3 and Caspase 7 (WT n = 7, TG n = 6). LC3-II is normalized to GAPDH, all other proteins are normalized to whole protein content stained by Ponceau. (J and K) Masson trichrome staining of heart tissue sections of Fibin-TG mice and quantification of myocardial fibrosis (WT n = 10, Fibin-TG n = 8).(L) and (M) Ccn2 and Postn mRNA expression levels in male Fibin-TG mice after TAC at the age of 8 weeks measured by qPCR. (N) and (O) Ccn and Postn mRNA expression levels in Fibin-TGxCnA-TG crossbreeds at the age of 6 weeks measured by qPCR. (P) Immunostainings of Fibin and Myozap on heart tissue sections of Myozap-TG and wildtype mice. Except panel (L–O) all experiments were performed with heart tissue sections or protein samples of male Fibin-TG mice at the age of 8 weeks. Statistical significances were calculated by two-tailed Student´s t-test or two-way ANOVA followed by Student-Newman-Keuls post hoc test.

Similar articles

Cited by

References

    1. Batonnet-Pichon S., Behin A., Cabet E., Delort F., Vicart P., Lilienbaum A. (2017). Myofibrillar myopathies: New perspectives from animal models to potential therapeutic approaches. J. Neuromuscul. Dis. 4 (1), 1–15. 10.3233/JND-160203 - DOI - PMC - PubMed
    1. Bueno O. F., Wilkins B. J., Tymitz K. M., Glascock B. J., Kimball T. F., Lorenz J. N., et al. (2002). Impaired cardiac hypertrophic response in Calcineurin Abeta -deficient mice. Proc. Natl. Acad. Sci. U. S. A. 99 (7), 4586–4591. 10.1073/pnas.072647999 - DOI - PMC - PubMed
    1. Claeys K. G., Fardeau M. (2013). Myofibrillar myopathies. Handb. Clin. Neurol. 113, 1337–1342. 10.1016/B978-0-444-59565-2.00005-8 - DOI - PubMed
    1. Dorn G. W., 2nd (2009). Apoptotic and non-apoptotic programmed cardiomyocyte death in ventricular remodelling. Cardiovasc Res. 81 (3), 465–473. 10.1093/cvr/cvn243 - DOI - PMC - PubMed
    1. Frank D., Frey N. (2011). Cardiac Z-disc signaling network. J. Biol. Chem. 286 (12), 9897–9904. 10.1074/jbc.R110.174268 - DOI - PMC - PubMed