. 2023 May 23;14(6):2839-2856.
doi: 10.1364/BOE.488761. eCollection 2023 Jun 1.

Measurement of rat and human tissue optical properties for improving the optical detection and visualization of peripheral nerves

Affiliations

Measurement of rat and human tissue optical properties for improving the optical detection and visualization of peripheral nerves

Ezekiel J Haugen et al. Biomed Opt Express. .

Abstract

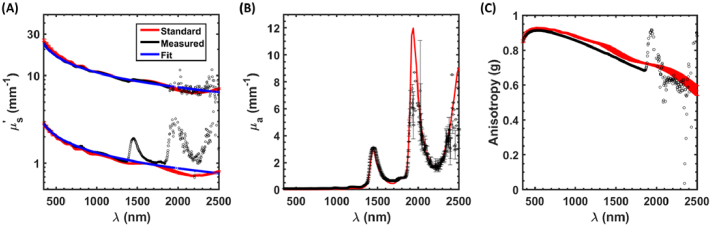
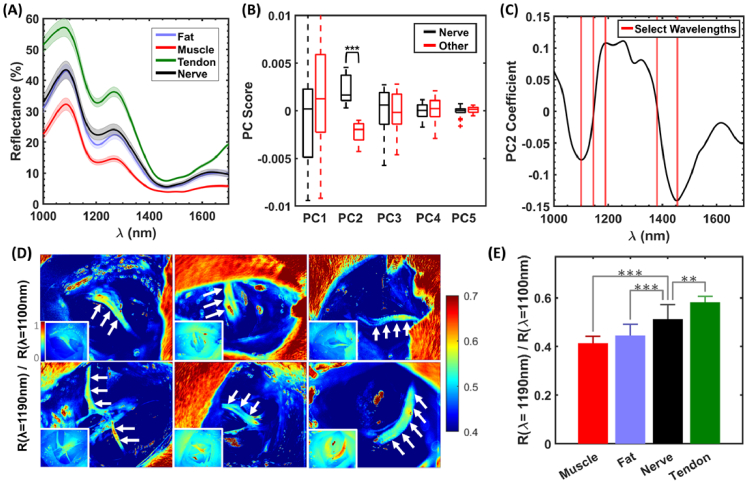
Peripheral nerve damage frequently occurs in challenging surgical cases resulting in high costs and morbidity. Various optical techniques have proven effective in detecting and visually enhancing nerves, demonstrating their translational potential for assisting in nerve-sparing medical procedures. However, there is limited data characterizing the optical properties of nerves in comparison to surrounding tissues, thus limiting the optimization of optical nerve detection systems. To address this gap, the absorption and scattering properties of rat and human nerve, muscle, fat, and tendon were determined from 352-2500 nm. The optical properties highlighted an ideal region in the shortwave infrared for detecting embedded nerves, which remains a significant challenge for optical approaches. A 1000-1700 nm hyperspectral diffuse reflectance imaging system was used to confirm these results and identify optimal wavelengths for nerve imaging contrast in an in vivo rat model. Optimal nerve visualization contrast was achieved using 1190/1100 nm ratiometric imaging and was sustained for nerves embedded under ≥600 µm of fat and muscle. Overall, the results provide valuable insights for optimizing the optical contrast of nerves, including those embedded in tissue, which could lead to improved surgical guidance and nerve-sparing outcomes.


Conflict of interest statement

JSB (F, I, P, E) is a Founder and Chief Scientific Officer of Yaya Scientific, LLC, which has a financial interest in the commercialization of nerve imaging technology developments. JSB, AMJ (P), and GT (P) have a patent pending on imaging-based detection of nerve that is related to the findings of this paper. The remaining authors have no conflicts of interest to declare. All opinions presented in this manuscript belong to the authors alone, and not to any institutions to which they are affiliated with.

Figures

Fig. 1.
Fig. 1.
Systems utilized for optical property determination and shortwave infrared (SWIR) hyperspectral imaging. (A) A dual-beam spectrophotometer collects absolute reflectance and transmittance via real-time normalization of sample reflection to a 99% diffuse reflectance standard. A photomultiplier tube (PMT) collects photons from 352-799 nm and a Peltier cooled lead sulfide (PbS) detector collects photons from 800-2500 nm. (B) Unscattered transmittance is measured by passing a beam through a sample and isolating unscattered forward propogating photons using a pinhole and detector at a sufficient distance. (C) A SWIR (1000-1700 nm) hyperspectral camera acquires images of a rat scaitic nerve and surrounding tissue, with an incandecent source utilized for illumination.
Fig. 2.
Fig. 2.
(A) Mie theory (red), measured (black) and fit (blue) reduced scattering coefficient spectra; (B) mean (± standard deviation) measured (black) and literature (red | Hale and Querry) absorption coefficient spectra; and (C) Mie theory (red) and measured (black) anisotropy factor spectra of 0.54% and 4.78% v/v 1.1-µm polystyrene microspheres in water solutions.
Fig. 3.
Fig. 3.
Mean (± standard error) reduced scattering coefficient spectra for fat (blue), muscle (red), tendon (green), and nerve (black) from (A) rats and (B) human cadavers. Inset in (A) displays anisotropy factor spectra for rat nerve, muscle, and fat. Mean (± standard error) absorption coefficient spectra for fat (blue), muscle (red), tendon (green), and nerve (black) from (C) rats and (D) human cadavers. See Dataset 1 [63] and Dataset 2 [64] for underlying data.
Fig. 4.
Fig. 4.
Optical property-based identification of a promising spectral region for embedded nerve detection. Mean (± standard error) effective penetration depth for (A) rat and (B) human fat (blue), muscle (red), tendon (green) and nerve (black). Monte Carlo simulated diffuse reflectance (± standard error) in the wavelength region of highest effective photon penetration depth for (C) rat and (D) human tissues (2 mm of fat (blue), 3 mm of muscle (red), 1 mm of tendon (green), and 1 mm of nerve (black)). PC1 (black) and PC2/PC3 (red) coefficients as a function of wavelength from (E) rat and (F) human simulated diffuse reflectance show a local maximum coefficient of variance near 1210 nm for PC2 and PC3 respectively.
Fig. 5.
Fig. 5.
Shortwave infrared imaging enhances rat nerve contrast. (A) Mean (± standard error) diffuse reflectance spectra from regions of rat fat (blue | n = 12), muscle (red | n = 19) and nerve (black | n = 19) extracted from hyperspectral cubes from left and right in vivo rat sciatic nerve preparations. Ex vivo mouse tendon spectra (green | n = 6) is shown for reference. (B) Box and whisker plots depicting the distribution of scores for principal components (PCs) 1-5 of nerve spectra (black) and surrounding tissue spectra (red), with PC2 being the most distinct between nerve and surrounding tissue. (C) PC2 coefficients show high variance (1100 nm, 1090 nm and 1455 nm) and low variance (1145 nm and 1380 nm) wavelengths for enhancing nerve contrast. (D) Ratiometric images of 1190 nm to 1100 nm provide enhanced nerve contrast (0.4–0.7 scale | arrows point to nerves). The inset depicts the peak 1085 nm reflectance on a 0–1 scale. (E) R1190/1100 values of nerve (± standard deviation) are significantly different than surrounding tissue (* p ≤ 0.05, ** p ≤ 0.01, *** p ≤ 0.001).
Fig. 6.
Fig. 6.
Detecting nerves under fat and muscle tissue. (A) Ratiometric images (R1190nm/1100nm) of two nerves, normalized to the uncovered nerve (0 mm) ratiometric signal, maintain nerve contrast with 0-1000 µm of overlayed fat. (B) Mean (± standard deviation) nerve contrast (NC) drops to 1/e at 0.68 ± 0.17 mm of overlayed fat. (C) Mean (± standard deviation) NC drops to 1/e at 0.60 ± 0.11 mm of overlayed muscle. The mean and standard deviation of the NC decay curve and the mean R2 value is given by least squares exponential fits from the experimental repetitions (n = 3 rat nerves).

References

    1. Antoniadis G., Kretschmer T., Pedro M. T., König R. W., Heinen C., Richter H.-P., “Iatrogenic Nerve Injuries,” Deutsches Aerzteblatt Online 111(16), 273–279 (2014).10.3238/arztebl.2014.0273 - DOI - PMC - PubMed
    1. Kumar A., Shukla D., Bhat D., Devi Bi., “Iatrogenic peripheral nerve injuries,” Neurol. India 67(7), 135 (2019).10.4103/0028-3886.250700 - DOI - PubMed
    1. Henningsen M. H., Jaeger P., Hilsted K. L., Dahl J. B., “Prevalence of saphenous nerve injury after adductor-canal-blockade in patients receiving total knee arthroplasty: Nerve injury and adductor-canal-blockade,” Acta Anaesthesiol. Scand. 57(1), 112–117 (2013).10.1111/j.1399-6576.2012.02792.x - DOI - PubMed
    1. Stanford J. L., Feng Z., Hamilton A. S., Gilliland F. D., Stephenson R. A., Eley J. W., Albertsen P. C., Harlan L. C., Potosky A. L., “Urinary and Sexual Function After Radical Prostatectomy for Clinically Localized Prostate Cancer: The Prostate Cancer Outcomes Study,” JAMA 283(3), 354 (2000).10.1001/jama.283.3.354 - DOI - PubMed
    1. Wang K., Yee C., Tam S., Drost L., Chan S., Zaki P., Rico V., Ariello K., Dasios M., Lam H., DeAngelis C., Chow E., “Prevalence of pain in patients with breast cancer post-treatment: A systematic review,” Breast 42, 113–127 (2018).10.1016/j.breast.2018.08.105 - DOI - PubMed

LinkOut - more resources