. 2023 Jun 21;3(6):e0001917.
doi: 10.1371/journal.pgph.0001917. eCollection 2023.

Prevalence of long COVID decreases for increasing COVID-19 vaccine uptake

Affiliations

Prevalence of long COVID decreases for increasing COVID-19 vaccine uptake

Manlio De Domenico. PLOS Glob Public Health. .

Abstract

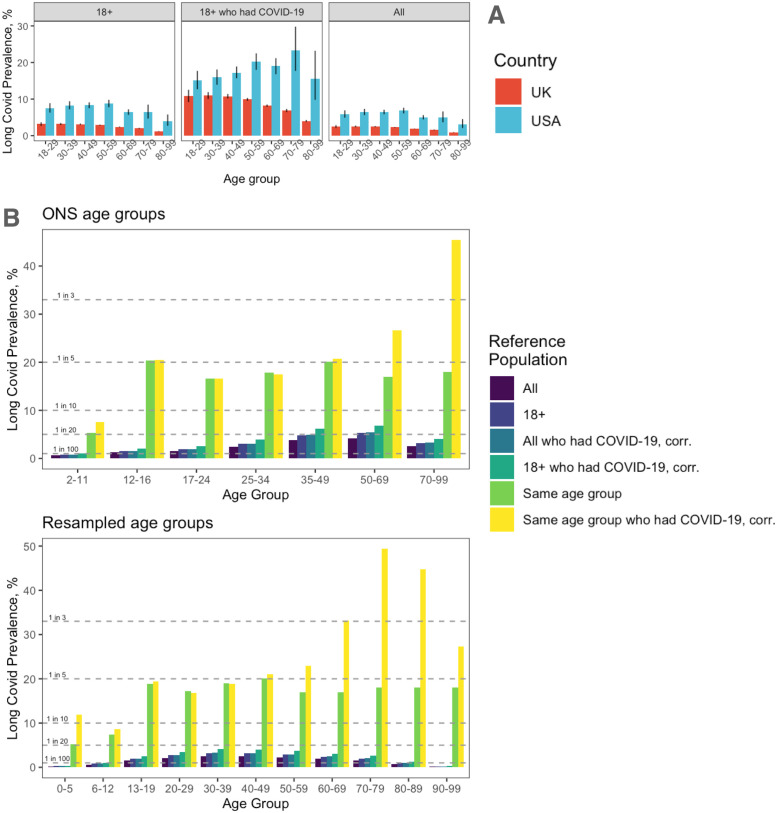
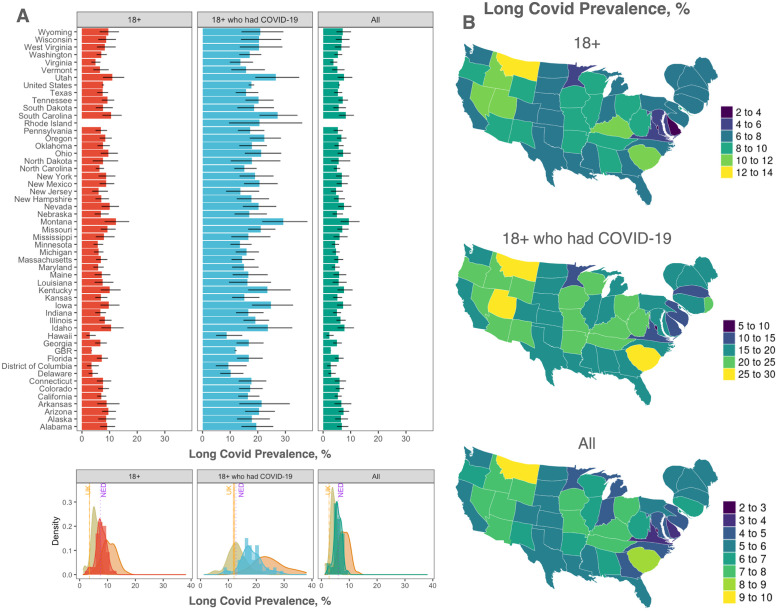
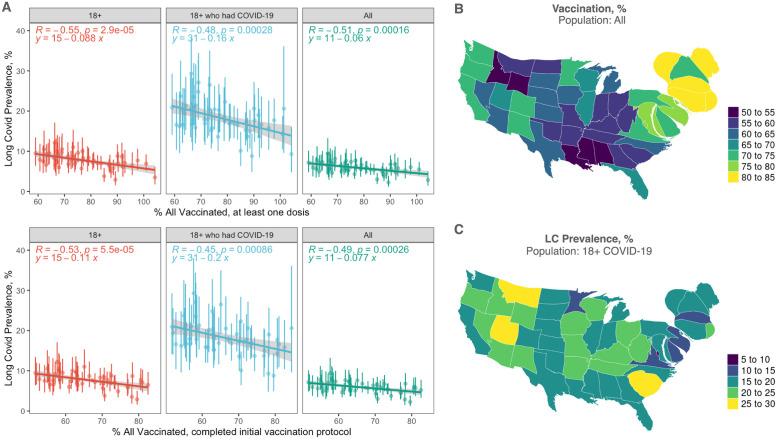
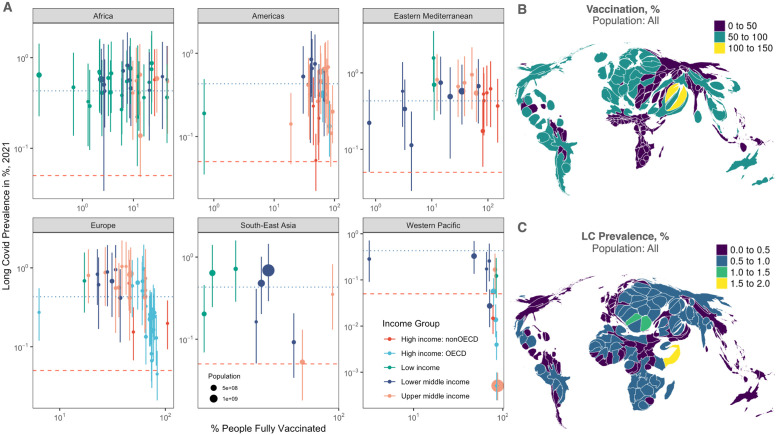
Long COVID is a post-COVID-19 condition characterized by persistent symptoms that can develop after SARS-CoV-2 infection. Estimating and comparing its prevalence across countries is difficult, hindering the quantitative assessment of massive vaccination campaigns as a preventive measure. By integrating epidemiological, demographic and vaccination data, we first reconcile the estimates of long COVID prevalence in the U.K. and the U.S., and estimate a 7-fold yearly increase in the global median prevalence between 2020 and 2022. Second, we estimate that vaccines against COVID-19 decrease the prevalence of long COVID among U.S. adults by 20.9% (95% CI: -32.0%, -9.9%) and, from the analysis of 158 countries, by -15.7% (95% CI: -18.0%, -13.4%) among all who had COVID-19. Our population-level analysis complements the current knowledge from patients data and highlights how aggregated data from fully operational epidemic surveillance and monitoring can inform about the potential impact of long COVID on national and global public health in the next future.


Conflict of interest statement

The authors have declared that no competing interests exist.

Figures

Fig 1
Fig 1. Long COVID prevalence from national surveys.
(A) Age-stratified prevalence with respect to age groups defined by CDC and three distinct reference populations (adults, adults who had COVID-19 and the whole population), for the U.K. and the U.S. (B) Age-stratified prevalence in the U.K. with respect to age groups defined by ONS (top) and resampled into narrower bins (bottom). More reference populations are considered and, for the ones involving people who had COVID-19, we corrected the confirmed number of cases by a factor accounting for undetected ones (Methods).
Fig 2
Fig 2. Long COVID prevalence from national surveys.
(A) Long COVID prevalence in each U.S. state, the U.S. and the U.K. (labeled as GBR) for the same reference populations in panel A (top) and the distribution of their mean, color-coded consistently with the top panels, and the distribution of the corresponding extremal values—i.e., the 95% lower and upper bounds—(middle). For comparison, we have reported the estimates from the U.K. and the Netherlands [51] as vertical lines. (B) Geographic distribution of the prevalence in the corresponding reference populations by means of density-equalizing maps (Methods). Maps are produced with the software R, package maps, based on Natural Earth free vector and raster map data.
Fig 3
Fig 3. Long COVID prevalence decreases with vaccine uptake in the U.S.
(A) Prevalence in U.S. states and the U.S. exhibits a decreasing trend with respect to vaccine uptake, both in the population vaccinated with at least one dose (top) and two doses (bottom), with the largest gap between 100% vaccinated and 100% unvaccinated scenarios observed in the reference population of adults who had COVID-19. The measured correlations are significant (p < 10−3) in all cases and highlights that the larger the vaccine uptake the lower the prevalence of long covid, with the effect further increasing with more robust vaccination protocol. (B) Global density-equalizing maps highlight the geographic distribution of the vaccine uptake. (C) As in B, for the long COVID prevalence. Maps are produced with the software R, package maps, based on Natural Earth free vector and raster map data.
Fig 4
Fig 4. Long COVID prevalence decreases with vaccine uptake, globally.
(A) Analysis similar to the one in Fig 4 performed at a global level, using long COVID prevalence estimates for 2021 in the whole population, stratified by WHO region and income group. Dotted blue lines indicate the global median, whereas the dashed red lines indicate the 1 in 2000 limit, used to define a rare disease. (B) Global density-equalizing maps highlight the geographic distribution of the vaccine uptake. (C) As in B, for the long COVID prevalence. Maps are produced with the software R, package maps, based on Natural Earth free vector and raster map data.

References

    1. World Health Organization et al. A clinical case definition of post COVID-19 condition by a Delphi consensus, 6 October 2021. In: A clinical case definition of post COVID-19 condition by a Delphi consensus, 6 October 2021; 2021.
    1. Crook H, Raza S, Nowell J, Young M, Edison P. Long covid-mechanisms, risk factors, and management. BMJ (Clinical Research ed). 2021;374:n1648–n1648. - PubMed
    1. Michelen M, Manoharan L, Elkheir N, Cheng V, Dagens A, Hastie C, et al.. Characterising long COVID: a living systematic review. BMJ Global Health. 2021;6(9):e005427. doi: 10.1136/bmjgh-2021-005427 - DOI - PMC - PubMed
    1. Aiyegbusi OL, Hughes SE, Turner G, Rivera SC, McMullan C, Chandan JS, et al.. Symptoms, complications and management of long COVID: a review. Journal of the Royal Society of Medicine. 2021;114(9):428–442. doi: 10.1177/01410768211032850 - DOI - PMC - PubMed
    1. Davis HE, Assaf GS, McCorkell L, Wei H, Low RJ, Re’em Y, et al.. Characterizing long COVID in an international cohort: 7 months of symptoms and their impact. EClinicalMedicine. 2021;38:101019. doi: 10.1016/j.eclinm.2021.101019 - DOI - PMC - PubMed

LinkOut - more resources