

Disruption of proteome by an oncogenic fusion kinase alters metabolism in fibrolamellar hepatocellular carcinoma
- PMID: 37343102
- PMCID: PMC10284549
- DOI: 10.1126/sciadv.adg7038
Disruption of proteome by an oncogenic fusion kinase alters metabolism in fibrolamellar hepatocellular carcinoma
Abstract
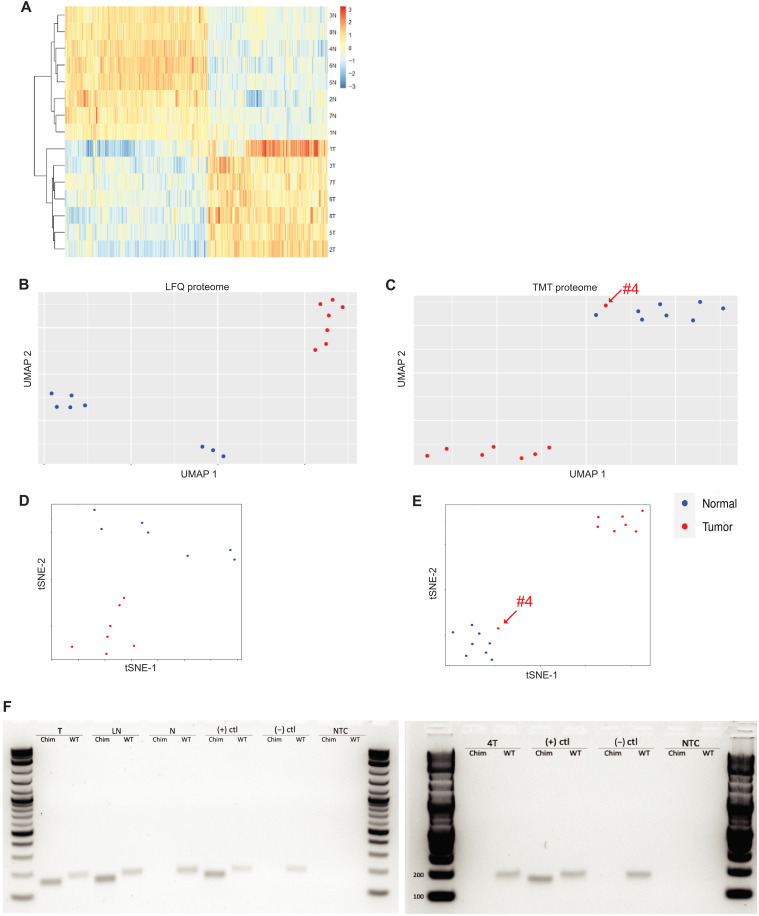
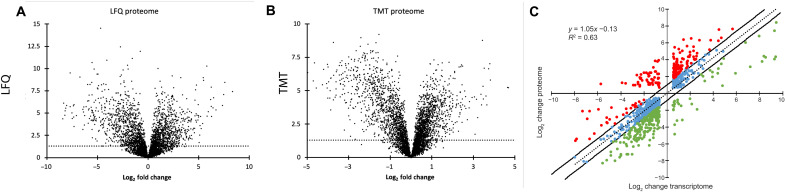
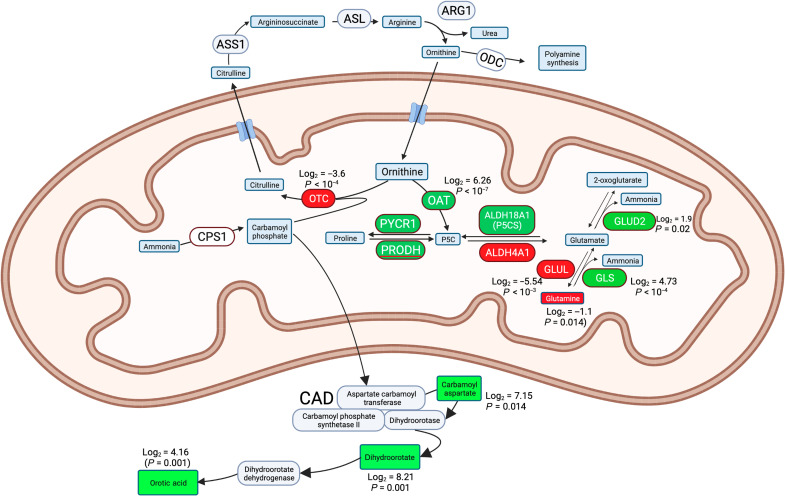
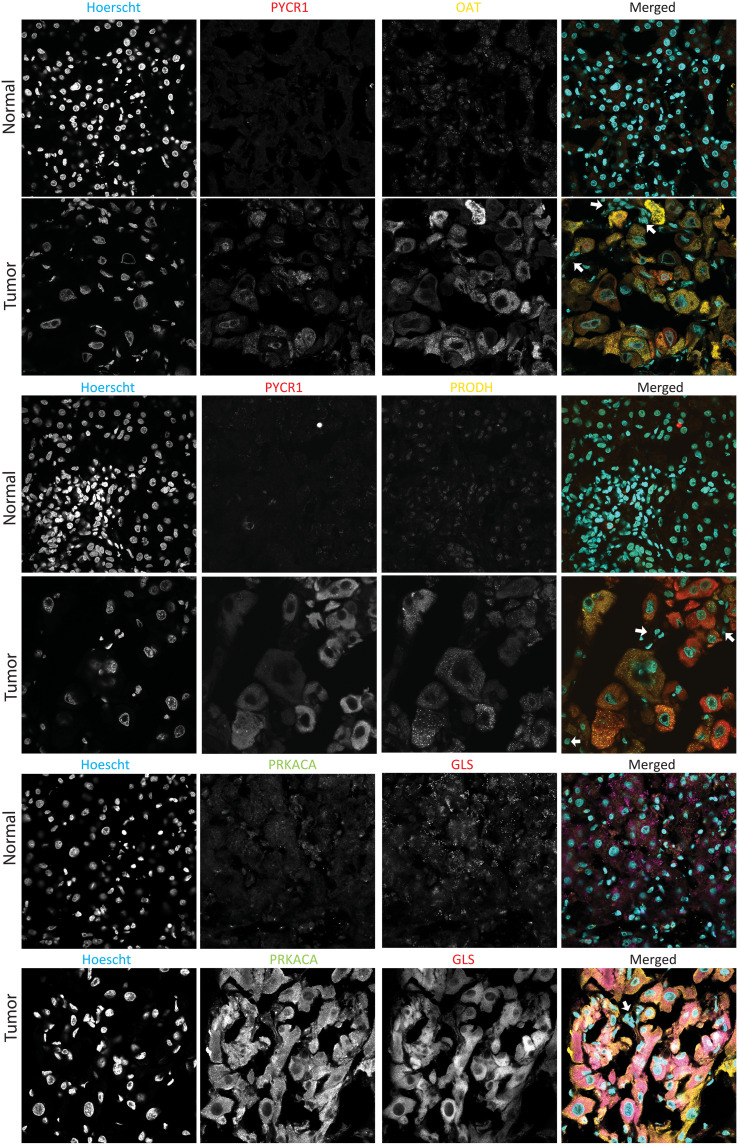
Fibrolamellar hepatocellular carcinoma (FLC) is a usually lethal primary liver cancer driven by a somatic dysregulation of protein kinase A. We show that the proteome of FLC tumors is distinct from that of adjacent nontransformed tissue. These changes can account for some of the cell biological and pathological alterations in FLC cells, including their drug sensitivity and glycolysis. Hyperammonemic encephalopathy is a recurrent problem in these patients, and established treatments based on the assumption of liver failure are unsuccessful. We show that many of the enzymes that produce ammonia are increased and those that consume ammonia are decreased. We also demonstrate that the metabolites of these enzymes change as expected. Thus, hyperammonemic encephalopathy in FLC may require alternative therapeutics.
Figures
Similar articles
-
Increased Protein Kinase A Activity Induces Fibrolamellar Hepatocellular Carcinoma Features Independent of DNAJB1.Cancer Res. 2024 Aug 15;84(16):2626-2644. doi: 10.1158/0008-5472.CAN-23-4110. Cancer Res. 2024. PMID: 38888469 Free PMC article.
-
Hyperammonemic encephalopathy: a rare presentation of fibrolamellar hepatocellular carcinoma.Am J Med Sci. 2009 Dec;338(6):522-4. doi: 10.1097/MAJ.0b013e3181bccfb4. Am J Med Sci. 2009. PMID: 20010160
-
BAP1 mutations define a homogeneous subgroup of hepatocellular carcinoma with fibrolamellar-like features and activated PKA.J Hepatol. 2020 May;72(5):924-936. doi: 10.1016/j.jhep.2019.12.006. Epub 2019 Dec 18. J Hepatol. 2020. PMID: 31862487
-
How Do I Diagnose Fibrolamellar Carcinoma?Mod Pathol. 2025 Apr;38(4):100711. doi: 10.1016/j.modpat.2025.100711. Epub 2025 Jan 13. Mod Pathol. 2025. PMID: 39814265 Review.
-
Models of fibrolamellar carcinomas, tools for evaluation of a new era of treatments.Front Immunol. 2024 Nov 8;15:1459942. doi: 10.3389/fimmu.2024.1459942. eCollection 2024. Front Immunol. 2024. PMID: 39582856 Free PMC article. Review.
Cited by
-
DNAJB1-PRKACA Fusion Drives Fibrolamellar Liver Cancer through Impaired SIK Signaling and CRTC2/p300-Mediated Transcriptional Reprogramming.Cancer Discov. 2025 Feb 7;15(2):382-400. doi: 10.1158/2159-8290.CD-24-0634. Cancer Discov. 2025. PMID: 39326063 Free PMC article.
-
Mitochondrial calcium signaling regulates branched-chain amino acid catabolism in fibrolamellar carcinoma.Sci Adv. 2025 May 30;11(22):eadu9512. doi: 10.1126/sciadv.adu9512. Epub 2025 May 28. Sci Adv. 2025. PMID: 40435263 Free PMC article.
-
Increased Protein Kinase A Activity Induces Fibrolamellar Hepatocellular Carcinoma Features Independent of DNAJB1.Cancer Res. 2024 Aug 15;84(16):2626-2644. doi: 10.1158/0008-5472.CAN-23-4110. Cancer Res. 2024. PMID: 38888469 Free PMC article.
-
Mitochondrial Calcium Signaling Regulates Branched-Chain Amino Acid Catabolism in Fibrolamellar Carcinoma.bioRxiv [Preprint]. 2024 Nov 30:2024.05.27.596106. doi: 10.1101/2024.05.27.596106. bioRxiv. 2024. Update in: Sci Adv. 2025 May 30;11(22):eadu9512. doi: 10.1126/sciadv.adu9512. PMID: 38853984 Free PMC article. Updated. Preprint.
-
Proteo-metabolomics and patient tumor slice experiments point to amino acid centrality for rewired mitochondria in fibrolamellar carcinoma.Cell Rep Med. 2024 Sep 17;5(9):101699. doi: 10.1016/j.xcrm.2024.101699. Epub 2024 Aug 28. Cell Rep Med. 2024. PMID: 39208801 Free PMC article.
References
-
- T. Eggert, K. A. McGlynn, A. Duffy, M. P. Manns, T. F. Greten, S. F. Altekruse, Fibrolamellar hepatocellular carcinoma in the USA, 2000-2010: A detailed report on frequency, treatment and outcome based on the surveillance, epidemiology, and end results database. United European Gastroenterol. J 1, 351–357 (2013). - PMC - PubMed
-
- A. G. Fritz, International Classification of Diseases for Oncology : ICD-O. (World Health Organization, 3rd ed., First revision, 2013), pp. viii, 242 pages.
MeSH terms
Substances
Supplementary concepts
Grants and funding
LinkOut - more resources
Full Text Sources
Medical
