. 2023 Jun;11(6):e006589.
doi: 10.1136/jitc-2022-006589.

G-CSF rescue of FOLFIRINOX-induced neutropenia leads to systemic immune suppression in mice and humans

Affiliations

G-CSF rescue of FOLFIRINOX-induced neutropenia leads to systemic immune suppression in mice and humans

Victoire Cardot-Ruffino et al. J Immunother Cancer. 2023 Jun.

Abstract

Background: Recombinant granulocyte colony-stimulating factor (G-CSF) is routinely administered for prophylaxis or treatment of chemotherapy-induced neutropenia. Chronic myelopoiesis and granulopoiesis in patients with cancer has been shown to induce immature monocytes and neutrophils that contribute to both systemic and local immunosuppression in the tumor microenvironment. The effect of recombinant G-CSF (pegfilgrastim or filgrastim) on the production of myeloid-derived suppressive cells is unknown. Here we examined patients with pancreatic cancer, a disease known to induce myeloid-derived suppressor cells (MDSCs), and for which pegfilgrastim is routinely administered concurrently with FOLFIRINOX but not with gemcitabine-based chemotherapy regimens.

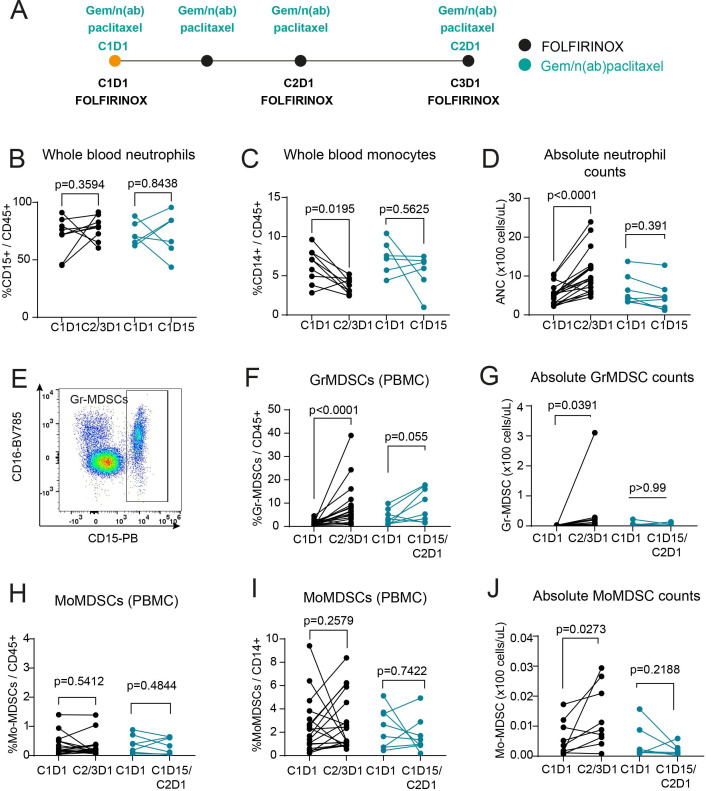
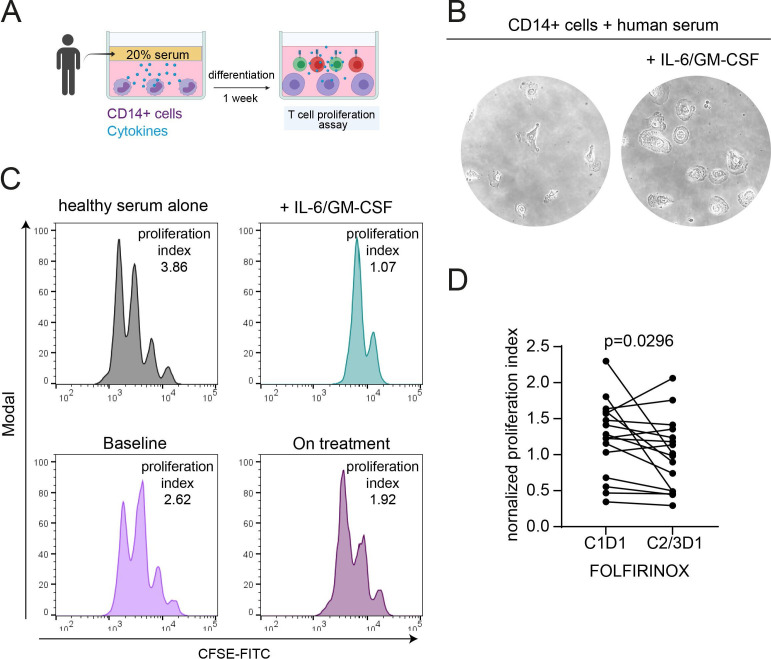
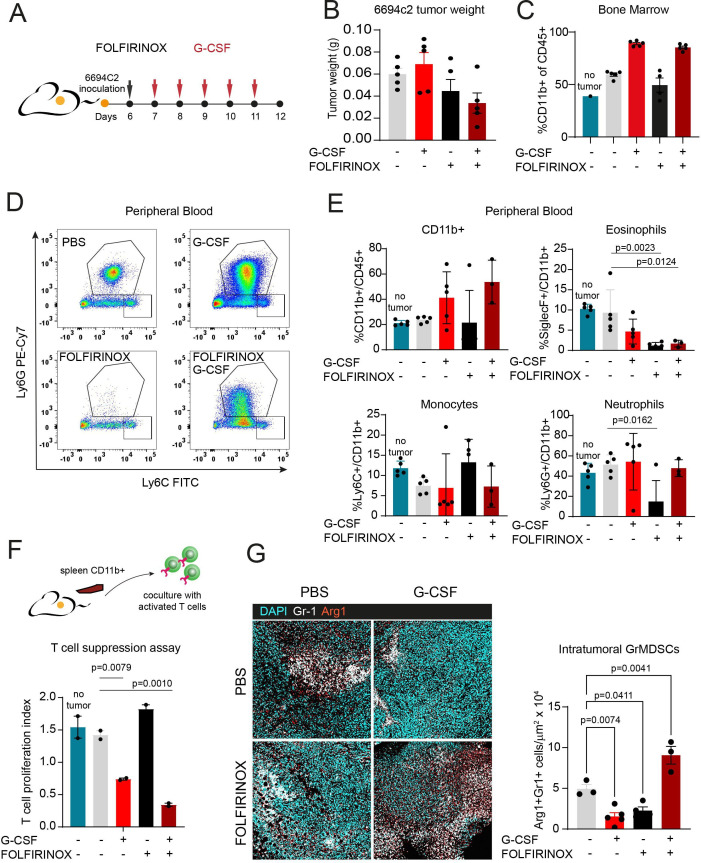
Methods: Serial blood was collected from patients with pancreatic ductal adenocarcinoma newly starting on FOLFIRINOX or gemcitabine/n(ab)paclitaxel combination chemotherapy regimens. Neutrophil and monocyte frequencies were determined by flow cytometry from whole blood and peripheral blood mononuclear cell fractions. Serum cytokines were evaluated pretreatment and on-treatment. Patient serum was used in vitro to differentiate healthy donor monocytes to MDSCs as measured by downregulation of major histocompatibility complex II (HLA-DR) and the ability to suppress T-cell proliferation in vitro. C57BL/6 female mice with pancreatic tumors were treated with FOLFIRINOX with or without recombinant G-CSF to directly assess the role of G-CSF on induction of immunosuppressive neutrophils.

Results: Patients receiving FOLFIRINOX with pegfilgrastim had increased serum G-CSF that correlated with an induction of granulocytic MDSCs. This increase was not observed in patients receiving gemcitabine/n(ab)paclitaxel without pegfilgrastim. Interleukin-18 also significantly increased in serum on FOLFIRINOX treatment. Patient serum could induce MDSCs as determined by in vitro functional assays, and this suppressive effect increased with on-treatment serum. Induction of MDSCs in vitro could be recapitulated by addition of recombinant G-CSF to healthy serum, indicating that G-CSF is sufficient for MDSC differentiation. In mice, neutrophils isolated from spleen of G-CSF-treated mice were significantly more capable of suppressing T-cell proliferation.

Conclusions: Pegfilgrastim use contributes to immune suppression in both humans and mice with pancreatic cancer. These results suggest that use of recombinant G-CSF as supportive care, while critically important for mitigating neutropenia, may complicate efforts to induce antitumor immunity.

Keywords: cytokines; gastrointestinal neoplasms; immunotherapy; myeloid-derived suppressor cells; neutrophil infiltration.


Conflict of interest statement

Competing interests: SKD received research funding unrelated to this project from Eli Lilly and Company, Novartis Pharmaceuticals, Genocea, and Bristol-Myers Squibb and is a founder, science advisory board member and equity holder in Kojin. MD has research funding from Eli Lilly; he has received consulting fees from Genentech, ORIC Pharmaceuticals, Partner Therapeutics, SQZ Biotech, AzurRx, Eli Lilly, Mallinckrodt Pharmaceuticals, Aditum, Foghorn Therapeutics, Palleon, and Moderna; and he is a member of the Scientific Advisory Board for Neoleukin Therapeutics, Veravas and Cerberus Therapeutics. HS receives research funding from AstraZeneca and consulting fees from Merck and Dewpoint Therapeutics. DAR is on the scientific advisory board of AxialTx and a consultant for Boston Scientific and Instylla. MBY receives research funding from Janssen Oncology and fees for peer review services from UpToDate. NJM receives research funding from Bristol-Myers Squibb. PCE has received consulting fees from ALX Oncology, Arcus Bioscience, Astellas, AstraZeneca, Blueprint Medicines, Celgene, Coherus, Daiichi-Sankyo, Five Prime, Ideaya, Istari, Legend, Lilly, Loxo, Merck, Novartis, Ono, Servier, Taiho, Takeda, Turning Point, Therapeutics, Xencor, and Zymeworks. KN received research funding from Pharmavite, Evergrande Group, Janssen, Revolution Medicines and is on the SAB or received consulting fees from Bayer, GlaxoSmithKline, and Pfizer. BMW receives consulting fees from Celgene, GRAIL, and Mirati and research support from Celgene, Eli Lilly, Novartis, and Revolution Medicines.

Figures

Figure 1
Figure 1
Patients receiving FOLFIRINOX show an increase in circulating Gr-MDSCs. (A) Timing of treatments received by the FOLFIRINOX group and the gemcitabine/n(ab)paclitaxel group of patients with metastatic pancreatic cancer. (B,C) Whole blood collected at cycle 1 day 1 (C1D1) of treatment and either cycle 2 day 1 or cycle 3 day 1 (C2/3D1) of FOLFIRINOX treatment or C1D15 of gemcitabine/n(ab)paclitaxel treatment was stained with the antibodies indicated in online supplemental file 2 and analyzed by flow cytometry. N=9 FOLFIRINOX; N=7 gem/n(ab)paclitaxel. Percentage of CD15+ neutrophils (B) and CD14+ monocytes (C) out of total CD45+ immune cells. (D) Absolute neutrophil counts (ANC) values were obtained from patient records corresponding to the same time points analyzed in B and C. Patients were included even if no corresponding flow cytometry was performed on whole blood. N=18 FOLFIRINOX; N=8 gem/n(ab)paclitaxel. (E) Representative flow cytometry plot showing the Gr-MDSCs gating strategy. (F–J) Peripheral blood mononuclear cells were collected by density gradient centrifugation using Ficoll and analyzed by flow cytometry according to the gating scheme shown in online supplemental file 2. (F) Percentage of Gr-MDSCs (CD45+CD33+ CD15+) N=19 FOLFIRINOX; N=8 gem/n(ab)paclitaxel. (G) Absolute counts of Gr-MDSCs from PBMC fraction were calculated from patient samples where whole blood neutrophil frequencies and ANC values were known. N=9 FOLFIRINOX; N=6 gem/n(ab)paclitaxel. (H) Mo-MDSCs (CD45+CD33+ CD15 CD14+) out of total CD45+ immune cells. N=19 FOLFIRINOX; N=8 gem/n(ab)paclitaxel. (I) Mo-MDSCs out of total CD14+ cells. N=19 FOLFIRINOX; N=8 gem/n(ab)paclitaxel. (J) Absolute counts of Gr-MDSCs from PBMC fraction were calculated from patient samples where whole blood neutrophil frequencies and ANC values were known. N=9 FOLFIRINOX; N=6 gem/n(ab)paclitaxel. Wilcoxon matched-pairs signed-rank test was used throughout. Gr-MDSCs, granulocytic MDSCs; MDSCs, myeloid-derived suppressor cells; Mo-MDSCs, monocytic MDSCs; PBMC, peripheral blood mononuclear cell.
Figure 2
Figure 2
G-CSF and IL-18 are increased in patients on FOLFIRINOX treatment. Serum from patients receiving FOLFIRINOX, gemcitabine/n(ab)paclitaxel, or healthy donor serum were analyzed for the indicated cytokine and chemokines by cytokine bead array. Samples were collected at cycle 1 day 1 (C1D1) of treatment and either cycle 2 day 1 or cycle 3 day 1 (C2/3D1) of FOLFIRINOX treatment or C1D15 of gemcitabine/n(ab)paclitaxel treatment. (A) Circulating levels of G-CSF. N=17 FOLFIRINOX and N=6 gemcitabine/n(ab)paclitaxel. (B) Correlation between serum G-CSF from FOLFIRINOX-treated patients and the percentage of Gr-MDSCs at C2D1 or C3D1. N=12 patients had paired data for analysis. Pearson’s correlation was used for statistical analysis. (C–J) Circulating levels of IL-18, IL1β, IL-6, TNFα, IL-1RA, IL-8, CXCL1 and CXCL5. Mean values of the healthy control samples are indicated with a dashed line. N=17 FOLFIRINOX and N=6 gemcitabine/n(ab)paclitaxel. Wilcoxon matched-pairs signed-rank test was used throughout. CXCL, C-X-C motif chemokine; G-CSF, granulocyte colony-stimulating factor; Gr-MDSCs, granulocytic MDSCs; IL, interleukin; IL-1RA, IL-1R antagonist; TNF, tumor necrosis factor.
Figure 3
Figure 3
Serum from FOLFIRINOX-treated patients can induce Mo-MDSCs in vitro. (A) Diagram of the serum suppression assay. Healthy monocytes are differentiated for 7 days in media containing 20% healthy donor or patient serum or recombinant IL-6/GM-CSF and then cocultured with CFSE-labeled T cells from a healthy donor and anti-CD3/CD28 beads. (B) Brightfield images (×40) of monocytes cultured for 7 days with either healthy donor serum alone or healthy donor serum plus 10 ng each of IL-6 and GM-CSF (iMDSCs). (C) T-cell proliferation after 72 hours of culture with the indicated Mo-MDSC populations was measured by flow cytometry for CFSE dye dilution. Plots are labeled with the source of the serum used for Mo-MDSC differentiation. Proliferation index is denoted in the corner of each representative flow cytometry plot. Representative of N=16 paired patient samples. (D) Mo-MDSCs were differentiated from healthy monocytes as shown in A using serum of FOLFIRINOX-treated patients from cycle 1 day 1 (C1D1) and either C2D1 or C3D1 (C2/3D1). Suppressive capacity of the in vitro differentiated Mo-MDSCs was assessed by cocultured with activated healthy donor T cells and measurement of T-cell proliferation after 72 hours of by flow cytometry for CFSE dye dilution. N=16 FOLFIRINOX. Wilcoxon matched-pairs signed-rank test was used for statistical analysis. GM-CSF, granulocyte macrophage colony-stimulating factor; IL, interleukin; iMDSCs, induced Mo-MDSCs; MDSCs, myeloid-derived suppressor cells; Mo-MDSCs, monocytic MDSCs.
Figure 4
Figure 4
Recombinant G-CSF is sufficient to induce suppressive, MHC class II-low Mo-MDSCs in vitro. (A) Monocytes were obtained from healthy donor blood using positive selection on CD14+ magnetic beads. Monocyte were then cultured in vitro with 75 pg/mL M-CSF and the indicated concentrations of G-CSF or GM-CSF/IL-6 for 7 days. Induced Mo-MDSCs were then cultured with CFSE-labeled T cells for 3 days coculture at a 1:1 ratio, and T-cell proliferation was assessed by flow cytometry. Representative of three independent experiments. (B) Representative flow cytometry plots showing the gating strategy for MDSCs-induced in vitro. MHC-II (HLA-DR) expression on induced MDSCs is typically low. (C) Flow plot and quantification of HLA-DR mean fluorescence intensity of CD33+ SSCA high cells after monocytes were cultured for days with 75 pg/mL M-CSF with the addition of G-CSF (200 pg/mL or 10 ng/mL) or 10 ng/mL each of GM-CSF and IL-6. Representative of four independent experiments. GM-CSF, granulocyte macrophage CSF; IL, interleukin; MDSCs, myeloid-derived suppressor cells; MHC, major histocompatibility complex; Mo-MDSCs, monocytic MDSCs.
Figure 5
Figure 5
G-CSF-induced neutrophils in mice are more immunosuppressive than neutrophils induced by the cancer alone. (A) Diagram of mouse inoculation with 6694C2 pancreatic tumor cells different treatments received. FOLFIRINOX was dosed intravenously (oxaliplatin: 5 mg/kg, 5-FU: 15 mg/kg, irinotecan: 50 mg/kg, leucovorin: 75 mg/kg) and G-CSF was dosed intraperitoneally (clinical grade Neulasta, 20 µg/mouse per day). (B) Tumor weight on day 12 did not significantly differ among the treatment groups. n=4–5 mice per group. Representative of three independent experiments. (C) Bone marrow was harvested from mice treated as in A, as well as non-tumor bearing mice. Single cell suspensions were stained for CD11b and analyzed by flow cytometry. n=4–5 mice per group. Representative of three independent experiments. (D) Representative flow plots of Ly6G and Ly6C expression gated on CD11b+ live cells from blood of mice treated with PBS, G-CSF, FOLFIRINOX or FOLFIRINOX+G-CSF. Representative of three independent experiments. (E) Bar graph representing the per cent CD11b+ cells out of total CD45+ cells and the percentage of eosinophils, Mo-MDSCs and neutrophils out of CD11b+ cells in blood from non-tumor bearing mice (teal bars) or tumor bearing mice treated with PBS, G-CSF, FOLFIRINOX or FOLFIRINOX+G CSF. n=3–5 mice per group. Representative of three independent experiments. (F) Neutrophils were enriched using a negative magnetic bead enrichment strategy for isolating live neutrophils from spleens of naïve mice or tumor-bearing mice from each treatment group (PBS, G-CSF, FOLFIRINOX or FOLFIRINOX+G CSF). T cells from healthy mice were labeled with CFSE, stimulated with anti-CD3/CD28 beads and cocultured with freshly isolated CD11b+ cells at a 1:1 ratio. CD8 T-cell proliferation was measured by flow cytometry for CFSE dye-dilution 72 hours later and proliferation indexes were calculated. n=2 pooled samples from two to three mice each. Representative of two independent experiments. (G) Immunofluorescence images and quantification of Gr-MDSCs (Arg1+Gr1+) in frozen tumor slices from PBS, G-CSF, FOLFIRINOX or FOLFIRINOX+G-CSF treated mice. Representative of n=3–5 mice per group and one experimental replicate. One-way analysis of variance with multiple hypothesis testing was used for statistical analysis. Arg1, arginase; GM-CSF, granulocyte macrophage colony-stimulating factor; Gr-MDSCs, granulocytic myeloid-derived suppressor cells; Mo-MDSCs, monocytic MDSCs; PBS, phosphate-buffered saline.

References

    1. Swirski FK, Nahrendorf M, Etzrodt M, et al. . Identification of splenic reservoir monocytes and their deployment to inflammatory sites. Science 2009;325:612–6. 10.1126/science.1175202 - DOI - PMC - PubMed
    1. Srivastava MK, Sinha P, Clements VK, et al. . Myeloid-derived Suppressor cells inhibit T-cell activation by Depleting Cystine and Cysteine. Cancer Res 2010;70:68–77. 10.1158/0008-5472.CAN-09-2587 - DOI - PMC - PubMed
    1. Veglia F, Sanseviero E, Gabrilovich DI. Myeloid-derived Suppressor cells in the era of increasing myeloid cell diversity. Nat Rev Immunol 2021;21:485–98. 10.1038/s41577-020-00490-y - DOI - PMC - PubMed
    1. Krall JA, Reinhardt F, Mercury OA, et al. . The systemic response to surgery triggers the outgrowth of distant immune-controlled tumors in mouse models of dormancy. Sci Transl Med 2018;10:eaan3464. 10.1126/scitranslmed.aan3464 - DOI - PMC - PubMed
    1. Wellenstein MD, Coffelt SB, Duits DEM, et al. . Loss of P53 triggers WNT-dependent systemic inflammation to drive breast cancer metastasis. Nature 2019;572:538–42. 10.1038/s41586-019-1450-6 - DOI - PMC - PubMed